
Exhibit 14-5
You are given the following information about y and x.
Refer to Exhibit 14-5. The least squares estimate of b0 (intercept) equals
a. 1
b. -1
c. 6
d. 5
A survey of a sample of business students resulted in the following information
regarding the genders of the individuals and their major.
a. What is the probability of selecting an individual who is majoring in Marketing?
b. What is the probability of selecting an individual who is majoring in Management,
given that the person is female?
c. Given that a person is male, what is the probability that he is majoring in
Management?

d. What is the probability of selecting a male individual?
The coefficient of variation is
a. the same as the variance
b. the square root of the variance
c. the square of the standard deviation
d. None of the other answers are correct.
Exhibit 13-7
The following is part of an ANOVA table, which was the results of three treatments and
a total of 15 observations.
Refer to Exhibit 13-7. The number of degrees of freedom corresponding to between
treatments is
a. 12
b. 2
c. 3

d. 4
Exhibit 18-1
Ten people were given two types of cereal, Brand X and Brand Y. Three people
preferred Brand X, 5 people preferred Brand Y, and 2 people were undecided. We want
to determine whether or not the two products are equal.
Refer to Exhibit 18-1. The null hypothesis should be
a. rejected
b. not rejected
c. revised
d. None of these alternatives is correct.
Exhibit 9-4
A random sample of 16 students selected from the student body of a large university
had an average age of 25 years. We want to determine if the average age of all the
students at the university is significantly different from 24. Assume the distribution of
the population of ages is normal with a standard deviation of 2 years.
Refer to Exhibit 9-4. At a .05 level of significance, it can be concluded that the mean
age is

a. not significantly different from 24
b. significantly different from 24
c. significantly less than 24
d. significantly less than 25
Exhibit 12-1
When individuals in a sample of 150 were asked whether or not they supported capital
punishment, the following information was obtained.
We are interested in determining whether or not the opinions of the individuals (as to
Yes, No, and No Opinion) are uniformly distributed.
Refer to Exhibit 12-1. The hypothesis is to be tested at the 5% level of significance. The
critical value from the table equals
a. 7.37776
b. 7.81473
c. 5.99147
d. 9.34840

The academic planner of a university thinks that at least 35% of the entire student body
attends summer school. The correct set of hypotheses to test his belief is
a. H0: p > 0.35 Ha: p 0.35
b. H0: p 0.35 Ha: p > 0.35
c. H0: p 0.35 Ha: p < 0.35
d. H0: p > 0.35 Ha: p 0.35
X is a normally distributed random variable with a mean of 22 and a standard deviation
of 5. The probability that x is less than 9.7 is
a. 0.000
b. 0.4931
c. 0.0069
d. 0.9931
A tabular summary of data showing the percentage of items in each of several
nonoverlapping classes is a
a. frequency distribution
b. relative frequency distribution
c. percent frequency distribution
d. cumulative percent frequency distribution

A graphical display of a frequency distribution, relative frequency distribution, or
percent frequency distribution of quantitative data constructed by placing the class
intervals on the horizontal axis and the frequencies on the vertical axis is a
a. histogram
b. bar chart
c. stem-and-leaf display
d. pie chart
A random sample of 25 observations was taken from a normally distributed population.
The average in the sample was 84.6 with a variance of 400.
a. Construct a 90% confidence interval for
.
b. Construct a 99% confidence interval for
.
c. Discuss why the 90% and 99% confidence intervals are different.
d. What would you expect to happen to the confidence interval in part a if the sample
size was increased? Be sure to explain your answer.
Excel’s NORM.DIST function can be used to compute
a. cumulative probabilities for a standard normal z value
b. the standard normal z value given a cumulative probability
c. cumulative probabilities for a normally distributed x value
d. the normally distributed x value given a cumulative probability
A Type I error is committed when
a. a true alternative hypothesis is not accepted
b. a true null hypothesis is rejected
c. the critical value is greater than the value of the test statistic
d. sample data contradict the null hypothesis
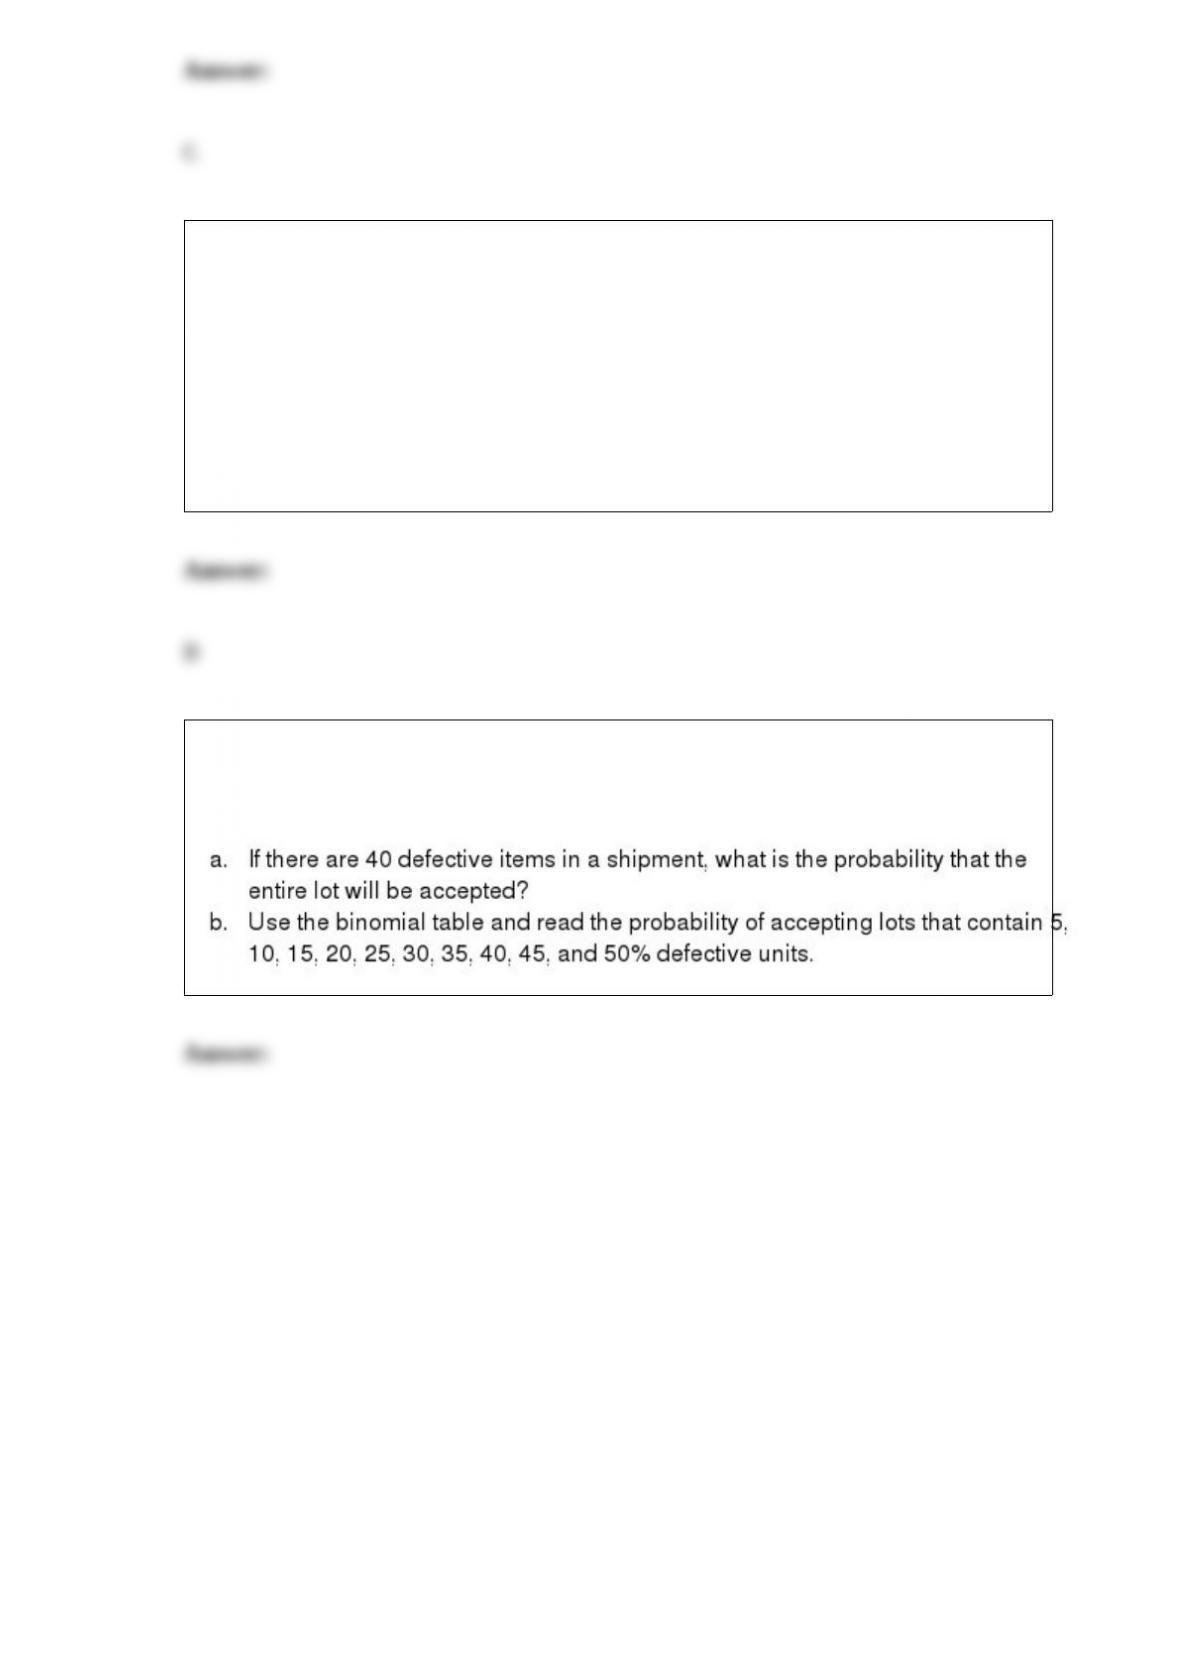
The quality control department of a company has decided to select a sample of 10 items
from the shipments received; and if the sample contains no defective parts, the entire
shipment will be accepted.

Exhibit 11-7
We want to test the hypothesis that population B has a smaller variance than population
A.
Refer to Exhibit 11-7. The test statistic for this problem equals
a. .77
b. .88
c. 1.14
d. 1.29
Exhibit 6-5
The weight of items produced by a machine is normally distributed with a mean of 8
ounces and a standard deviation of 2 ounces.
Refer to Exhibit 6-5. What percentage of items will weigh between 6.4 and 8.9 ounces?
a. 0.1145

b. 0.2881
c. 0.1736
d. 0.4617
It is possible for the coefficient of determination to be
a. larger than 1
b. less than one
c. less than zero
d. All of these answers are correct, depending on the situation under consideration.
The weight of bags of cement filled by Granite Rock Company’s packaging process is
normally distributed with a mean of 50 pounds and a standard deviation of 1.5 pounds
when the process is in control. What should the control limits be for a sample mean, ,
chart if 9 bags are sampled at a time?
50. Regarding a regression model, all of the following can be negative except the
1. coefficient of determination
2. coefficient of correlation
3. coefficient of ‘œx’ in the regression equation
4. y-intercept in the regression equation
•
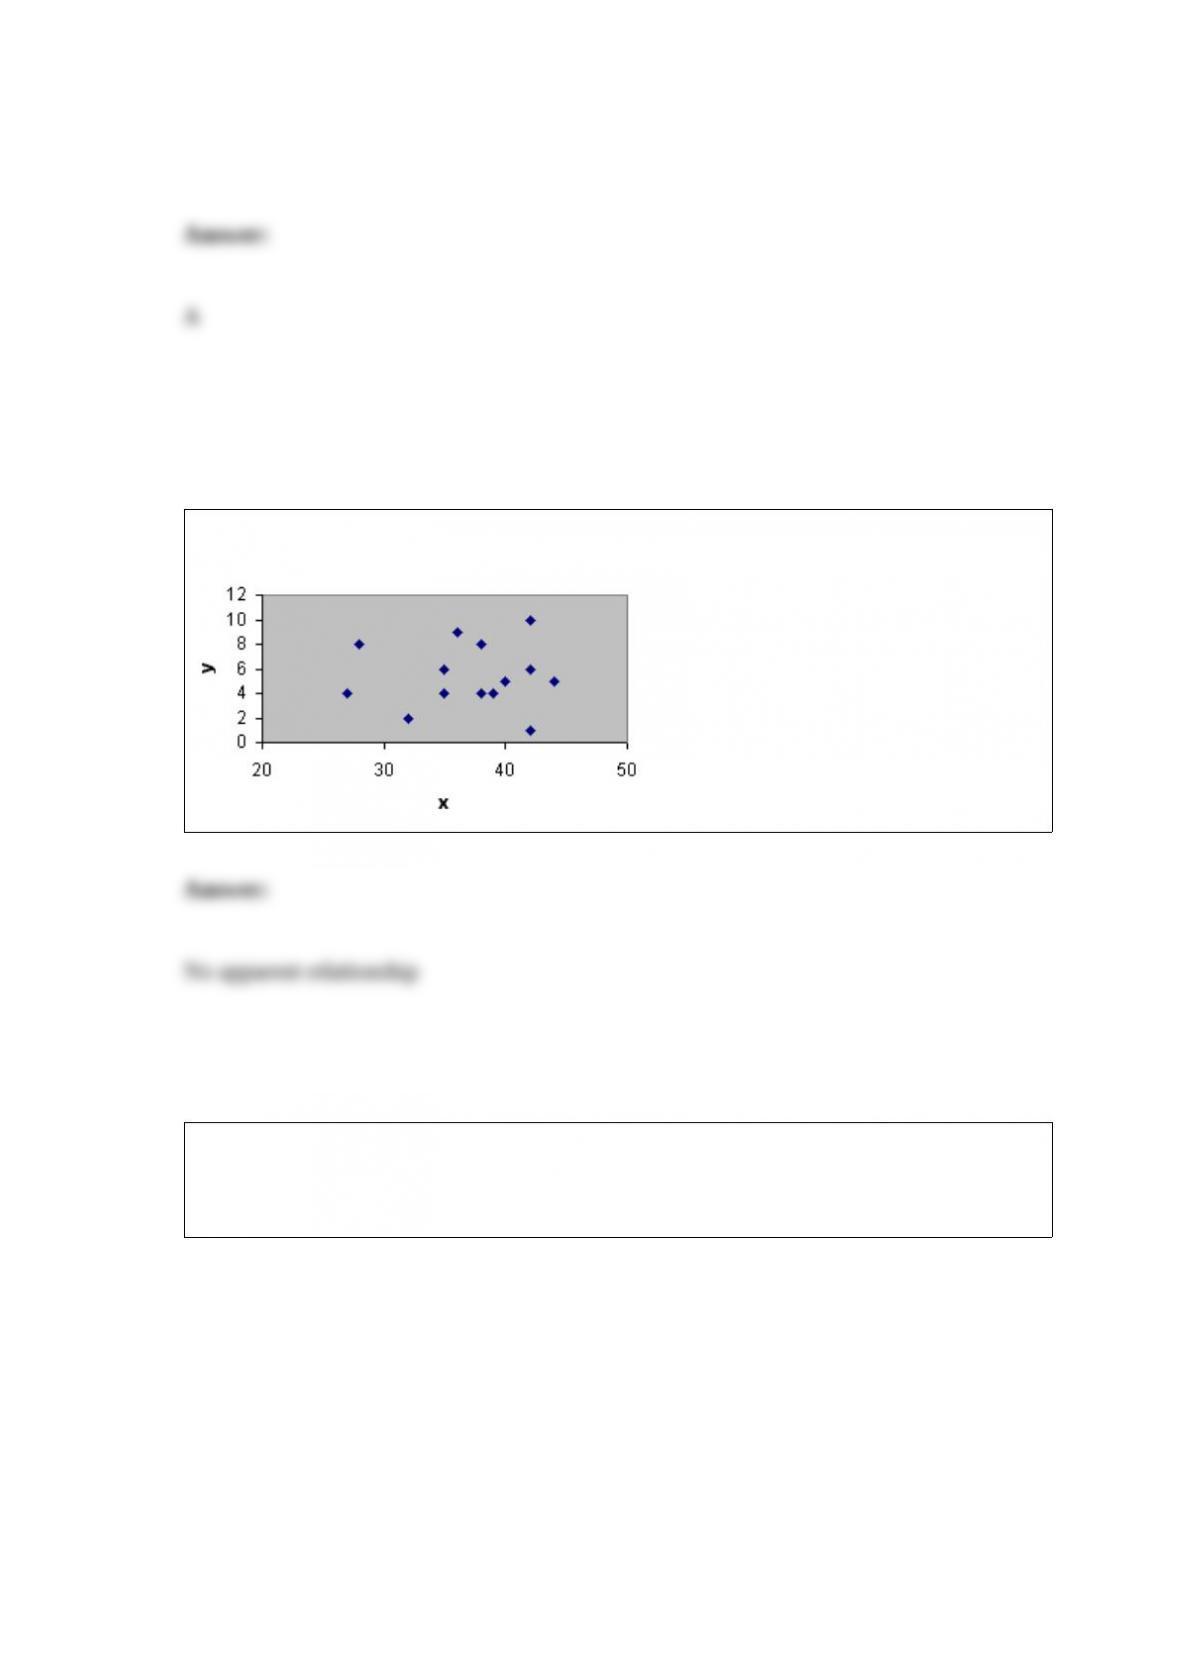
What type of relationship is depicted in the following scatter diagram?
A clothing manufacturer purchased some newly designed sewing machines in the hopes
that production would be increased. The production records of a random sample of
workers are shown below.
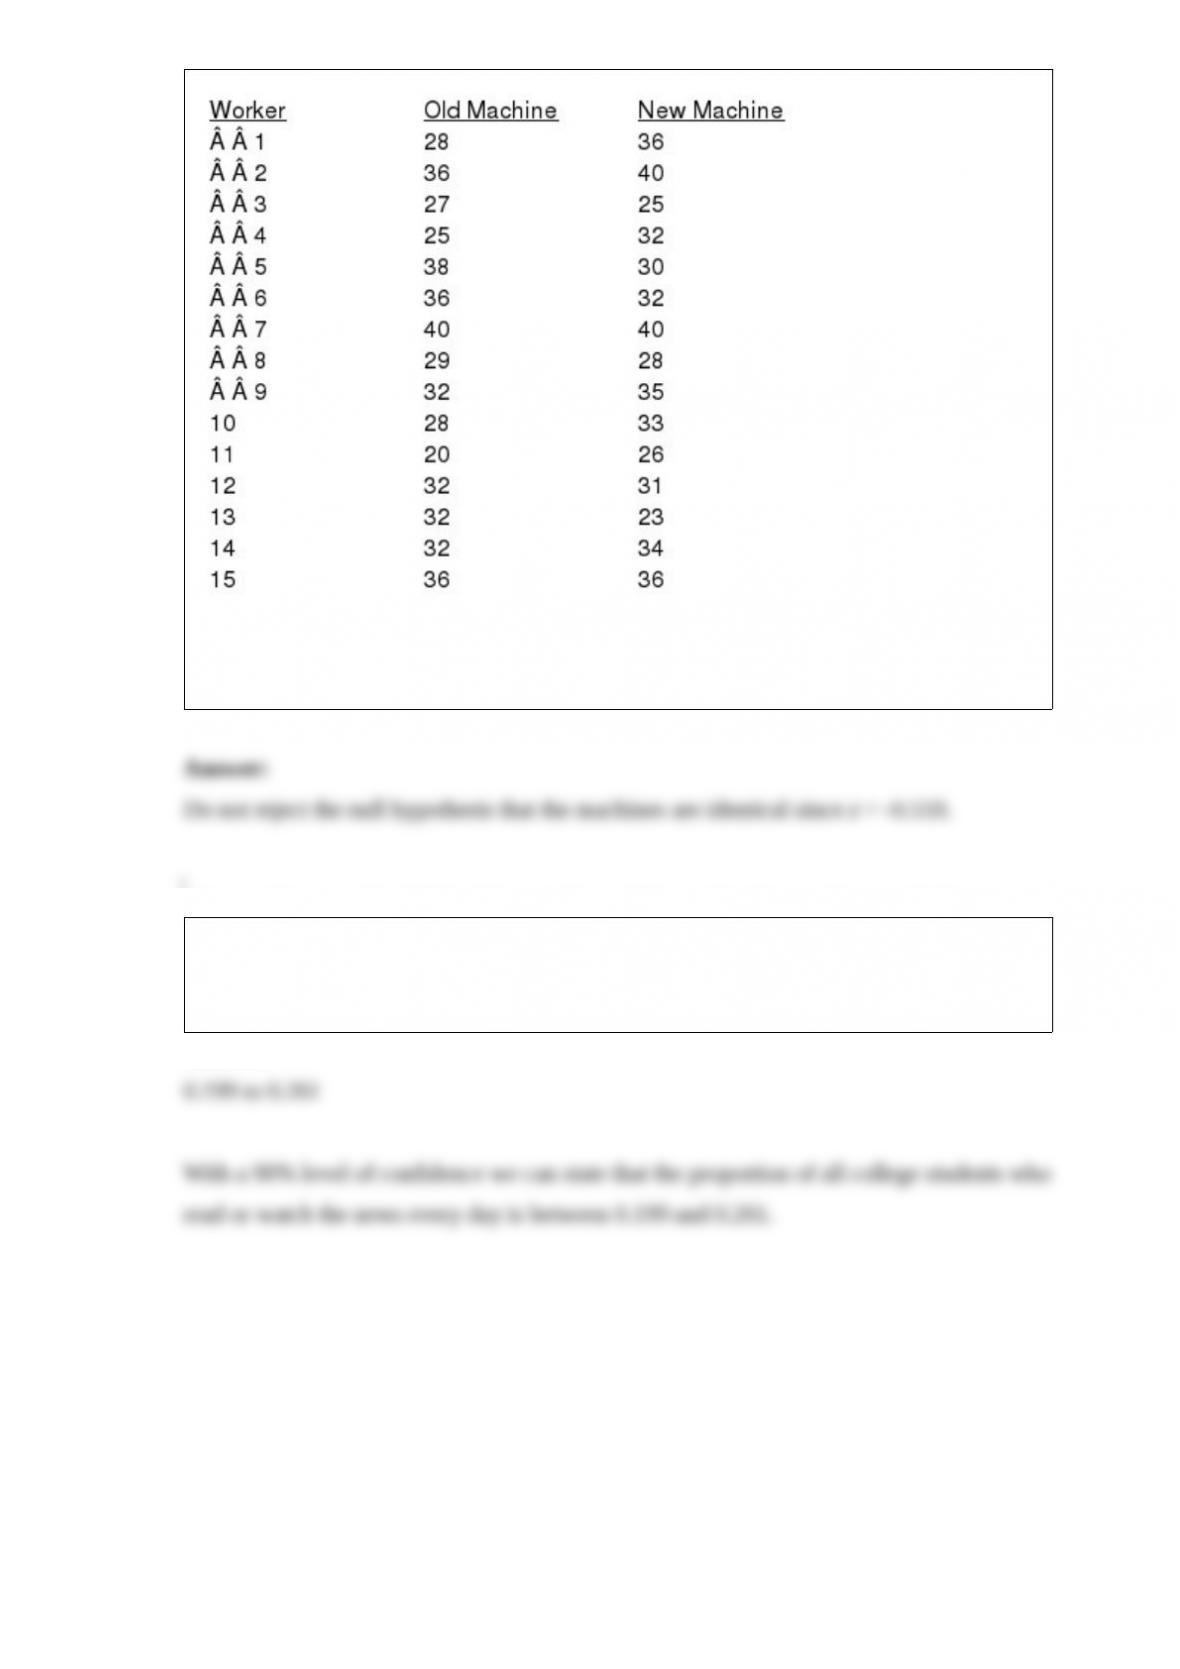
Use the Wilcoxon signed-rank test to determine whether the new machines have
significantly increased production. Use the .05 level of significance.
In a random sample of 500 college students, 23% say that they read or watch the news
every day. Develop a 90% confidence interval for the population proportion. Interpret
your results.