
The adjusted multiple coefficient of determination is adjusted for
a. the number of dependent variables
b. the number of independent variables
c. the number of equations
d. detrimental situations
As the number of degrees of freedom for a t distribution increases, the difference
between the t distribution and the standard normal distribution
a. becomes larger
b. becomes smaller
c. stays the same
d. None of the other answers are correct.
Exhibit 6-7
Refer to Exhibit 6-7. The probability that x is less than 5 is
a. 0.6065
b. 0.0606

c. 0.3935
d. 0.9393
A local bank has determined that the daily balances of the checking accounts of its
customers are normally distributed with an average of $280 and a standard deviation of
$20.
a. What percentage of its customers has daily balances of more than $275?
b. What percentage of its customers has daily balances less than $243?
c. What percentage of its customers’ balances is between $241 and $301.60?
The objective of smoothing methods is to smooth out
a. long range forecasts
b. wide seasonal variations
c. significant trend effects
d. random fluctuations
A box plot is a graphical representation of data that is based on
a. the empirical rule
b. z-scores
c. a histogram
d. a five-number summary
Exhibit 10-6
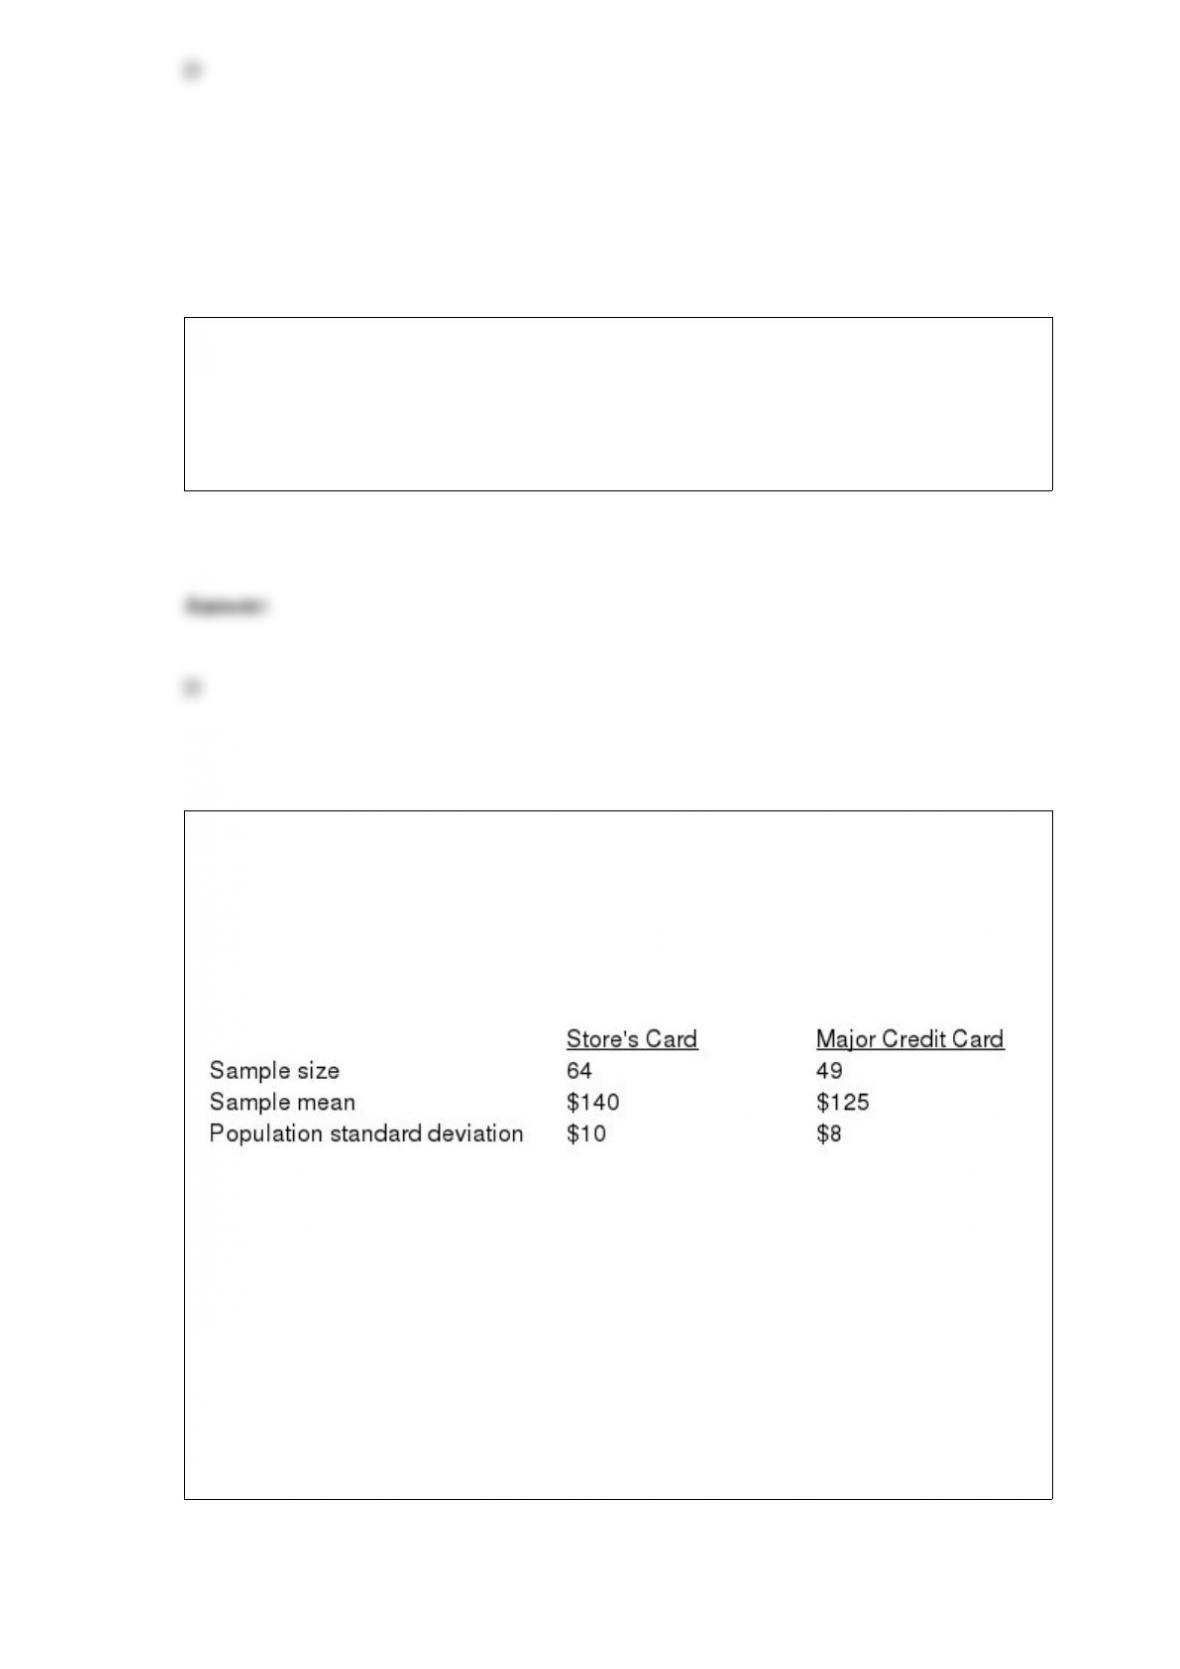
The management of a department store is interested in estimating the difference
between the mean credit purchases of customers using the store’s credit card versus
those customers using a national major credit card. You are given the following
information.
Refer to Exhibit 10-6. A point estimate for the difference between the mean purchases
of the users of the two credit cards is
a. 2
b. 18
c. 265
d. 15

Six vitamin and three sugar tablets identical in appearance are in a box. One tablet is
taken at random and given to Person A. A tablet is then selected and given to Person B.
What is the probability that
a. Person A was given a vitamin tablet?
b. Person B was given a sugar tablet given that Person A was given a vitamin tablet?
c. neither was given vitamin tablets?
d. both were given vitamin tablets?
e. exactly one person was given a vitamin tablet?
f. Person A was given a sugar tablet and Person B was given a vitamin tablet?
g. Person A was given a vitamin tablet and Person B was given a sugar tablet?

A government agency has 6,000 employees. The employees were asked whether they
preferred a four-day work week (10 hours per day), a five-day work week (8 hours per
day), or flexible hours. You are given information on the employees’ responses broken
down by gender.
a. What is the probability that a randomly selected employee is a man and is in favor of
a four-day work week?
b. What is the probability that a randomly selected employee is female?
c. A randomly selected employee turns out to be female. Compute the probability that
she is in favor of flexible hours.
d. What percentage of employees is in favor of a five-day work week?
e. Given that a person is in favor of flexible time, what is the probability that the person
is female?
f. What percentage of employees is male and in favor of a five-day work week?
Two events with nonzero probabilities

a. can be both mutually exclusive and independent
b. cannot be both mutually exclusive and independent
c. are always mutually exclusive
d. cannot be both mutually exclusive and independent and are always mutually
exclusive
Exhibit 8-3
A random sample of 81 automobiles traveling on a section of an interstate showed an
average speed of 60 mph. The distribution of speeds of all cars on this section of
highway is normally distributed, with a standard deviation of 13.5 mph.
Refer to Exhibit 8-3. If the sample size was 25 (other factors remain unchanged), the
interval for
would
a. not change
b. become narrower
c. become wider
d. become zero
An observation that has a strong effect on the regression results is called a (an)
a. residual

b. sum of squares error
c. influential observation
d. None of the other answers is correct.
Since the sun must rise tomorrow, then the probability of the sun rising tomorrow is
a. much larger than one
b. zero
c. infinity
d. None of the other answers is correct.
An estimate of a population parameter that provides an interval believed to contain the
value of the parameter is known as the
a. confidence level
b. interval estimate
c. parameter value
d. population estimate

The time it takes a mechanic to change the oil in a car is exponentially distributed with
a mean of 5 minutes.
a. What is the probability density function for the time it takes to change the oil?
b. What is the probability that it will take a mechanic less than 6 minutes to change the
oil?
c. What is the probability that it will take a mechanic between 3 and 5 minutes to
change the oil?
Exhibit 1-1
In a recent study based upon an inspection of 200 homes in Daisy City, 120 were found
to violate one or more city codes.
Refer to Exhibit 1-1. The Daisy City study described above is an example of the use of
a
a. census
b. sample
c. probability
d. population

Exhibit 13-7
The following is part of an ANOVA table, which was the results of three treatments and
a total of 15 observations.
Refer to Exhibit 13-7. If at a 5% level of significance, we want to determine whether or
not the means of the populations are equal, the critical value of F is
a. 4.75
b. 19.41
c. 3.16
d. 1.96
The range of probability is
a. any value larger than zero
b. any value between minus infinity to plus infinity
c. zero to one
d. any value between -1 to 1
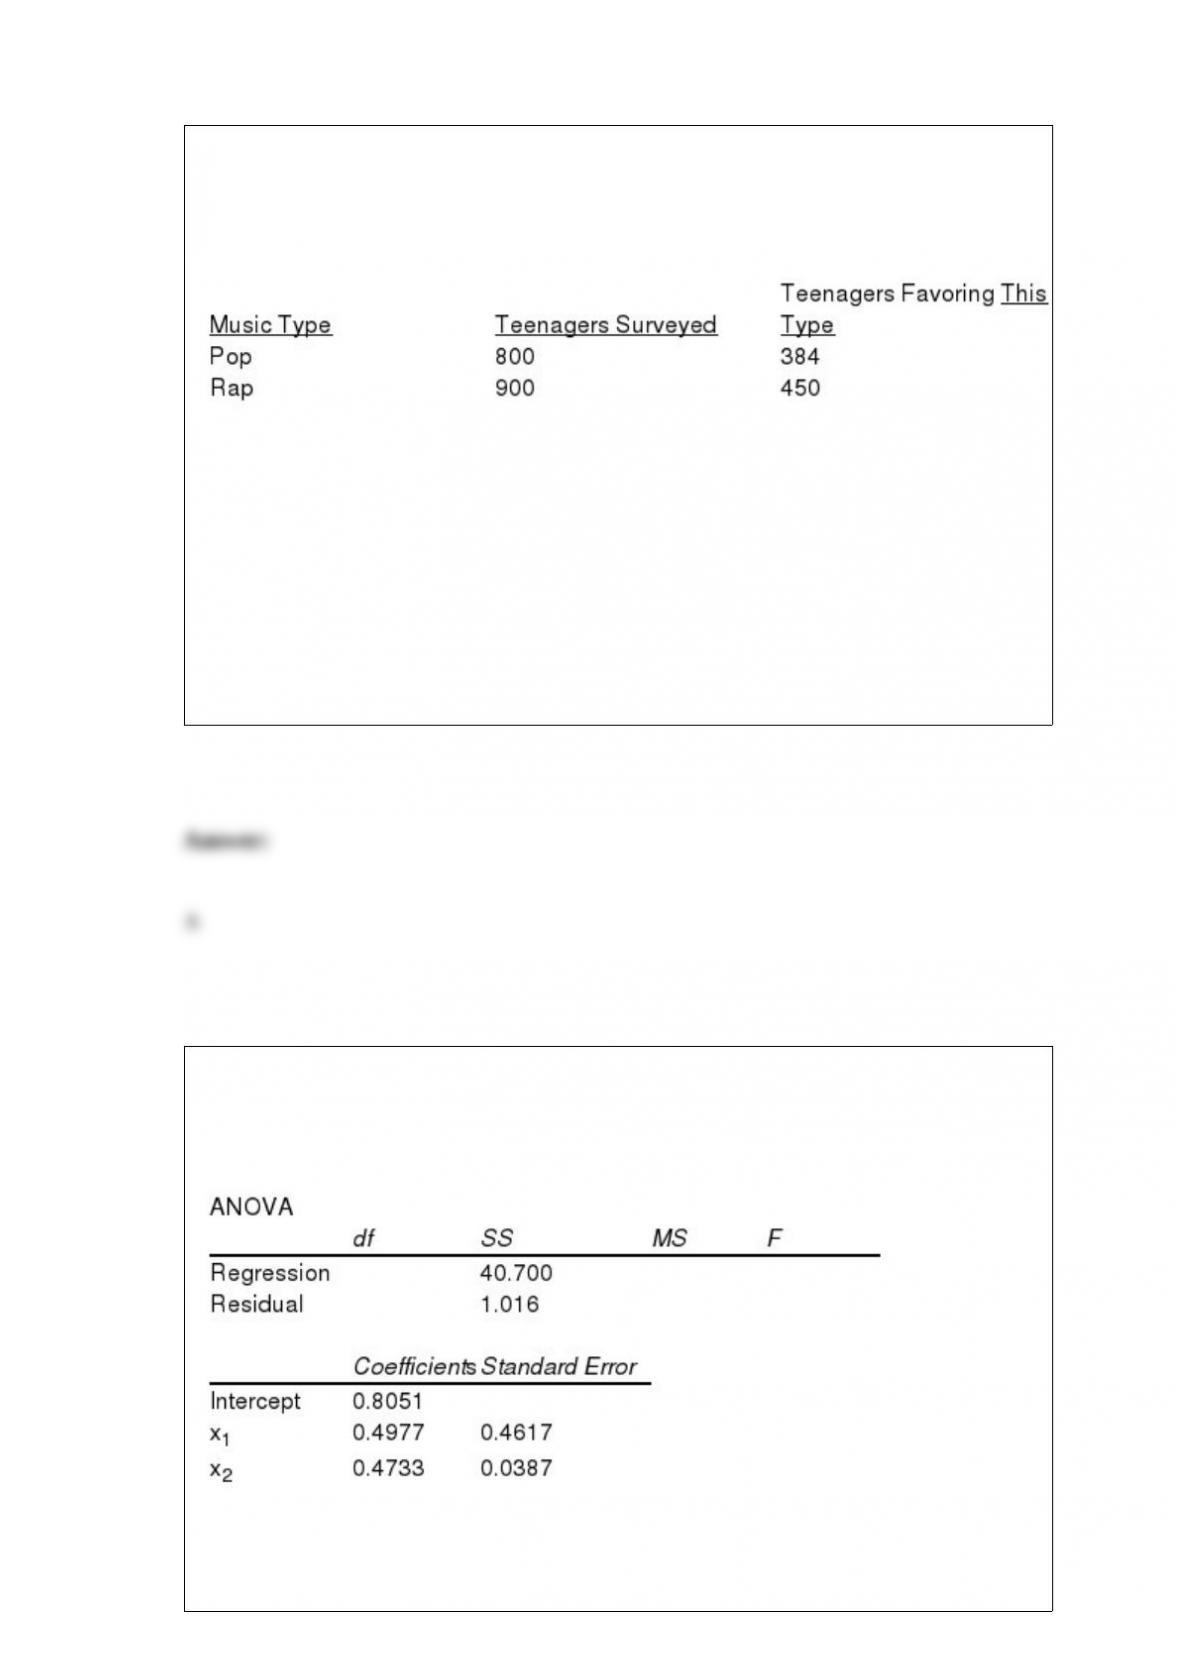
Exhibit 10-12
The results of a recent poll on the preference of teenagers regarding the types of music
they listen to are shown below.
Refer to Exhibit 10-12. The point estimate for the difference between the proportions is
a. -0.02
b. 0.048
c. 100
d. 66
In order to determine whether or not the number of automobiles sold per day (y) is
related to price (x1 in $1,000), and the number of advertising spots (x2), data were
gathered for 7 days. Part of the Excel output is shown below.
a. Determine the least squares regression function relating y to x1 and x2.
b. If the company charges $20,000 for each car and uses 10 advertising spots, how
many cars would you expect them to sell in a day?
c. At = 0.05, test to determine if the fitted equation developed in Part a represents a
significant relationship between the independent variables and the dependent variable.
d. At = 0.05, test to see if 1 is significantly different from zero.
e. Determine the multiple coefficient of determination.
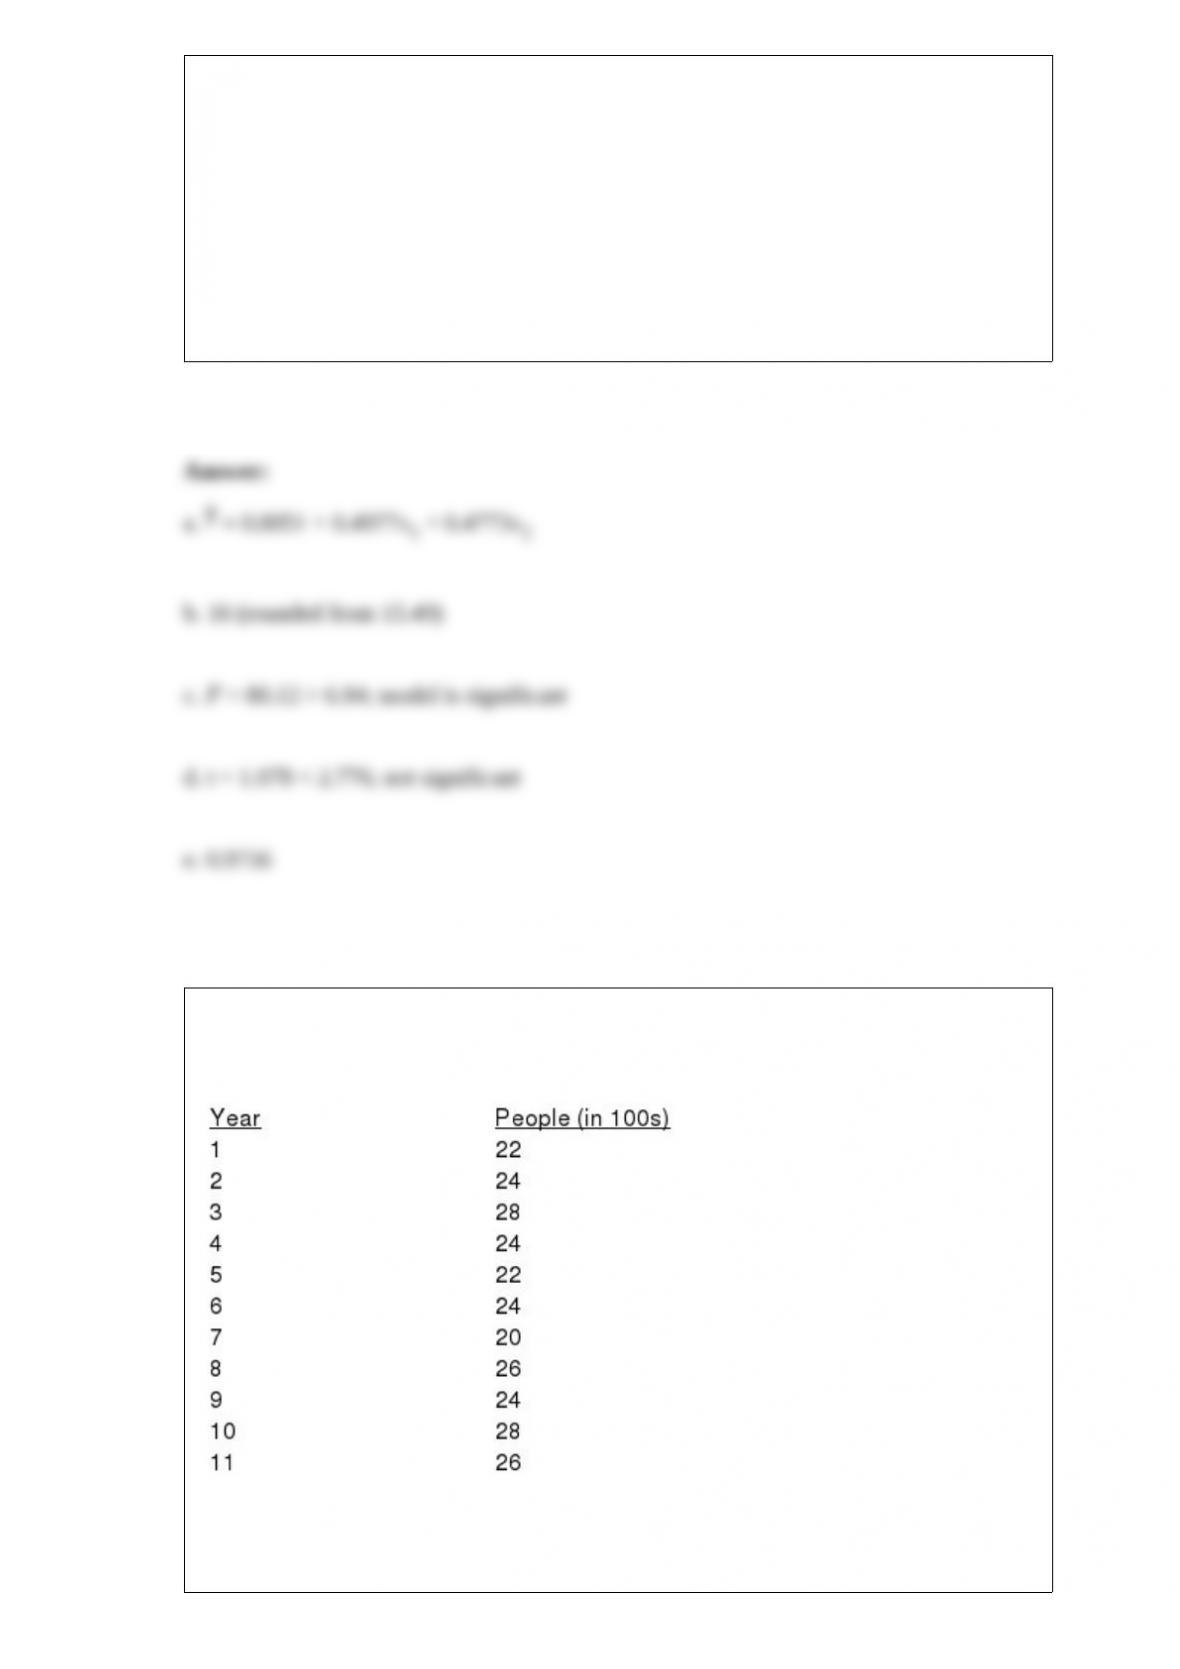
Consider the following annual series on the number of people assisted by a county
human resources department.
a. Prepare 3-year moving average values to be used as forecasts for periods 4 through
11. Calculate the mean squared error (MSE) measure of forecast accuracy for periods 4

through 11.
b. Use a smoothing constant of .4 to compute exponential smoothing values to be used
as forecasts for periods 2 through 11. Calculate the MSE.
c. Compare the results in Parts a and b.
The township of Middleton sets the speed limit on its roads by conducting a traffic
study and determining the speed (to the nearest 5 miles per hour) at which 80% of the
drivers travel at or below. A study was done on Brown’s Dock Road that indicated
driver’s speeds follow a normal distribution with a mean of 36.25 miles per hour and a
variance of 6.25.
a. What should the speed limit be?
b. What percent of the drivers travel below that speed?
The trend pattern is easy to identify by using
a. moving averages

b. exponential smoothing
c. regression analysis
d. the Delphi approach