The probability of the states of nature, after use of Bayes’ theorem to adjust the prior
probabilities based upon given indicator information, is called
a. marginal probability
b. conditional probability
c. posterior probability
d. None of the answers are correct.
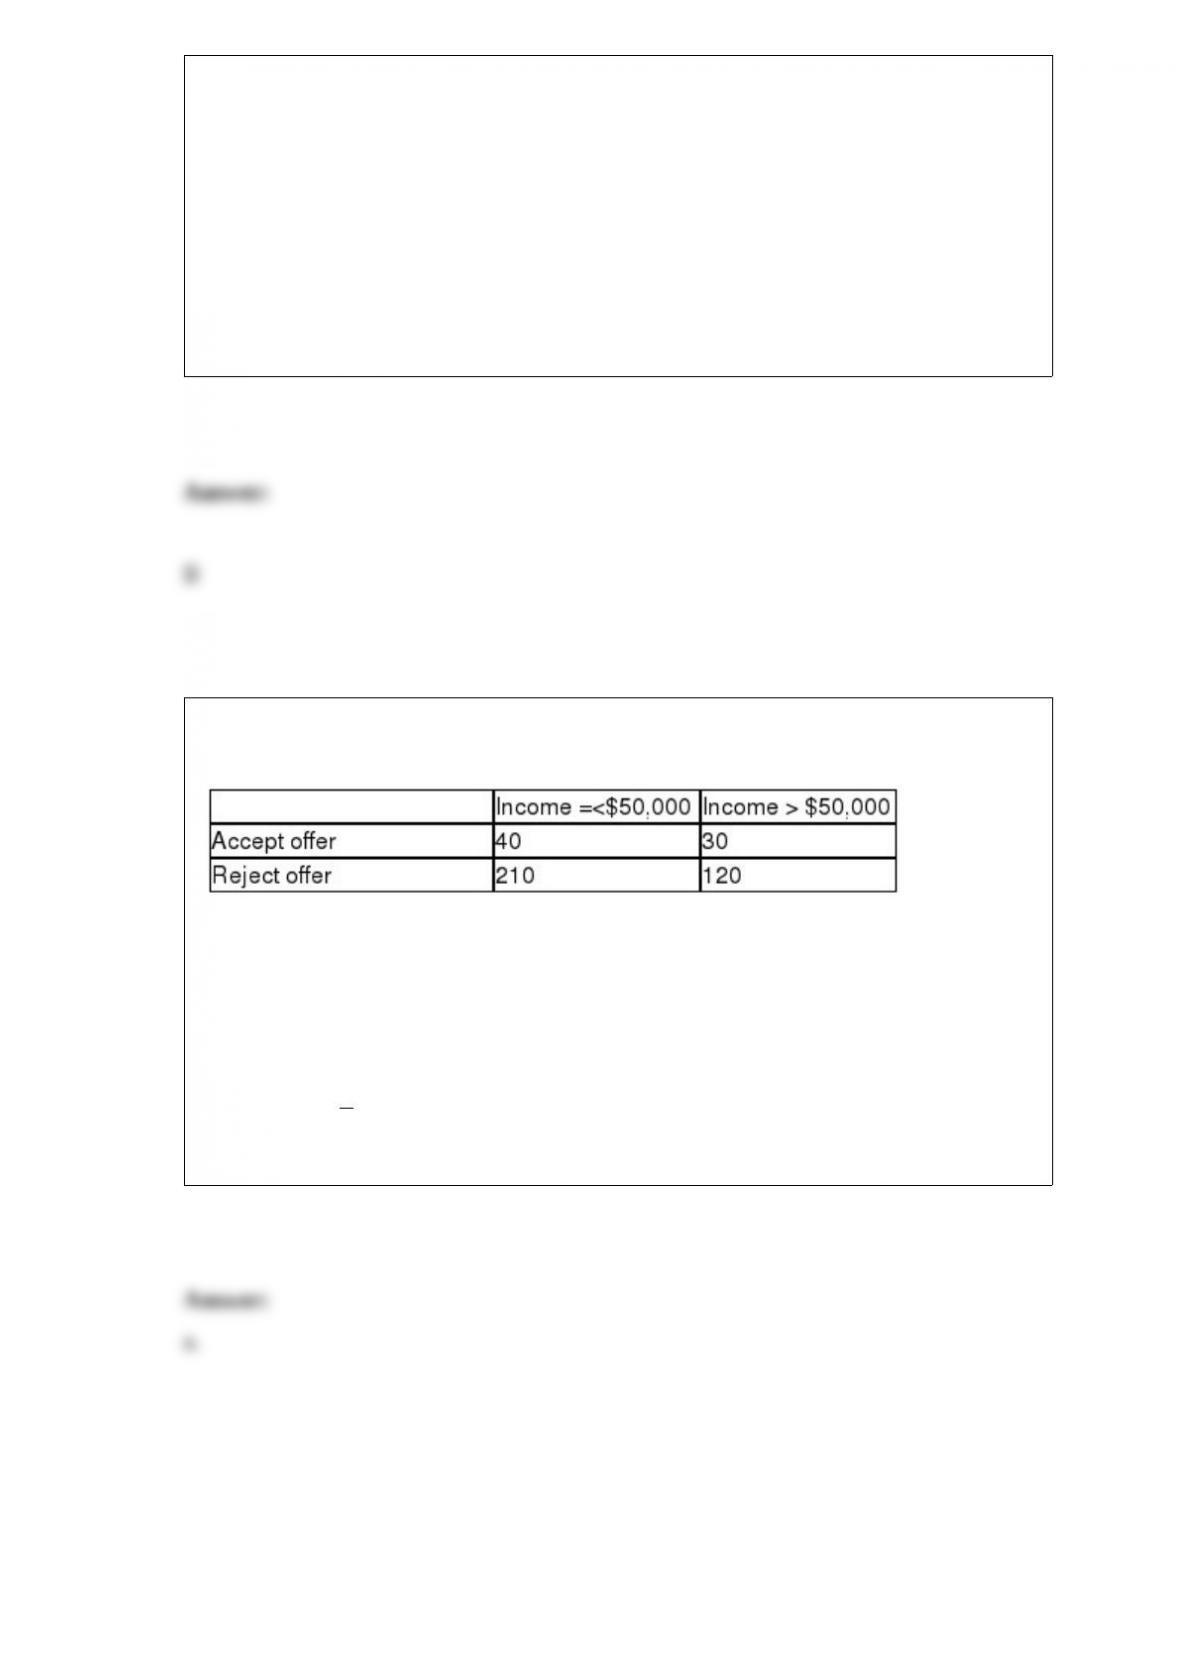
Through a telephone survey, a low-interest bank credit card is offered to 400
households. The responses are as follows.
a. Develop a joint probability table and show the marginal probabilities..
b. What is the probability of a household whose income exceeds $50,000 and who
rejects the offer?
c. If income is < $50,000, what is the probability the offer will be accepted?
d. If the offer is accepted, what is the probability that income exceeds $50,000?

A sample of five Fortune 500 companies showed the following revenues ($ millions):
7505.0, 2904.7, 7208.4, 6819.0, and 19500.0. Based on this information, which of the
following statements is correct?
a. An estimate of the average revenue for all Fortune 500 companies is 8787.42
($ millions).
b. The average revenue for all Fortune 500 companies is 8787.42 ($ millions).
c. Over half of all Fortune 500 companies earn at least 7208.4 ($ millions) in revenues.
d. If five other Fortune 500 companies were chosen, the average revenue would be
8787.42 ($ millions).
A sample of 11 individuals shows the following monthly incomes.
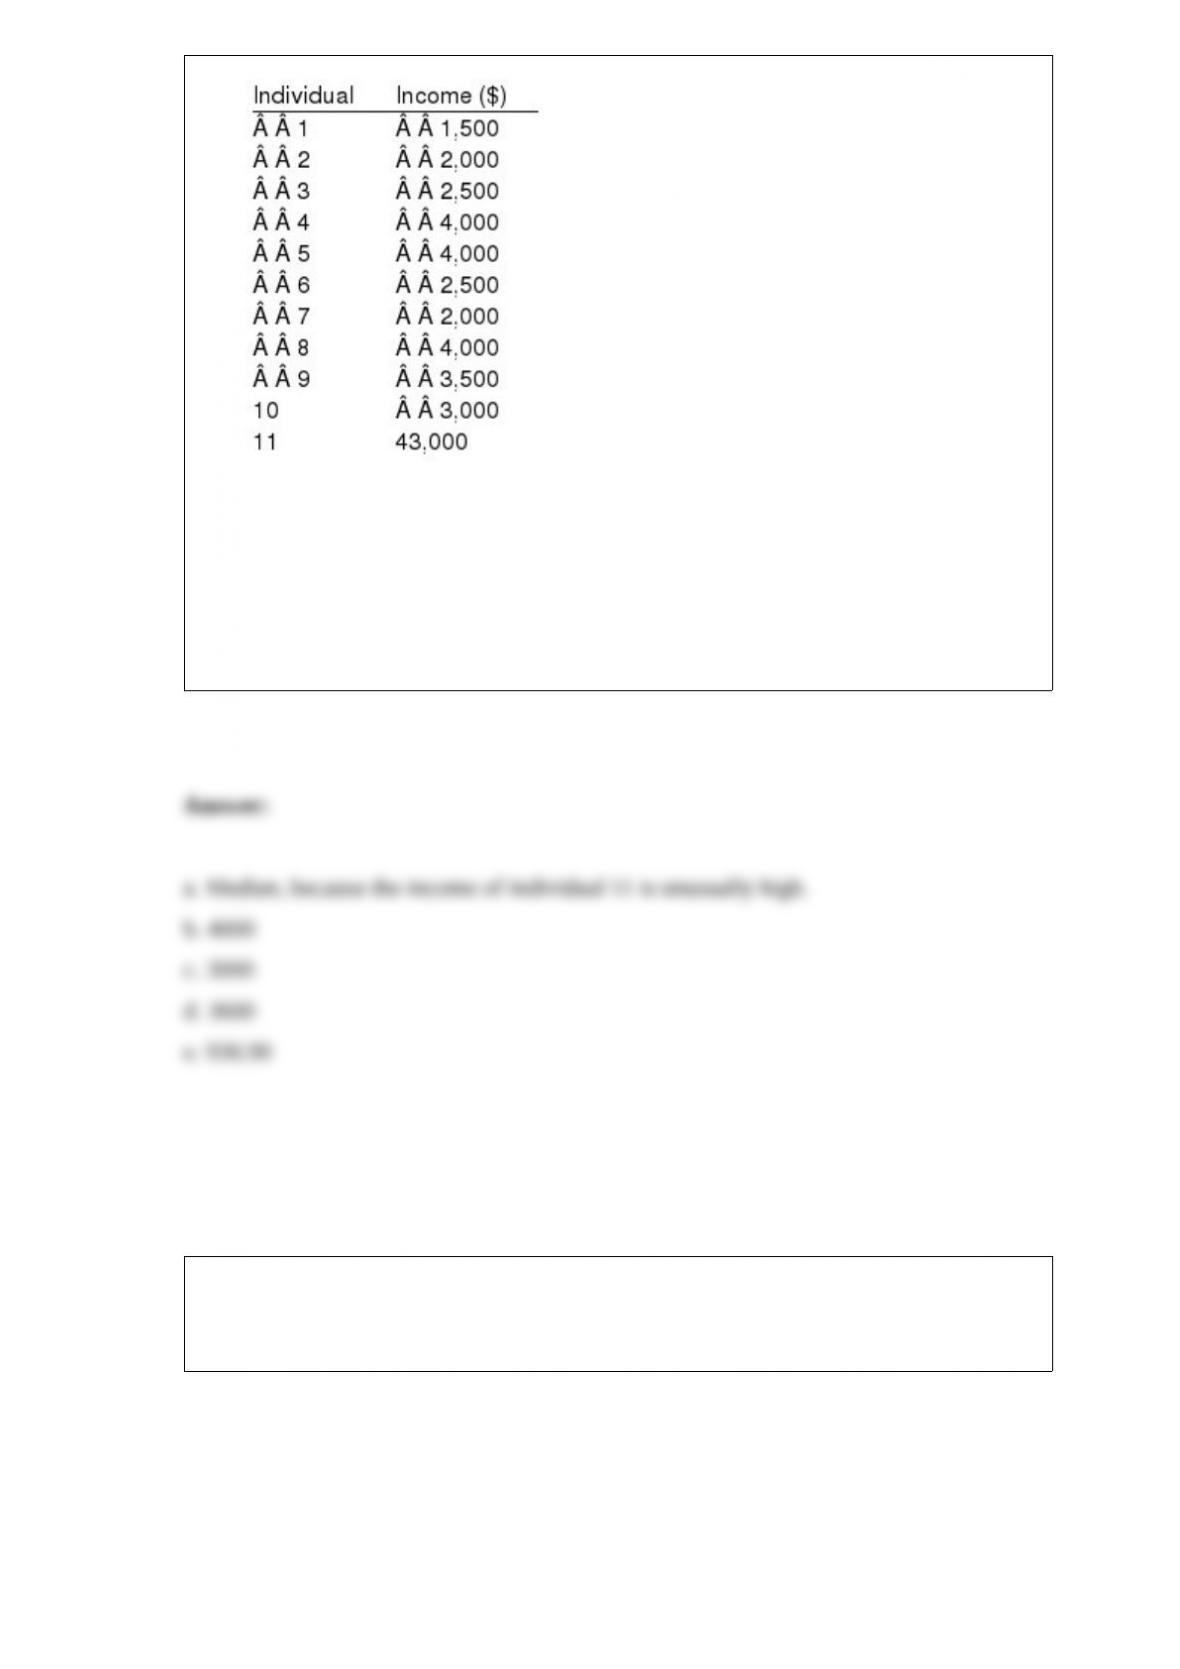
a. What would be a representative measure of central location for the above data?
Explain.
b. Determine the mode.
c. Determine the median.
d. Determine the 60th percentile.
e. Drop the income of individual number 11 and compute the standard deviation for the
first 10 individuals.
Exhibit 15-6
Below you are given a partial Excel output based on a sample of 16 observations.
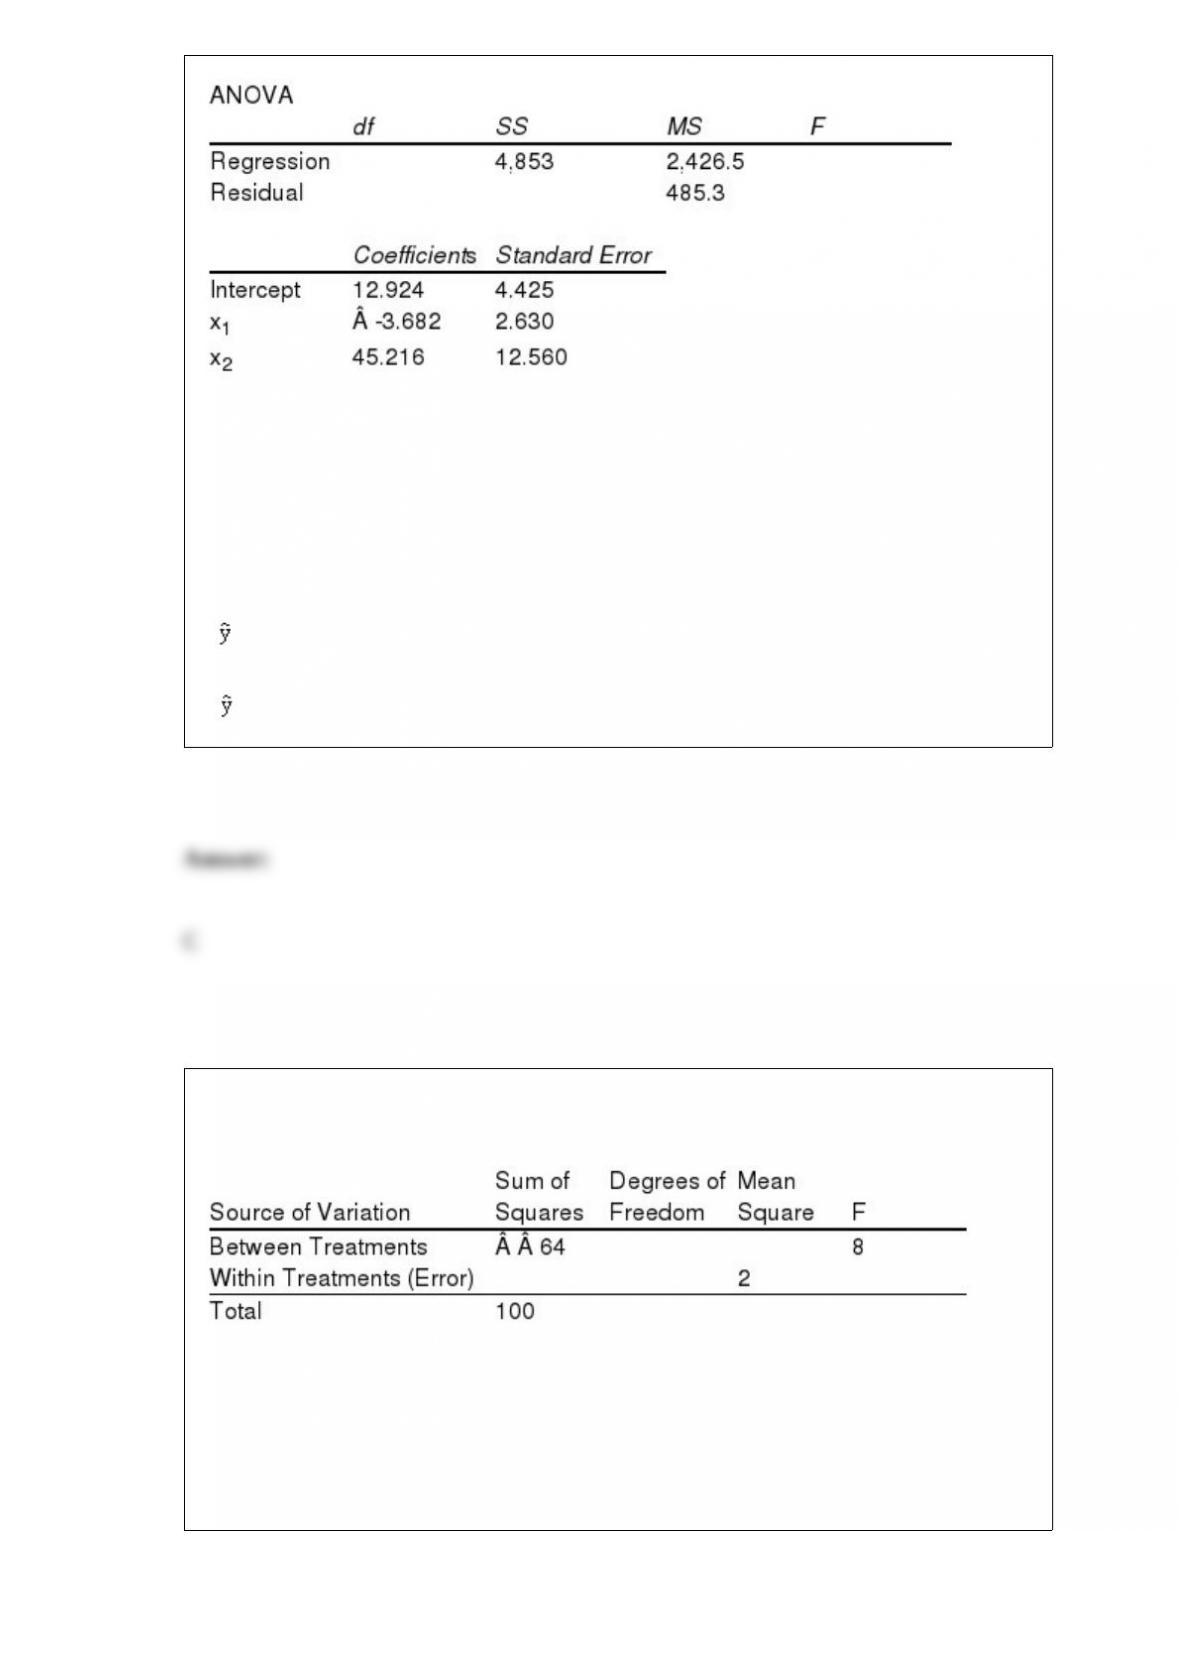
Refer to Exhibit 15-6. The estimated regression equation is
a. y = 0 + 1x1 + 2x2 +
b. E(y) = 0 + 1x1 + 2x2
c. = 12.924 – 3.682 x1 + 45.216 x2
d. = 4.425 + 2.63 x1 + 12.56 x2
Exhibit 13-6
Part of an ANOVA table is shown below.
Refer to Exhibit 13-6. The number of degrees of freedom corresponding to within
treatments is
a. 22
b. 4
c. 5
d. 18

The random variable x has the following probability distribution:
a. Is this probability distribution valid? Explain and list the requirements for a valid
probability distribution.
b. Calculate the expected value of x.
c. Calculate the variance of x.
d. Calculate the standard deviation of x.
The manager of an automobile dealership is considering a new bonus plan in order to
increase sales. Currently, the mean sales rate per salesperson is five automobiles per
month. The correct set of hypotheses for testing the effect of the bonus plan is
a. H0:
5 Ha:
5

b. H0:
5 Ha:
5
c. H0:
5 Ha:
5
d. H0:
5 Ha:
5
A method of selecting a sample by randomly selecting the first element and then
selecting every kth element thereafter is
a. area sampling
b. stratified sampling
c. systematic sampling
d. stratified simple random sampling
For a multiple regression model, SST = 200 and SSE = 50. The multiple coefficient of
determination is
a. 0.25
b. 4.00
c. 250
d. 0.75

Read the z statistic from the normal distribution table and circle the correct answer. A
one-tailed test (upper tail) at a .123 level of significance; z
a. 1.54
b. 1.96
c. 1.645
d. 1.16
Identify the null and alternative hypotheses for the following problems.
a. The manager of a restaurant believes that it takes a customer no more than 25
minutes to eat lunch.
b. Economists have stated that the marginal propensity to consume is at least 90¢ out
of every dollar.
c. It has been stated that 75 out of every 100 people who go to the movies on Saturday
night buy popcorn.

Excel’s __________ can be used to construct a frequency distribution for quantitative
data.
a. COUNTIF function
b. SUM function
c. PivotTable Report
d. AVERAGE function
Not sampling from the intended target population is an example of
a. stratified sampling
b. sampling error
c. cluster sampling
d. nonsampling error

In a regression analysis if r2 1, then
a. SSE must also be equal to one
b. SSE must be equal to zero
c. SSE can be any positive value
d. SSE must be negative
The variance of the sample
a. can never be negative
b. can be negative
c. cannot be zero
d. cannot be less than one
The probability of one event given the known outcome of a (possibly) related event is
known as
a. unconditional probability
b. joint probability
c. marginal probability
d. conditional probability

In a binomial experiment the probability of success is 0.06. What is the probability of
two successes in seven trials?
a. 0.0036
b. 0.06
c. 0.0554
d. 0.28
Future events which cannot be controlled by the decision maker are called
a. indicators
b. states of nature
c. prior probabilities
d. posterior probabilities
The approach to determine the optimal decision strategy involves

a. a forward (left to right) pass through the decision tree
b. a backward (right to left) pass through the decision tree
c. choosing the outcome of a chance event with the greatest probability
d. choosing the outcome of a chance event with the greatest payoff
Exhibit 17-1
Below you are given the first five values of a quarterly time series. The multiplicative
model is appropriate and a four-quarter moving average will be used.
Refer to Exhibit 17-1. An estimate of the trend component times the cyclical component
(T2Ct) for Quarter 3 of Year 1, when a four-quarter moving average is used, is
a. 24
b. 25
c. 26
d. 28

Exhibit 13-2
Refer to Exhibit 13-2. The test statistic to test the null hypothesis equals
a. 0.432
b. 1.8
c. 4.17
d. 28.8
__________ can be used to determine the percentage of data values that must be within
one, two, and three standard deviations of the mean for data having a bell-shaped
distribution.
a. Chebyshev’s theorem
b. empirical rule
c. five-number summary
d. box plot
Exhibit 2-3
The number of sick days taken (per month) by 200 factory workers is summarized
below.

Refer to Exhibit 2-3. The class width for this distribution
a. is 5
b. is 6
c. is 20, which is: the largest value minus the smallest value or 20 0 20
d. varies from class to class
Exhibit 3-1
A researcher has collected the following sample data.
Refer to Exhibit 3-1. The 75th percentile is
a. 6
b. 7
c. 8
d. 9
In a regression analysis involving 20 observations and five independent variables, the
following information was obtained.
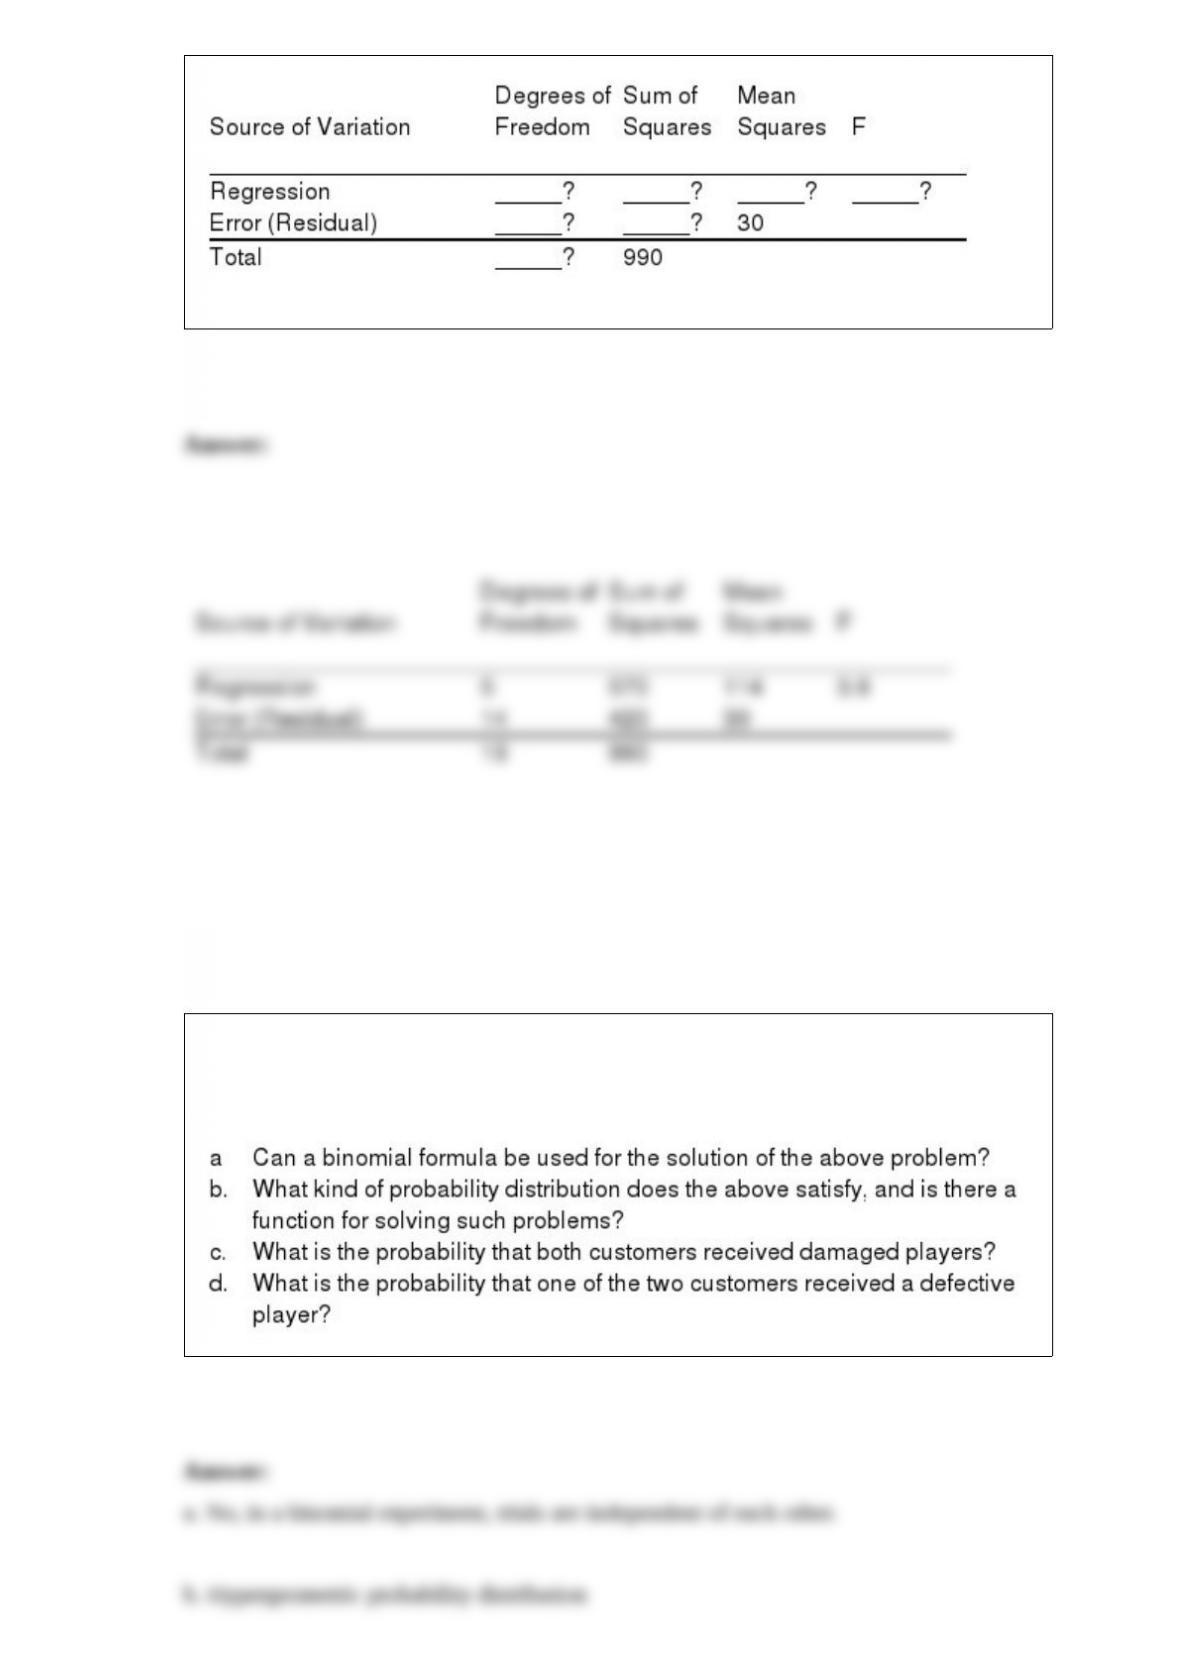
Fill in all the blanks in the above ANOVA table.
A retailer of electronic equipment received six Blu-ray players from the manufacturer.
Three of the players were damaged in the shipment. The retailer sold two players to two
customers.

Exhibit 17-4
The Espresso Cart has had the following pattern of espresso sales over the last two
weeks:
Refer to Exhibit 17-4. What is the forecast for Friday’s sales using a three-day moving
average?
876.33
888.33
892.33
893.33
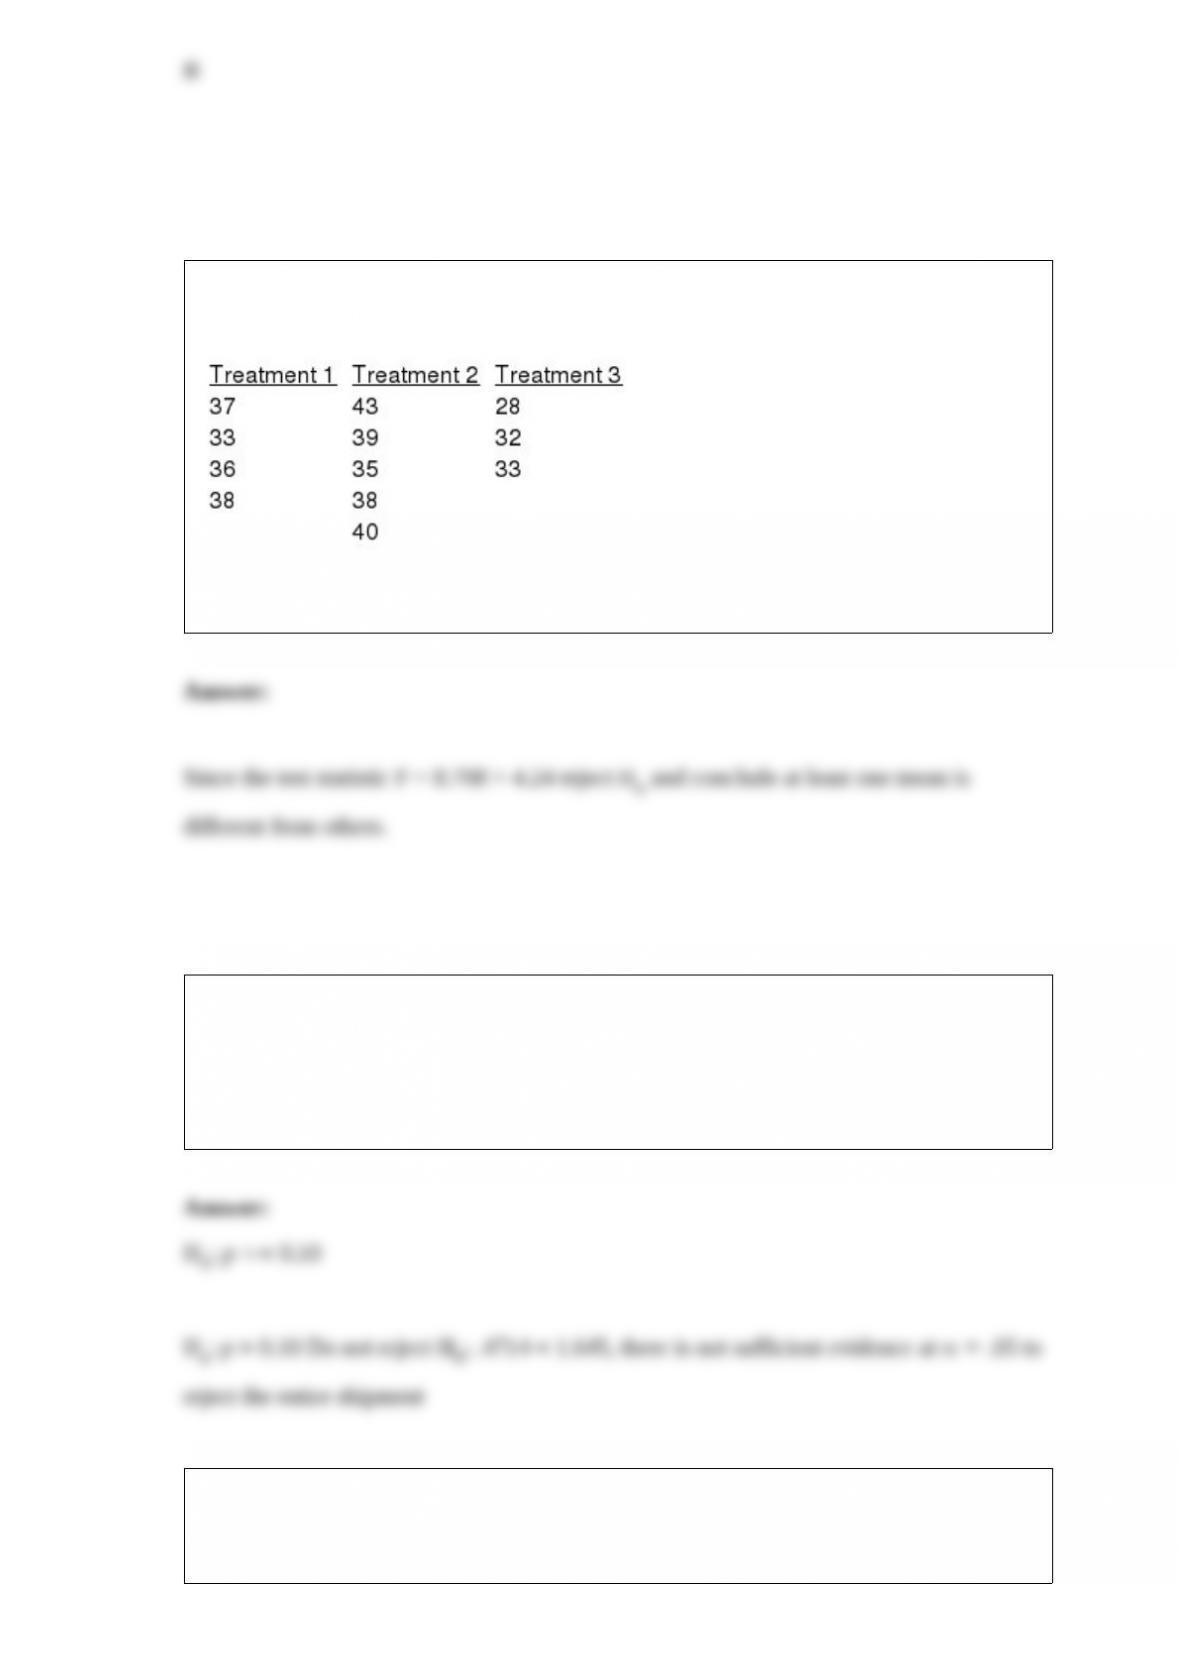
Random samples were selected from three populations. The data obtained are shown
below.
At a 5% level of significance, test to see if there is a significant difference in the means
of the three populations. (Please note that the sample sizes are not equal.)
For each shipment of parts a manufacturer wants to accept only those shipments with at
most 10% defective parts. A large shipment has just arrived. A quality control manager
randomly selects 50 of the parts from the shipment and finds that 6 parts are defective.
Is this sufficient evidence to reject the entire shipment? Use a .05 level of significance
to conduct the appropriate hypothesis test.
A marketing firm is developing a new television advertisement for a large discount
retail chain. A sample of 30 people is shown two potential ads and asked their
preference. The results for ad #1 follow. Use Excel to develop a 95% confidence
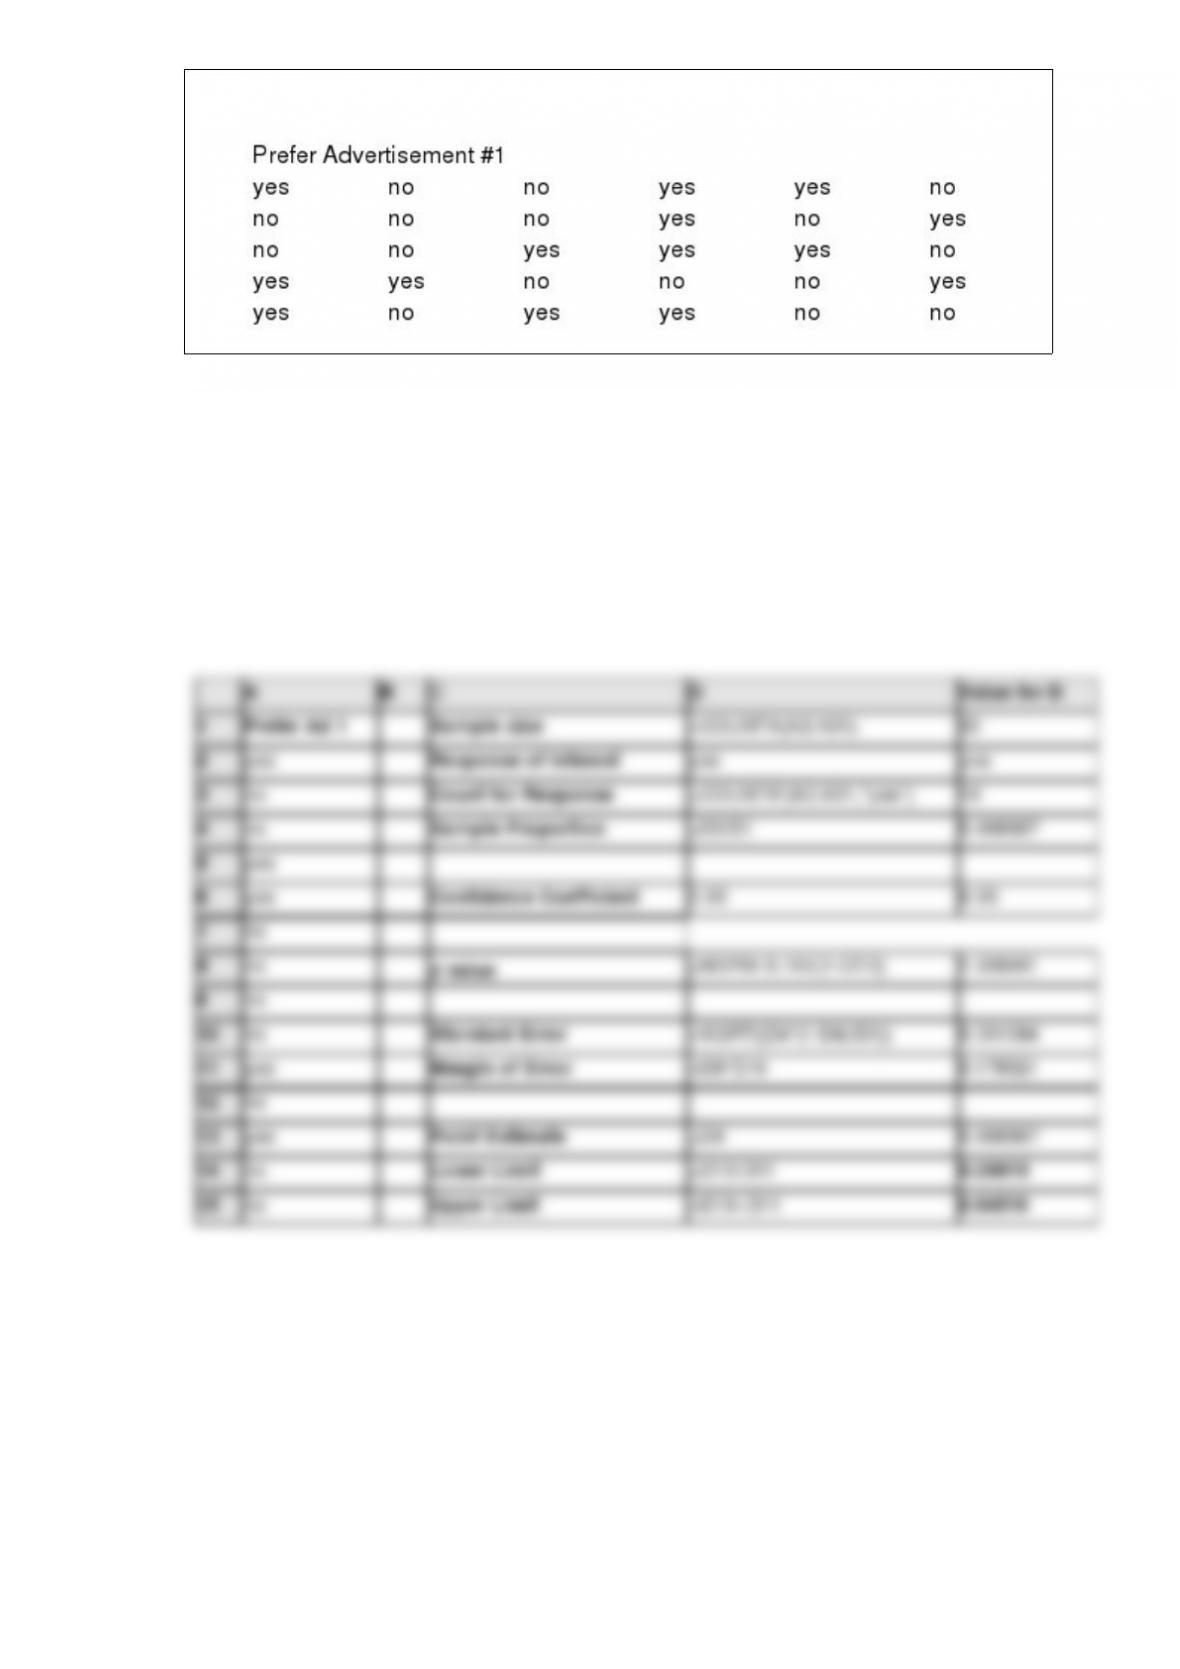
interval estimate of the proportion of people in the population who will prefer ad #1.