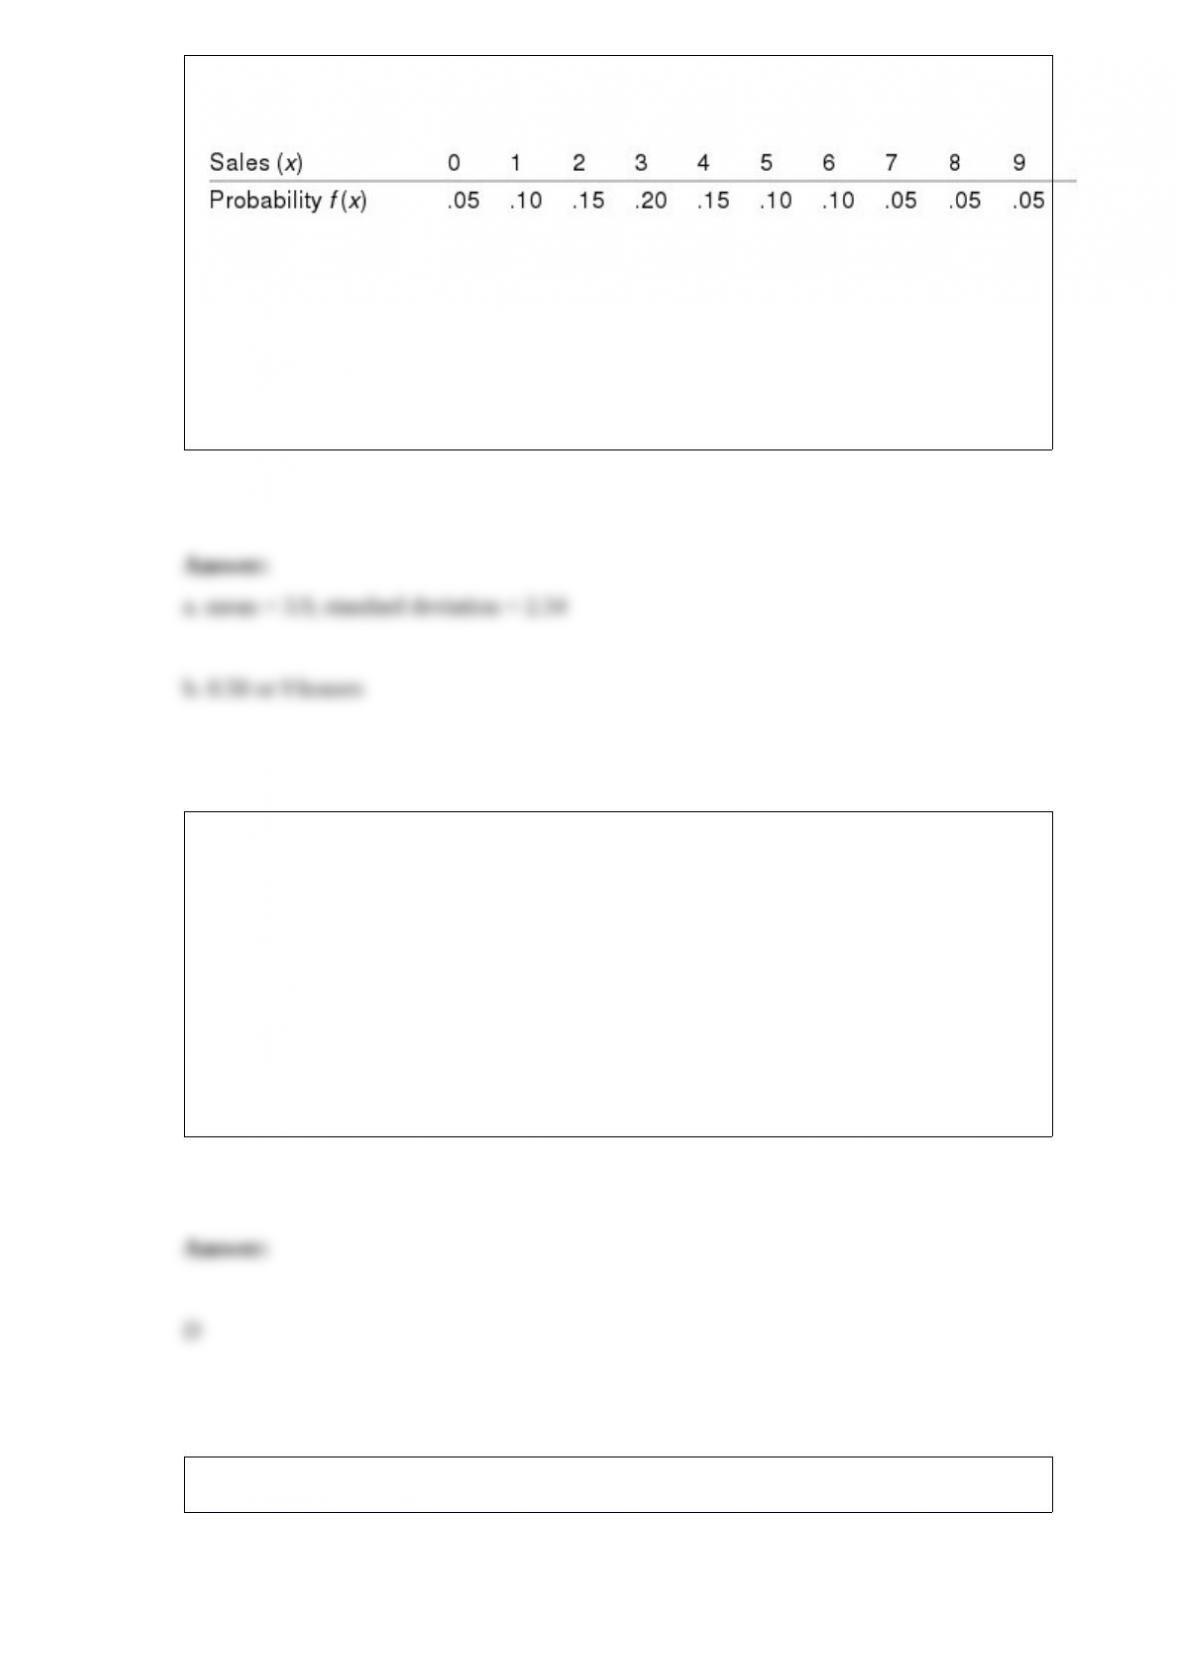
The salespeople at Gold Key Realty sell up to 9 houses per month. The probability
distribution of a salesperson selling x houses in a month is as follows:
a. What are the mean and standard deviation for the number of houses sold by a
salesperson per month?
b. Any salesperson selling more houses than the amount equal to the mean plus two
standard deviations receives a bonus. How many houses per month must a salesperson
sell to receive a bonus?
To compute the minimum sample size for an interval estimate of
, we must first
determine all of the following except
a. desired margin of error
b. confidence level
c. population standard deviation
d. degrees of freedom
R Exhibit 9-5

Assume population is normally distributed.
efer to Exhibit 9-5. If the test is done at a 2% level of significance, the null hypothesis
should
a. not be rejected
b. be rejected
c. Not enough information is given to answer this question.
d. None of the other answers are correct.
Exhibit 6-2
The travel time for a college student traveling between her home and her college is
uniformly distributed between 40 and 90 minutes.
Refer to Exhibit 6-2. The probability that her trip will take longer than 60 minutes is
a. 1.00
b. 0.40
c. 0.02
d. 0.600

In an application for a credit card, potential customers are asked for their social security
numbers. A social security number is an example of a
a. categorical variable
b. quantitative variable
c. categorical or quantitative variable, depending on how the respondents answered the
question
d. ratio variable
A graphical method that can be used to show both the rank order and shape of a data set
simultaneously is a
a. relative frequency distribution
b. pie chart
c. stem-and-leaf display
d. pivot table
Which of the following symbols represents the mean of the population?
a. 2
b.
c.
d.

The multiplication law is potentially helpful when we are interested in computing the
probability of
a. mutually exclusive events
b. the intersection of two events
c. the union of two events
d. None of the other answers is correct.
In order to test for the significance of a regression model involving 14 independent
variables and 255 observations, the numerator and denominator degrees of freedom
(respectively) for the critical value of F are
a. 14 and 255
b. 255 and 14
c. 13 and 240
d. 14 and 240
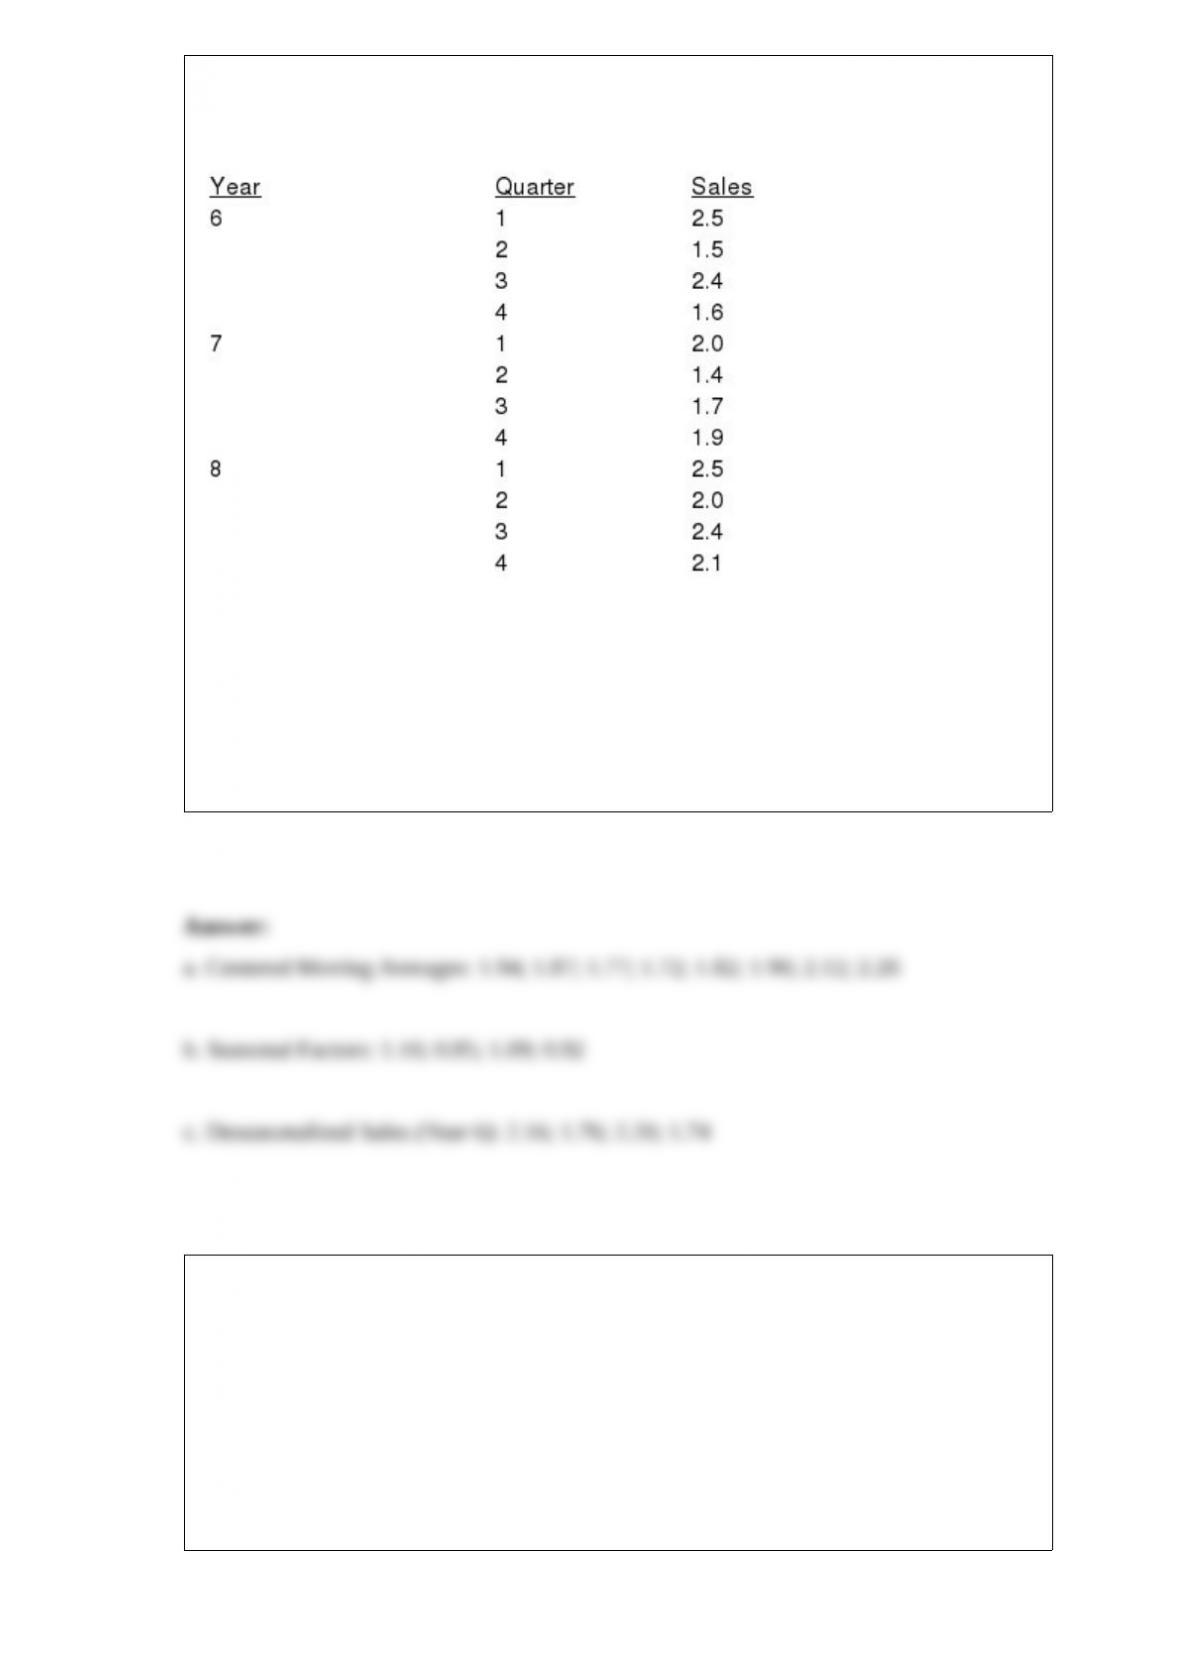
The following data show the quarterly sales of Amazing Graphics, Inc. for the years 6
through 8.
a. Compute the four-quarter moving average values for the above time series.
b. Compute the seasonal factors for the four quarters.
c. Use the seasonal factors developed in Part b to adjust the forecast for the effect of
season for year 6.
The symbol ‡ shows the
a. union of events
b. intersection of events
c. sum of the probabilities of events
d. None of the other answers is correct.

Selecting a subset of clusters and then selecting a sample of elements in each of those
clusters is referred to as
a. stratified cluster sampling
b. convenient cluster sampling
c. single-stage cluster sampling
d. two-stage cluster sampling
In hypothesis testing, the critical value is
a. a number that establishes the boundary of the rejection region
b. the probability of a Type I error
c. the probability of a Type II error
d. the same as the p-value
When using Excel’s HYPGEOM.DIST function, one should choose TRUE for the
fourth input if
a. a probability is desired
b. a cumulative probability is desired
c. the expected value is desired
d. None of the alternative answers is correct.
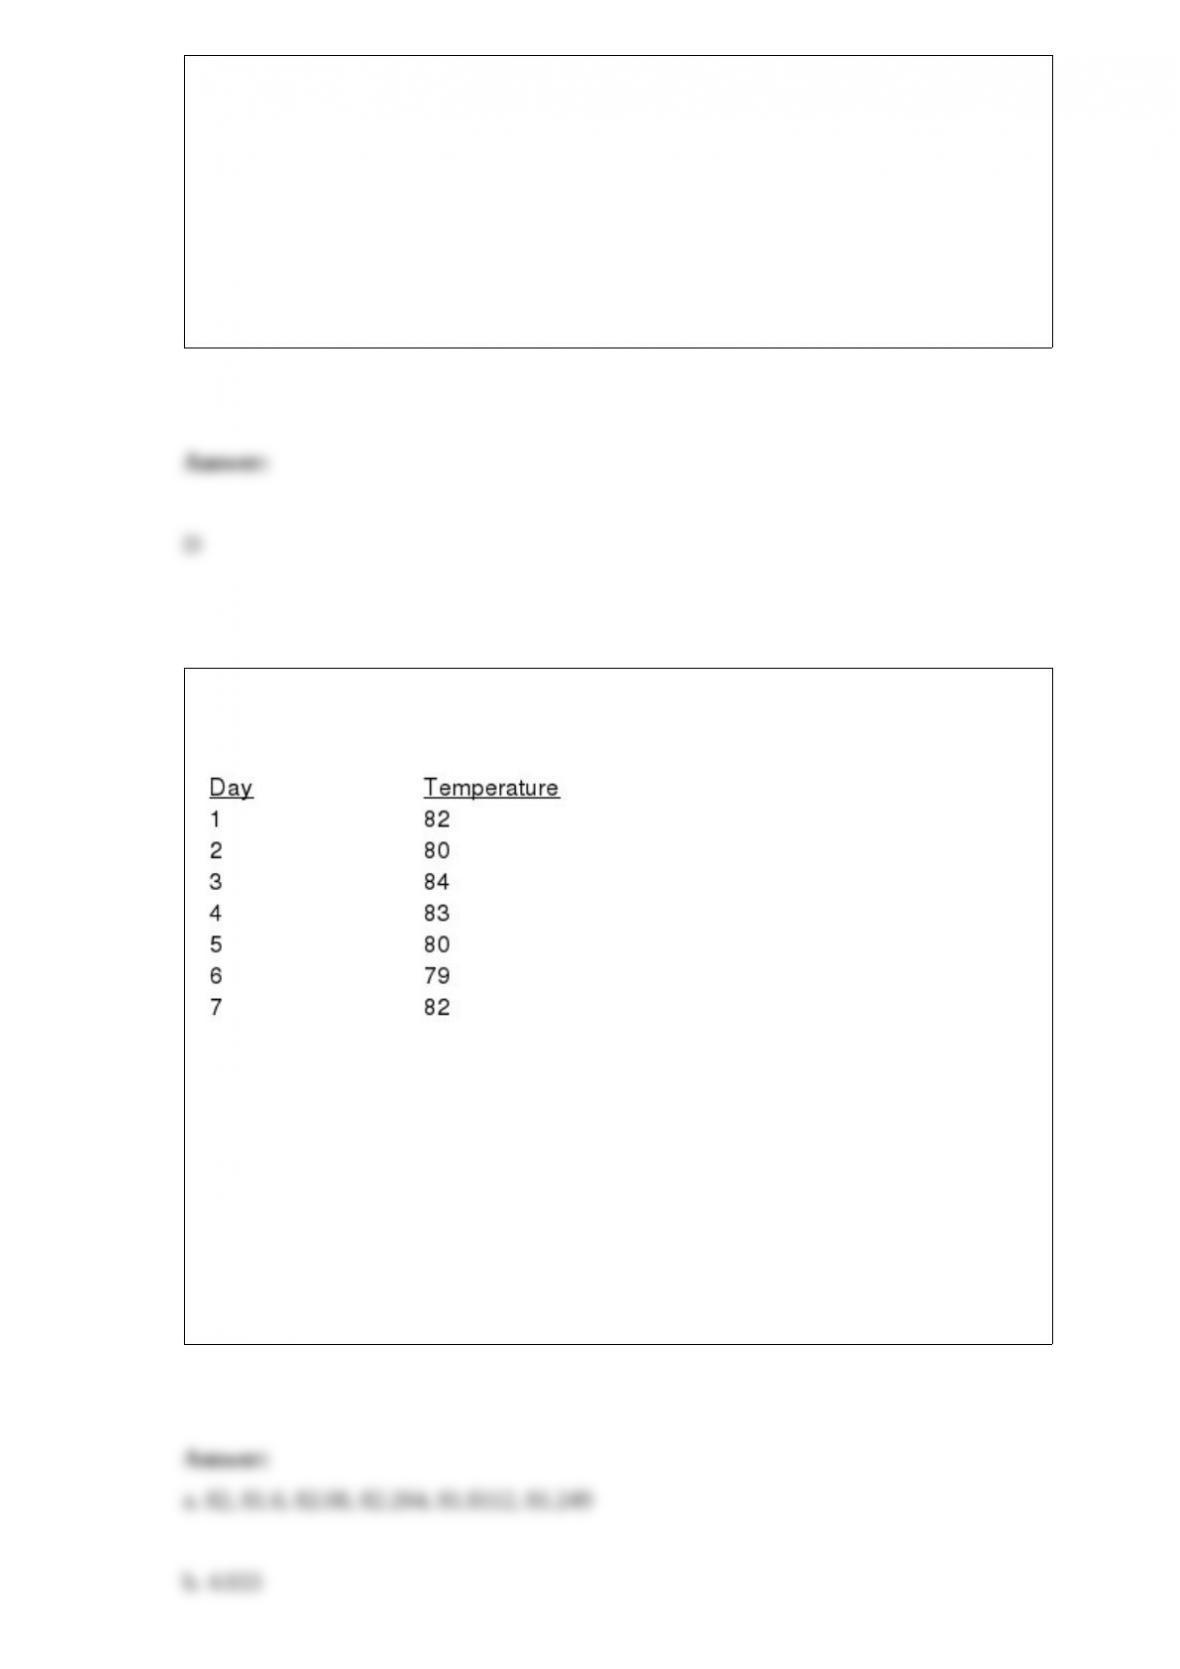
The temperature in Chicago has been recorded for the past seven days. You are given
the information below.
a. Produce exponential smoothing forecasts for the series using a smoothing constant of
.2.
b. Compute the mean square error for the forecasts produced with a smoothing constant
of .2.
c. What is the forecasted temperature for day 8?
d. Is a smoothing constant of .2 or .3 better for the temperature data? Explain.

In a sample survey, it is common practice to use a t value of (when approximating a
95% confidence interval)
a. 1
b. 2
c. 3
d. 4
Exhibit 6-2
The travel time for a college student traveling between her home and her college is
uniformly distributed between 40 and 90 minutes.
Refer to Exhibit 6-2. The probability that her trip will take exactly 50 minutes is
a. zero
b. 0.02
c. 0.06
d. 0.20
A researcher is trying to decide whether or not to add another variable to his model. He
has estimated the following model from a sample of 28 observations.
= 23.62 + 18.86x1 + 24.72x2
SSE = 1,425 SSR = 1,326
He has also estimated the model with an additional variable x3. The results are
= 25.32 + 15.29x1 + 7.63x2 + 12.72x3
SSE = 1,300 SSR = 1,451
What advice would you give this researcher? Use a .05 level of significance.
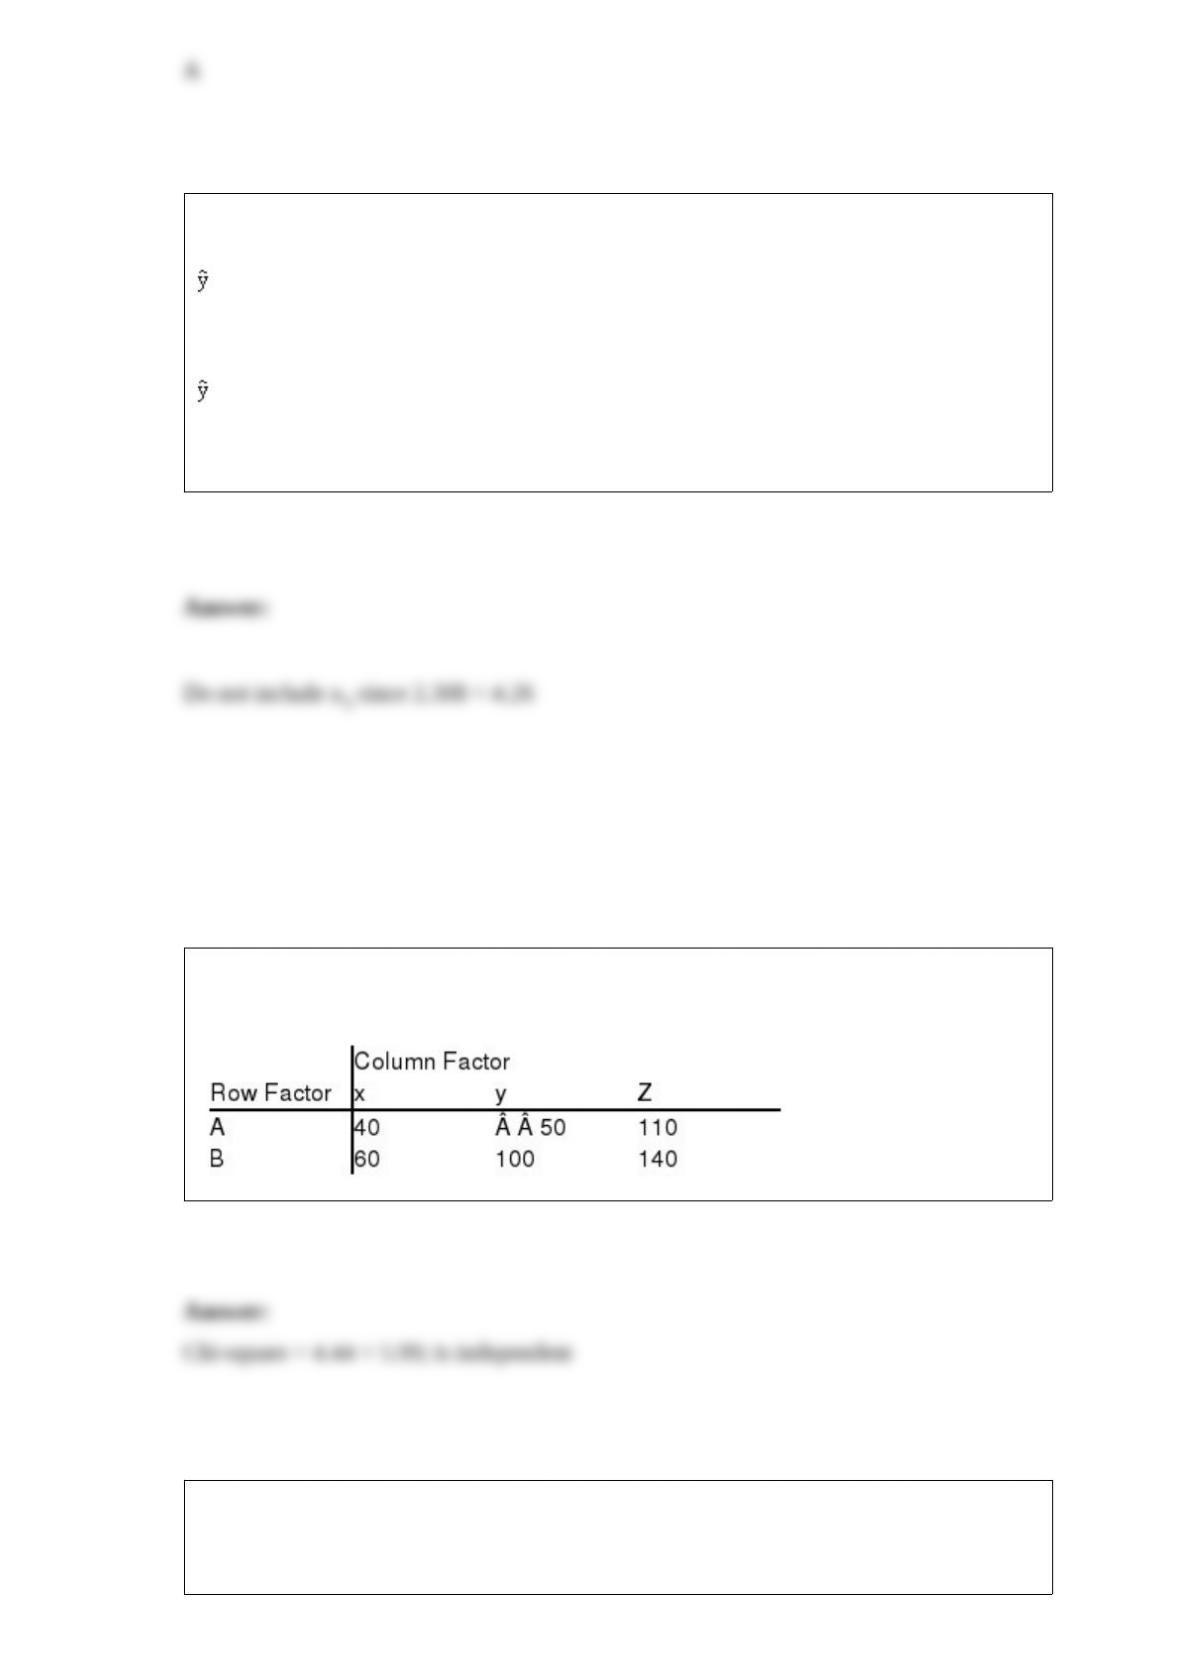
Shown below is a 2 3 contingency table with observed values from a sample of 500.
At 95% confidence, test for independence of the row and column factors.
A research organization wishes to determine whether four brands of batteries for
transistor radios perform equally well. Three batteries of each type were randomly
selected and installed in the three test radios. The number of hours of use for each
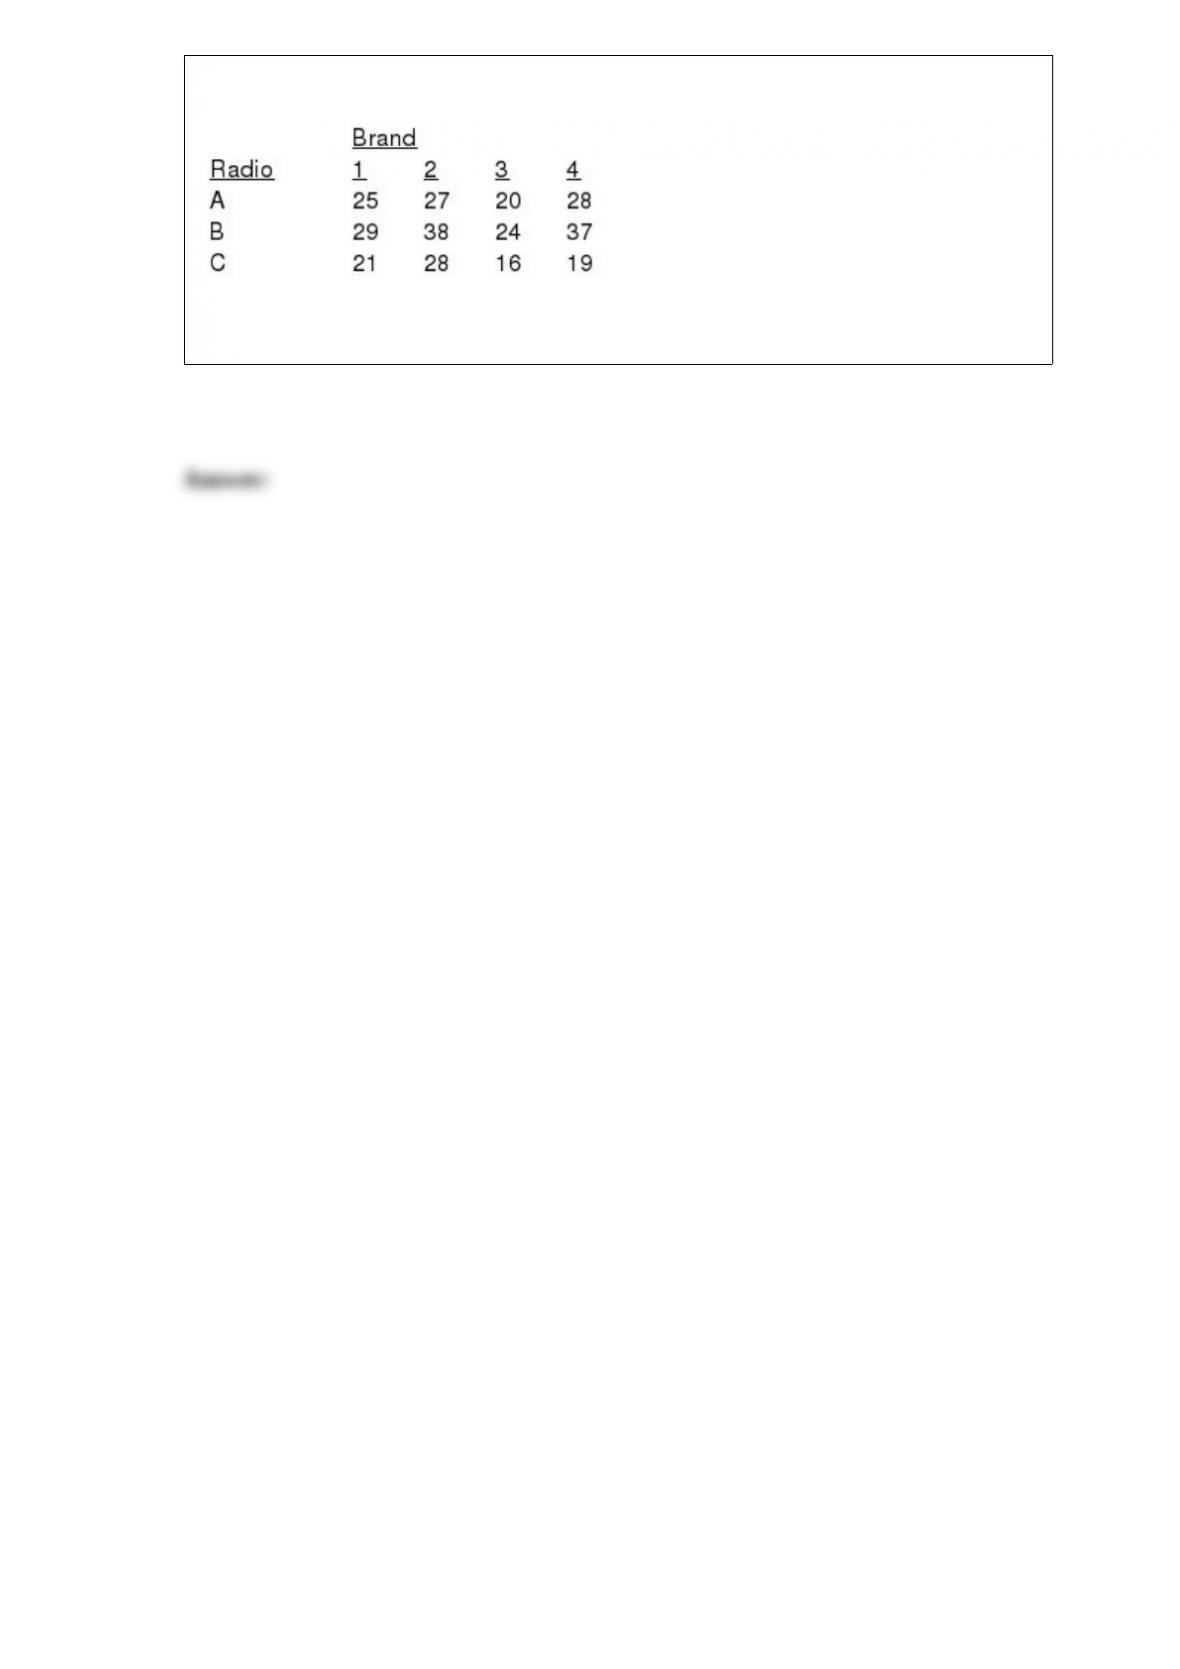
battery is given below.
Consider the three different test radios and use Excel to carry out the analysis of
variance procedure for a randomized block design. Use a .05 level of significance.
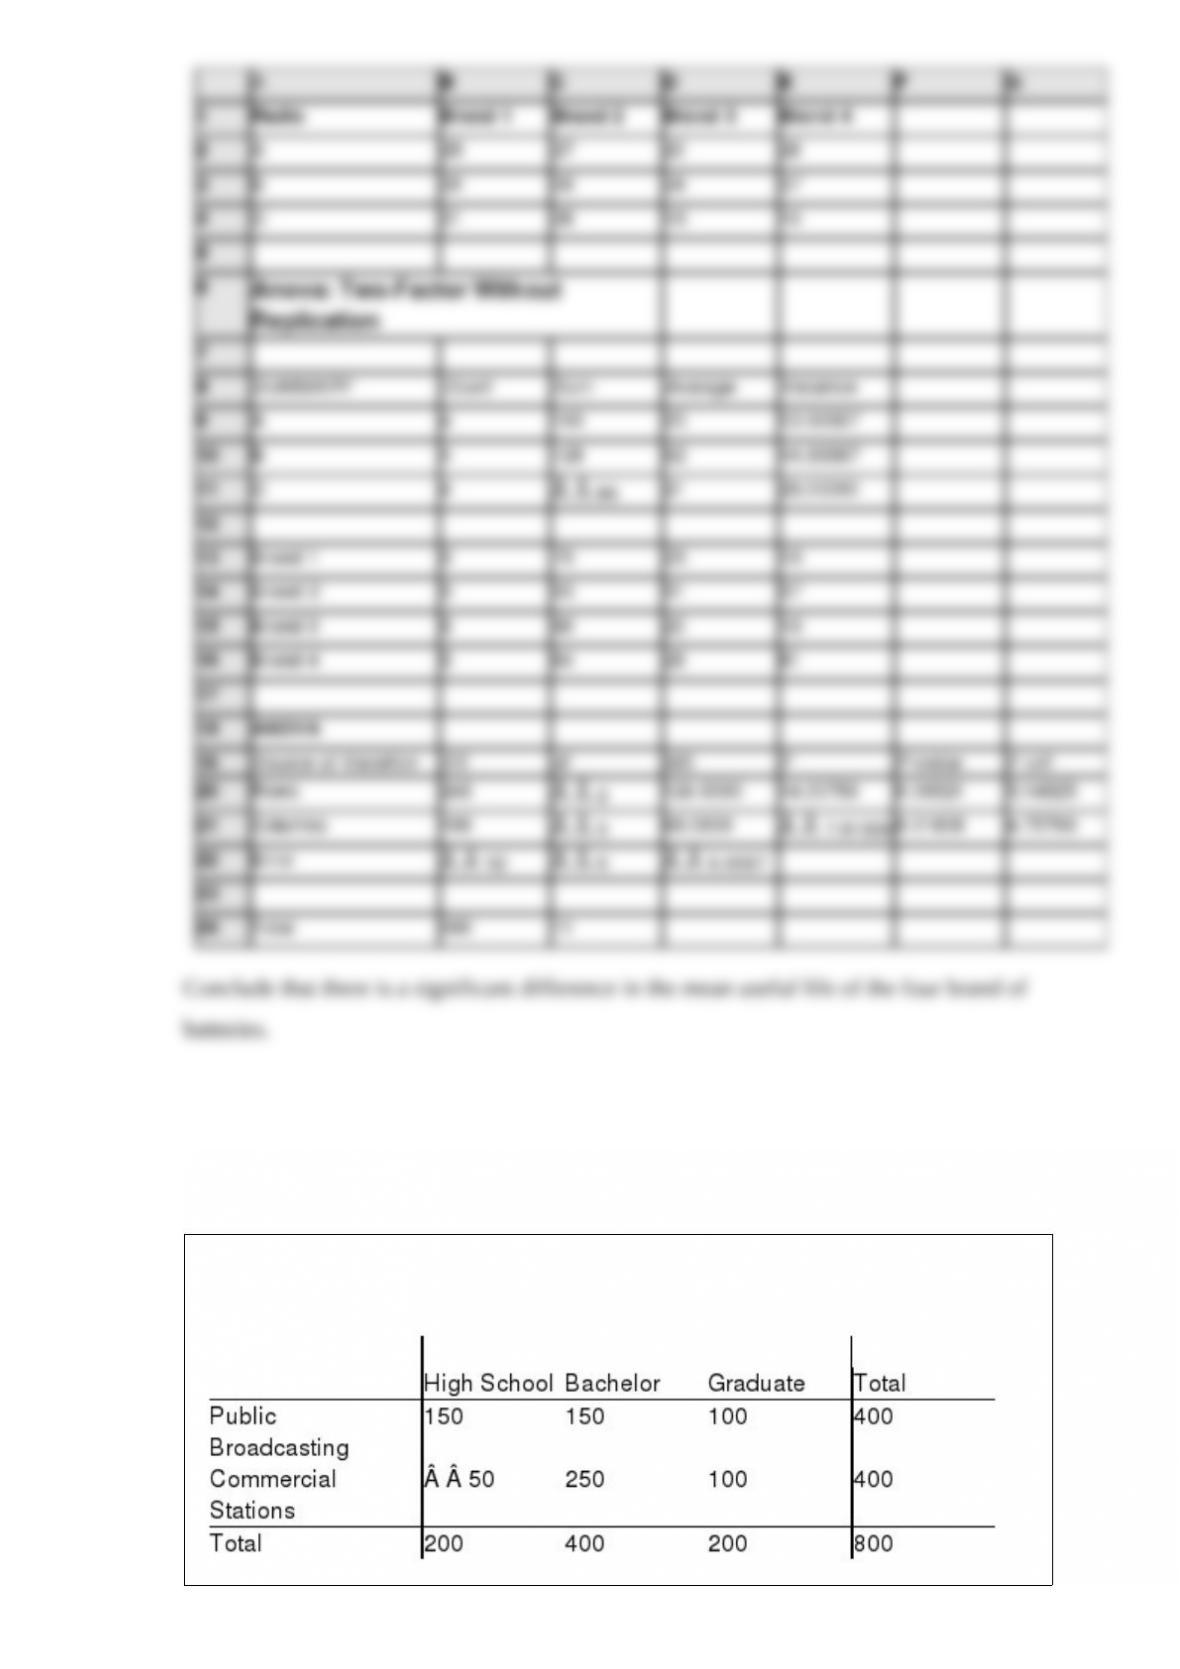
From a poll of 800 television viewers, the following data have been accumulated as to
their levels of education and their preference of television stations:
Test at = .05 to determine if the selection of a TV station is dependent upon the level
of education.
When a particular machine is functioning properly, 80% of the items produced are
non-defective. If three items are examined, what is the probability that one is defective?
Use the binomial probability function to answer this question.
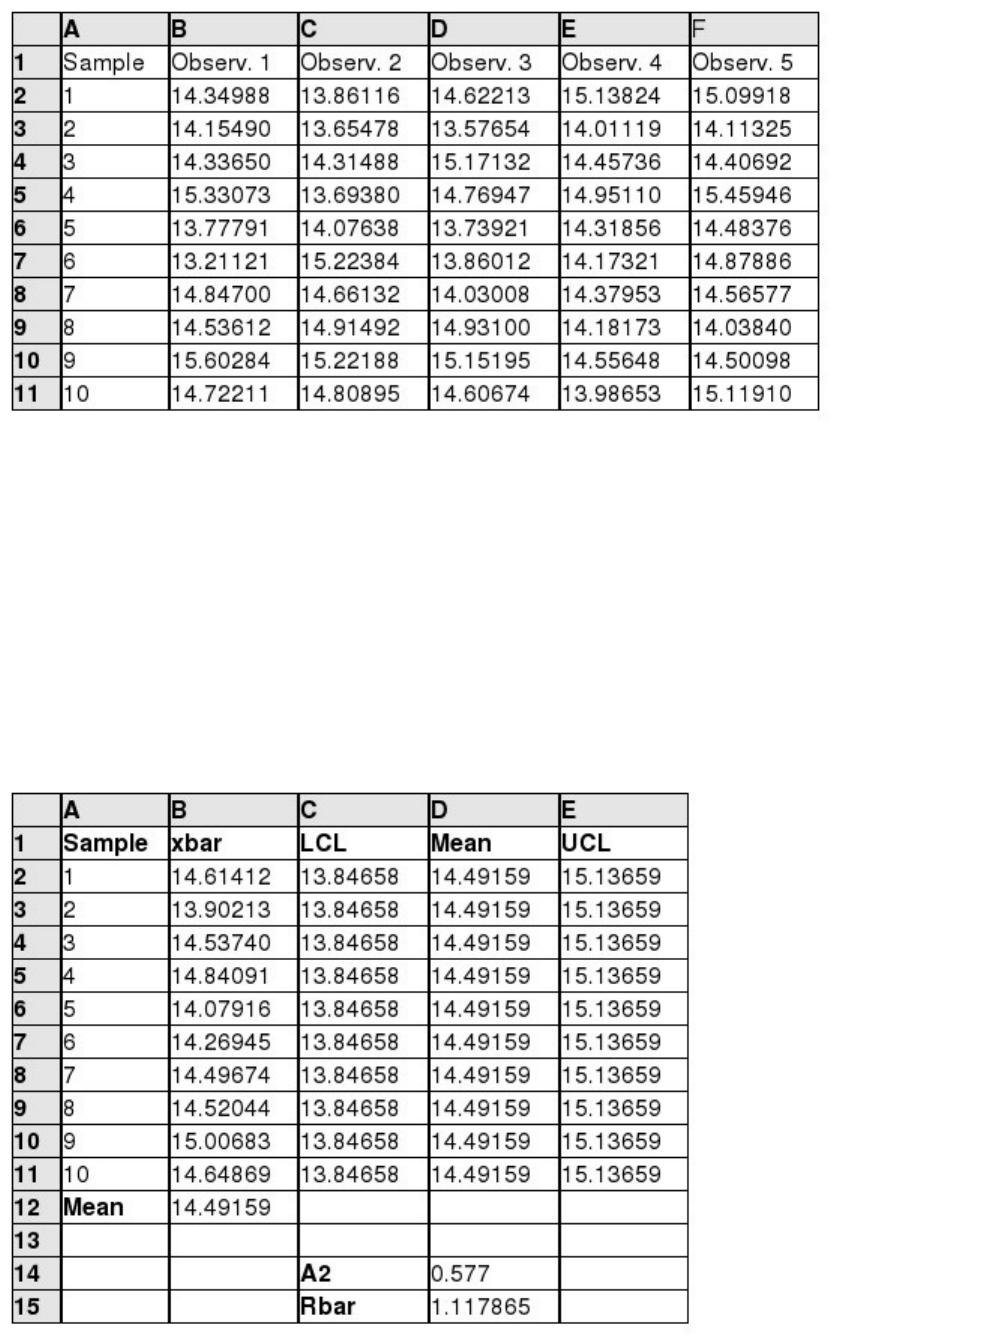
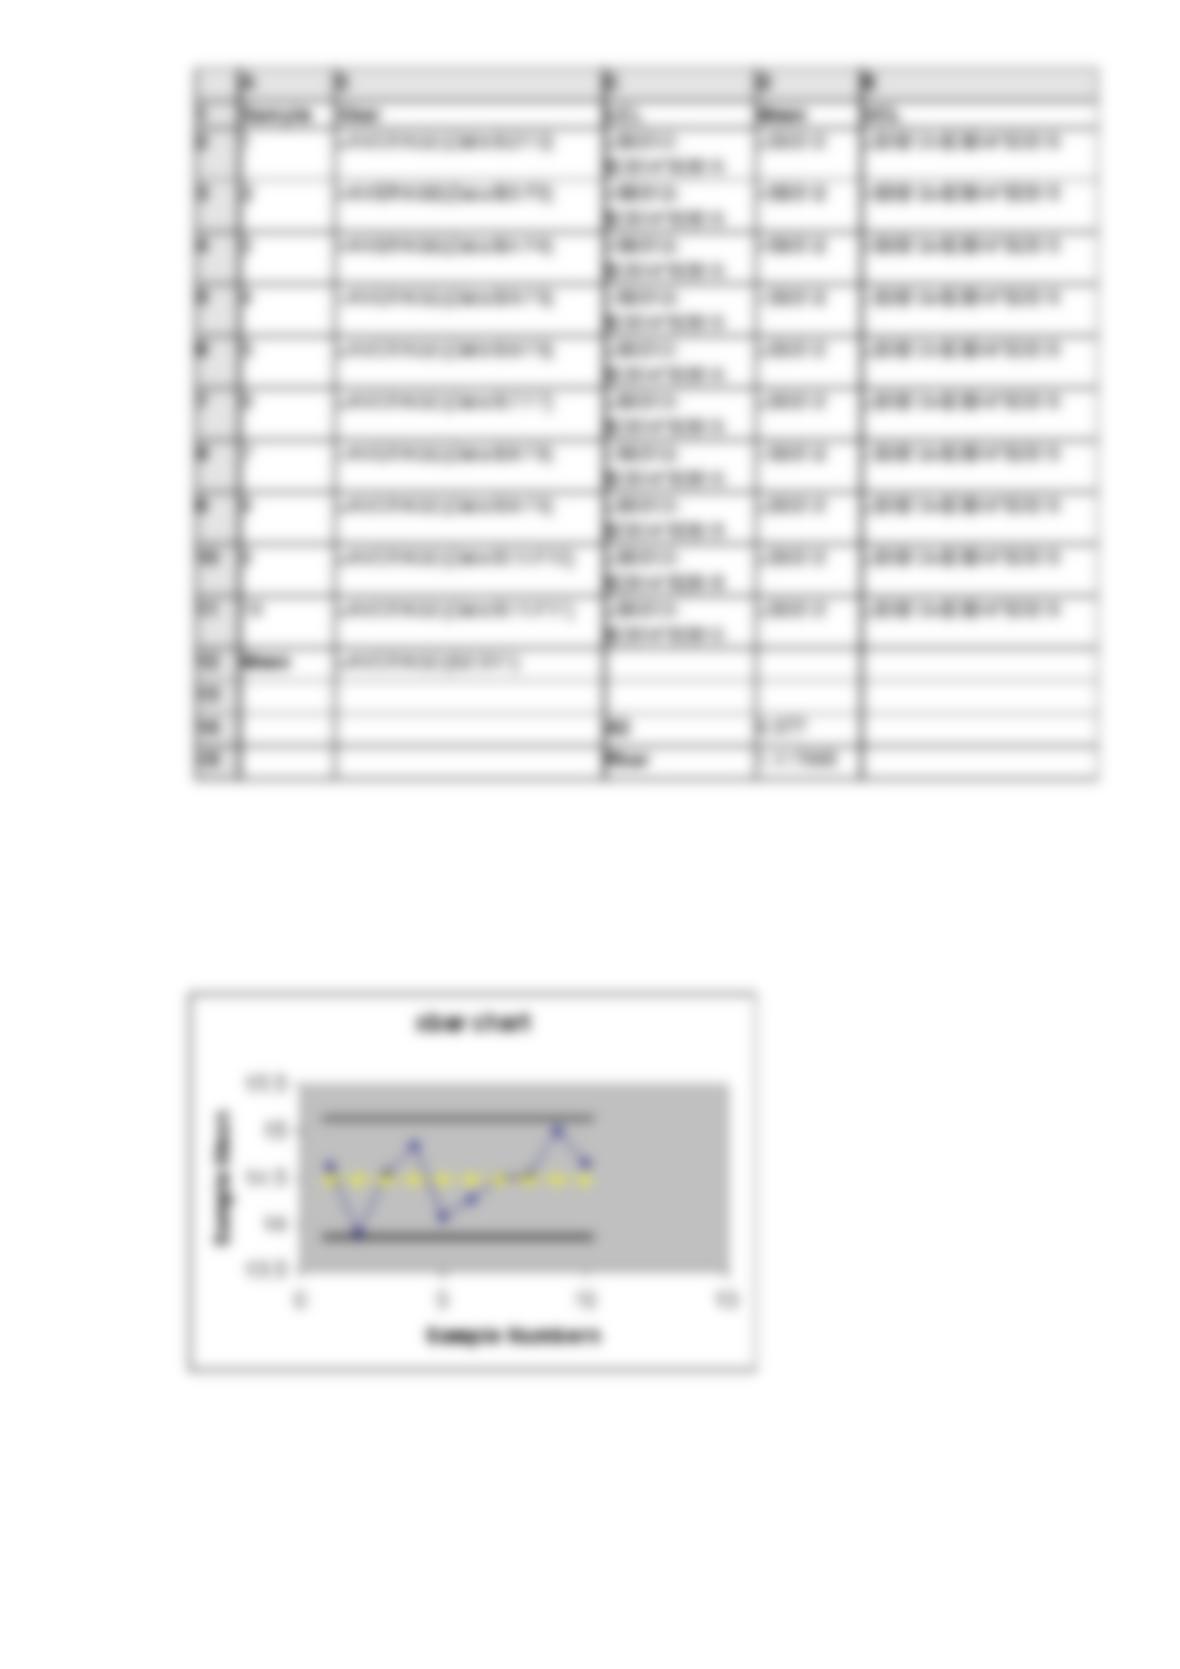
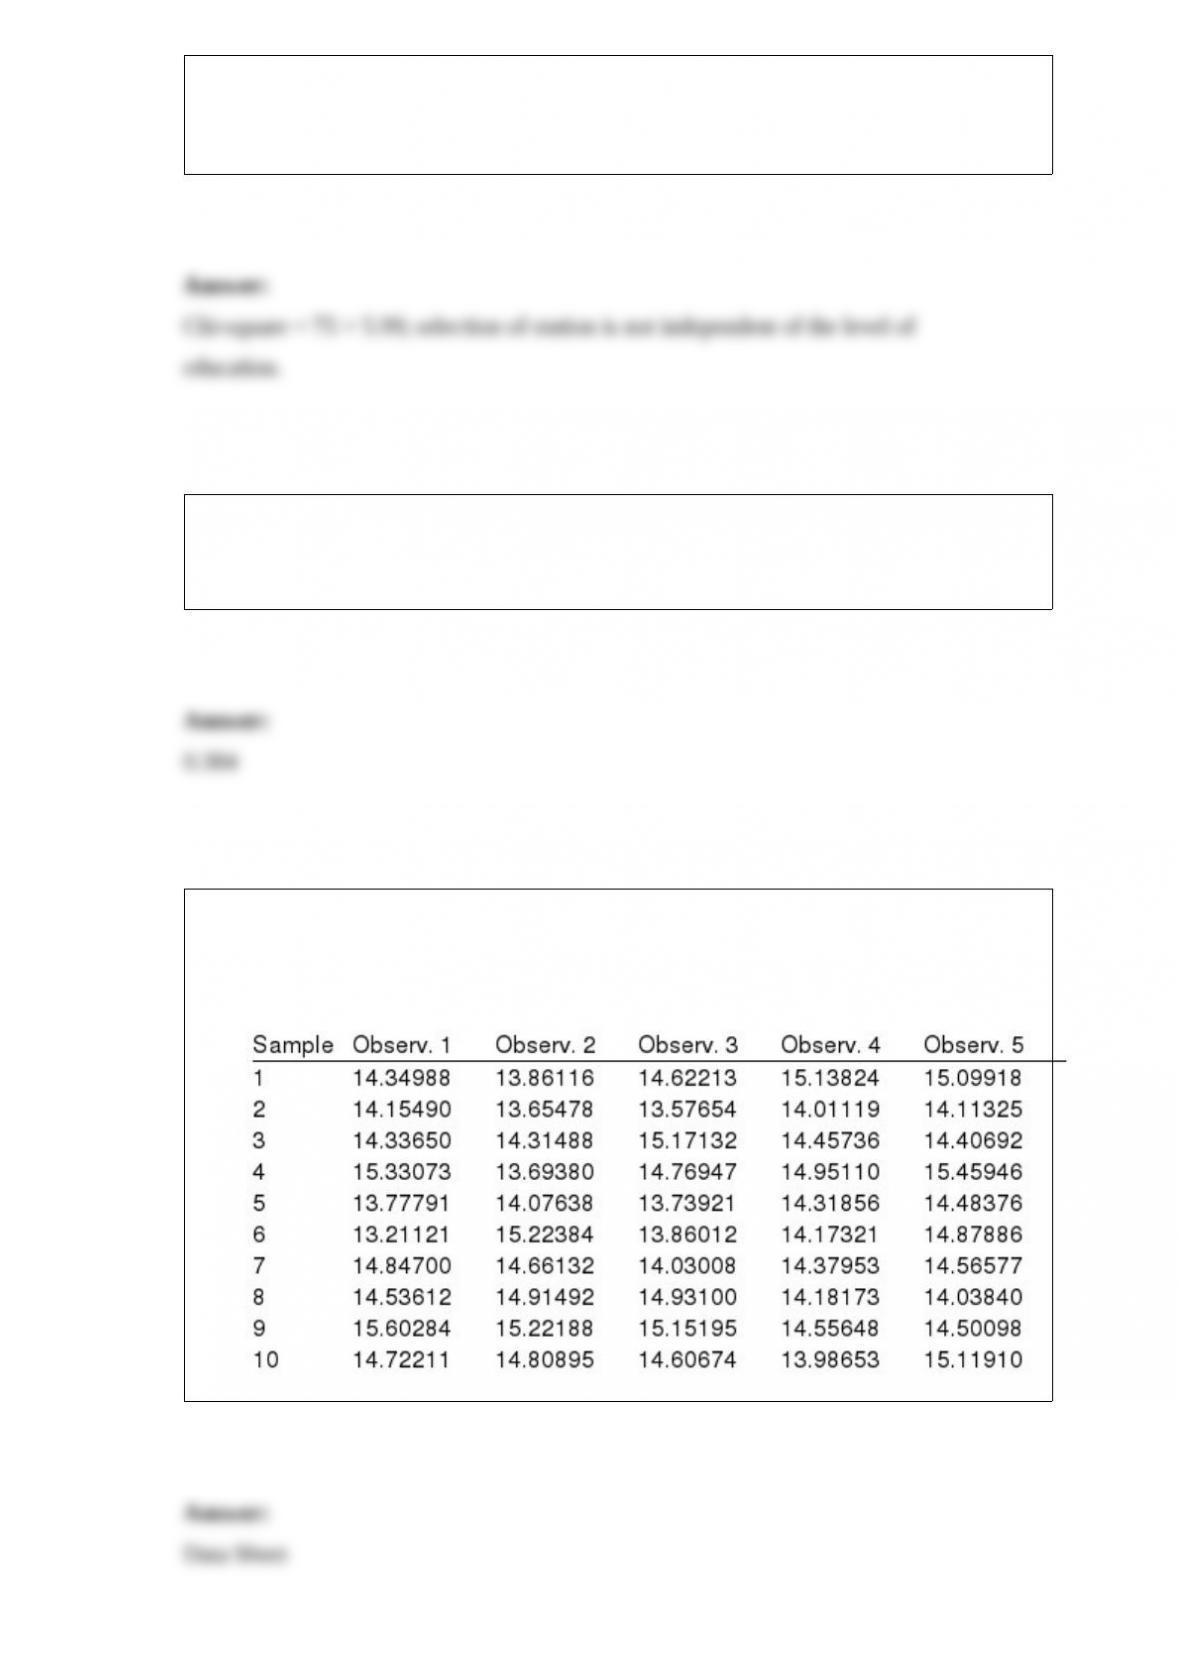
The following data represent the filling weights based on samples of 14.5 ounce cans of
whole peeled tomatoes. Ten samples of size 5 were taken. Use Excel to develop an
x-bar chart.