For the standard normal distribution, determine the probability of obtaining a z value
a. greater than zero.
b. between -2.34 to -2.55
c. less than 1.86.
d. between -1.95 to 2.7.
e. between 1.5 to 2.75.
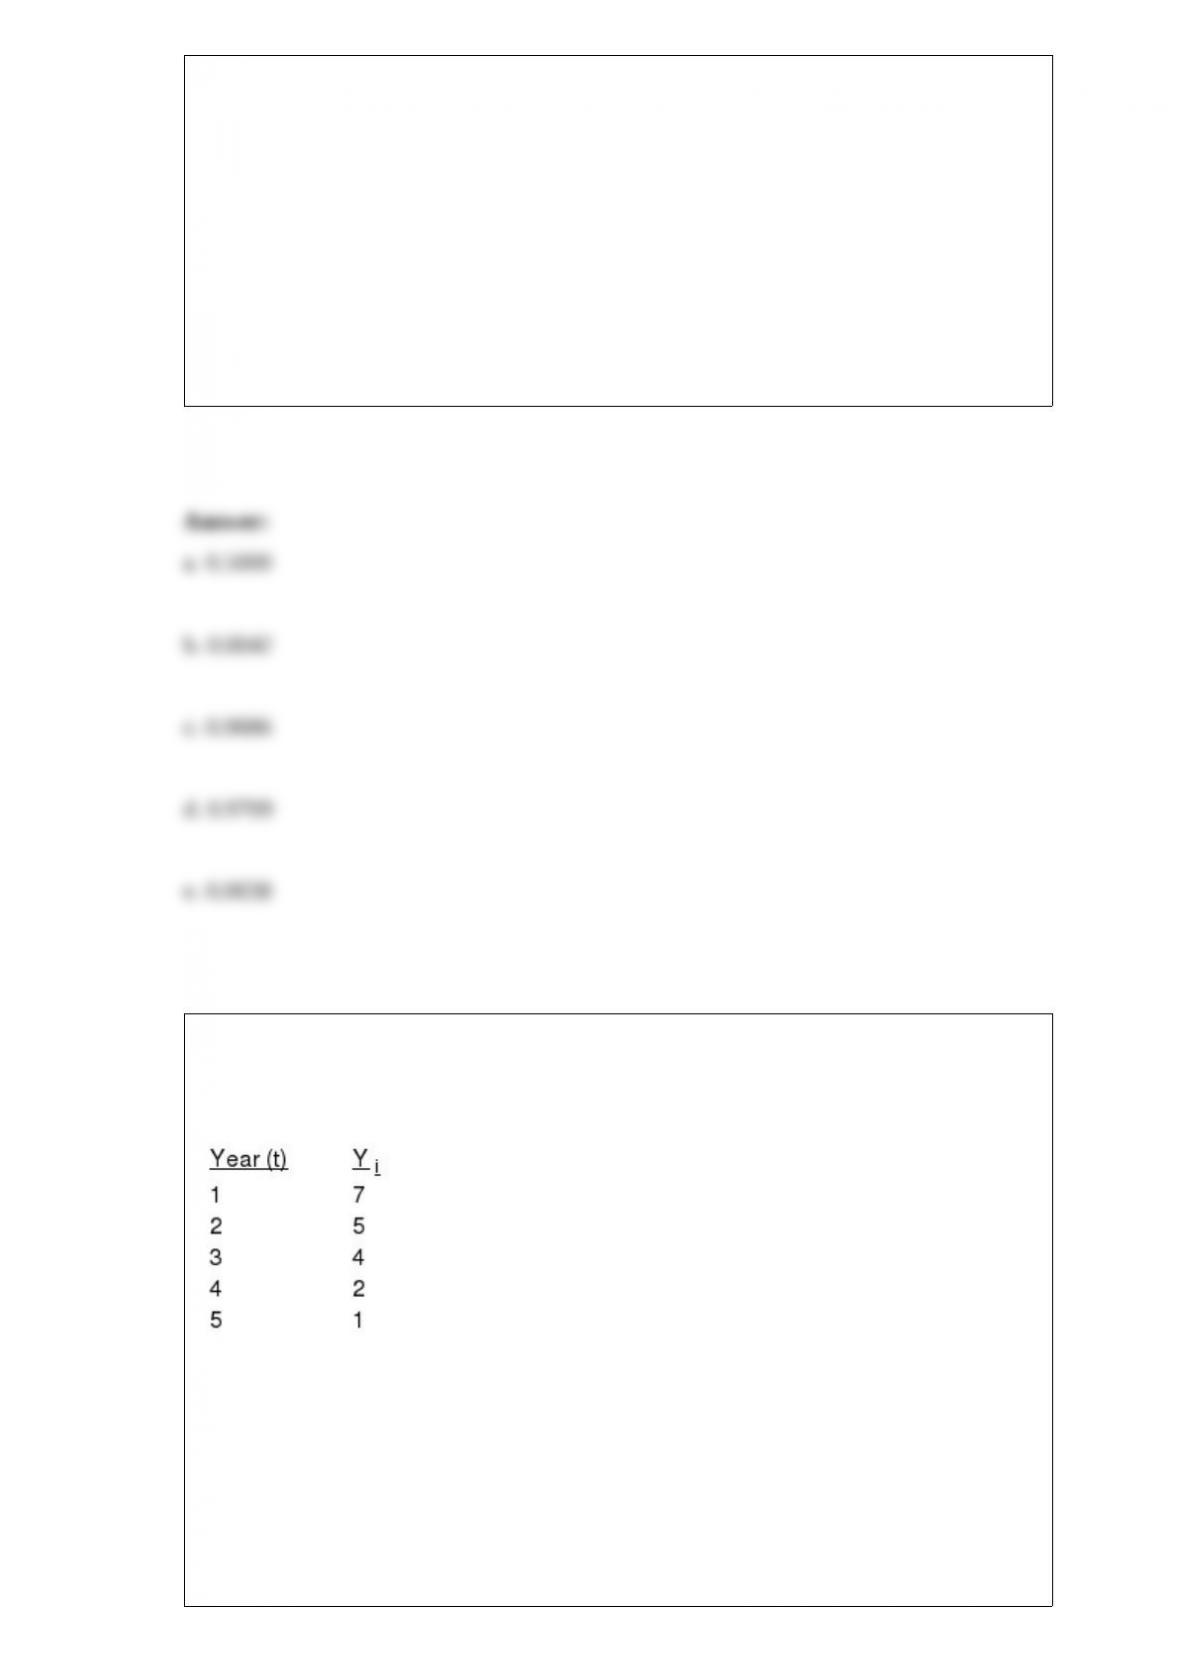
46. Exhibit 17-3
Consider the following time series.
Refer to Exhibit 17-3. In which time period does the value of Yi reach zero?
a. 0.000
b. 0.181
c. 5.53
d. 4.21
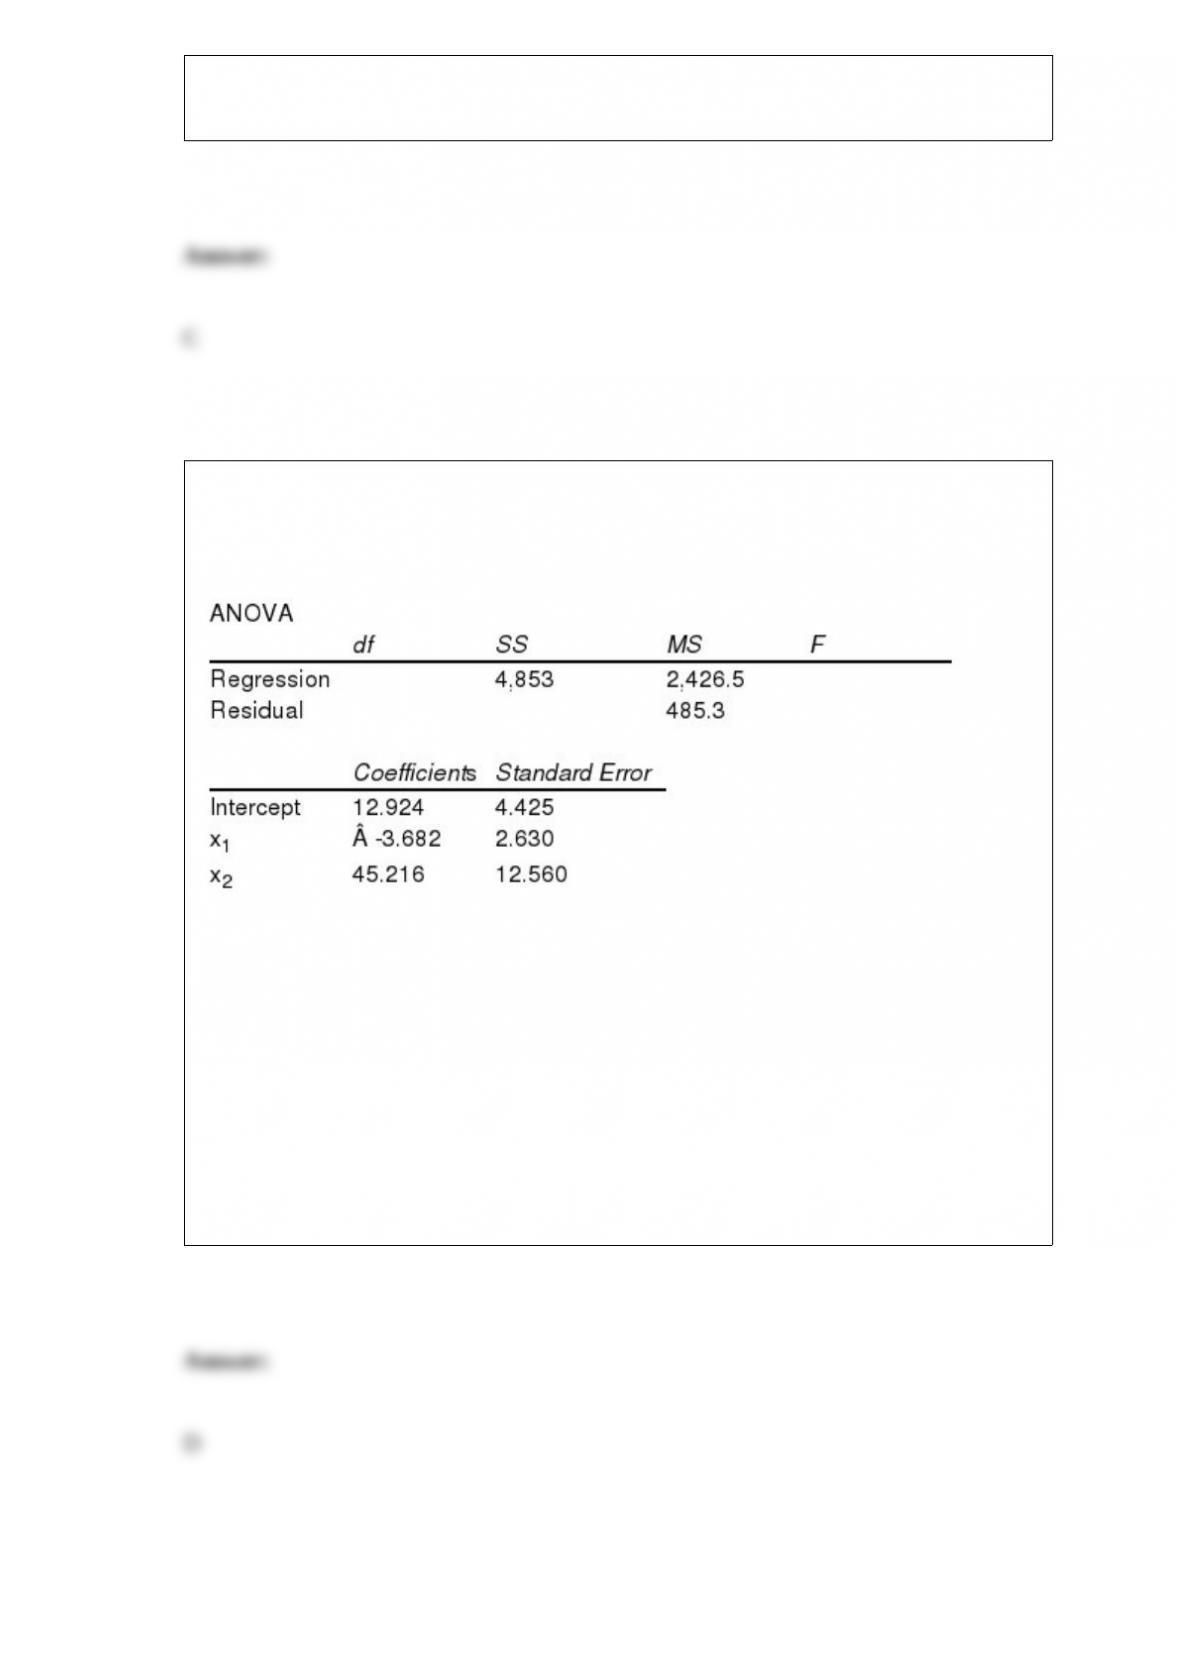
Exhibit 15-6
Below you are given a partial Excel output based on a sample of 16 observations.
Refer to Exhibit 15-6. The test statistic used to determine if there is a relationship
among the variables equals
a. -1.4
b. 0.2
c. 0.77
d. 5

Given that event E has a probability of 0.25, the probability of the complement of event
E
a. cannot be determined with the above information
b. can have any value between zero and one
c. must be 0.75
d. is 0.25
The following model
y = 0 + 1x1 +
is referred to as a
a. curvilinear model
b. curvilinear model with one predictor variable
c. simple second-order model with one predictor variable
d. simple first-order model with one predictor variable
The data below represents the fields of specialization for a randomly selected sample of
undergraduate students. Test to determine whether there is a significant difference in the
fields of specialization between regions of the country. Use a .05 level of significance.
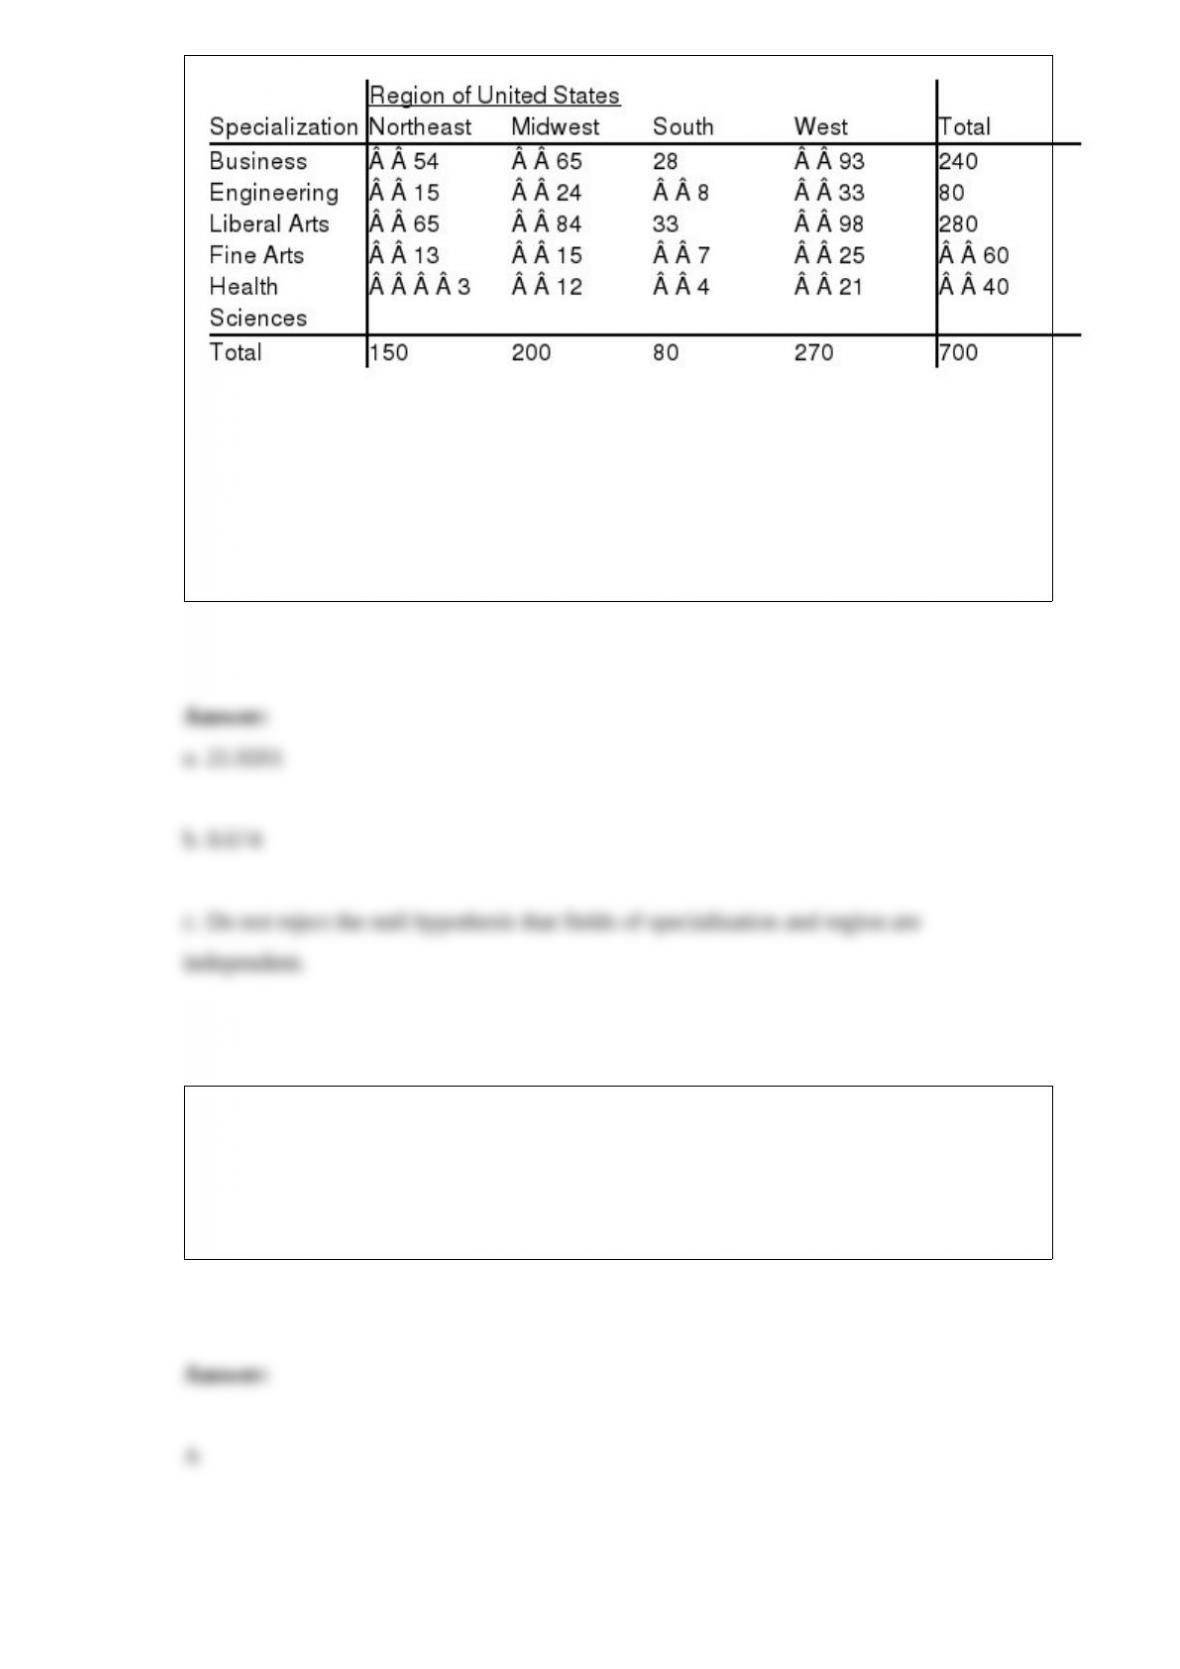
a. State the critical value of the chi-square random variable for this test of independence
of categories.
b. Calculate the value of the test statistic.
c. What is the conclusion for this test?
The minimum number of variables represented in a bar chart is
a. 1
b. 2
c. 3
d. 4
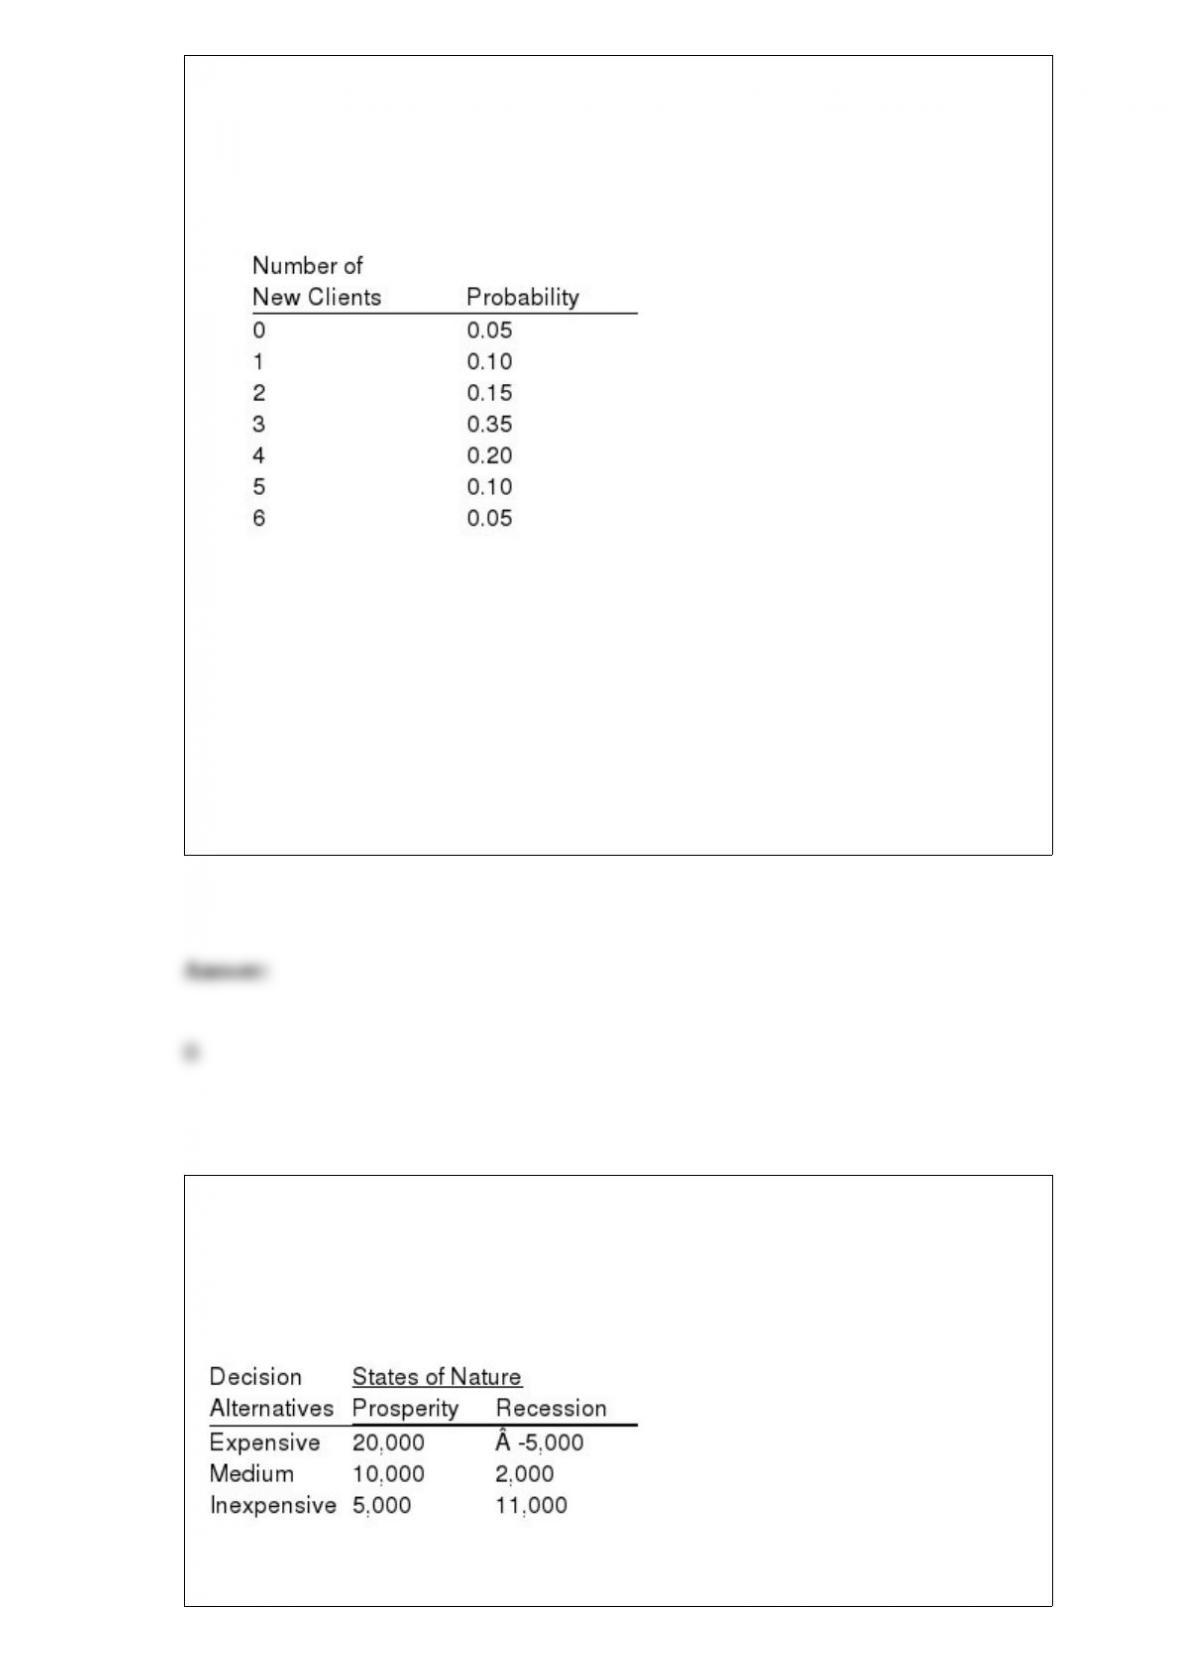
Exhibit 5-5
AMR is a computer-consulting firm. The number of new clients that they have obtained
each month has ranged from 0 to 6. The number of new clients has the probability
distribution that is shown below.
Refer to Exhibit 5-5. The variance is
a. 1.431
b. 2.0475
c. 3.05
d. 21
A group of investors wants to open up a jewelry store in a new shopping center. The
investors are trying to decide whether to stock the store with inexpensive jewelry,
medium-priced jewelry, or expensive jewelry. The probability of their choice depends
upon the economic conditions. The payoff table below gives the anticipated profits for
different states of the economy. The probability of prosperity is 0.5.
a. Determine the expected value of each alternative and indicate which decision

alternative is the best.
b. Determine the expected value with perfect information about the states of nature.
c. Determine the expected value of perfect information.
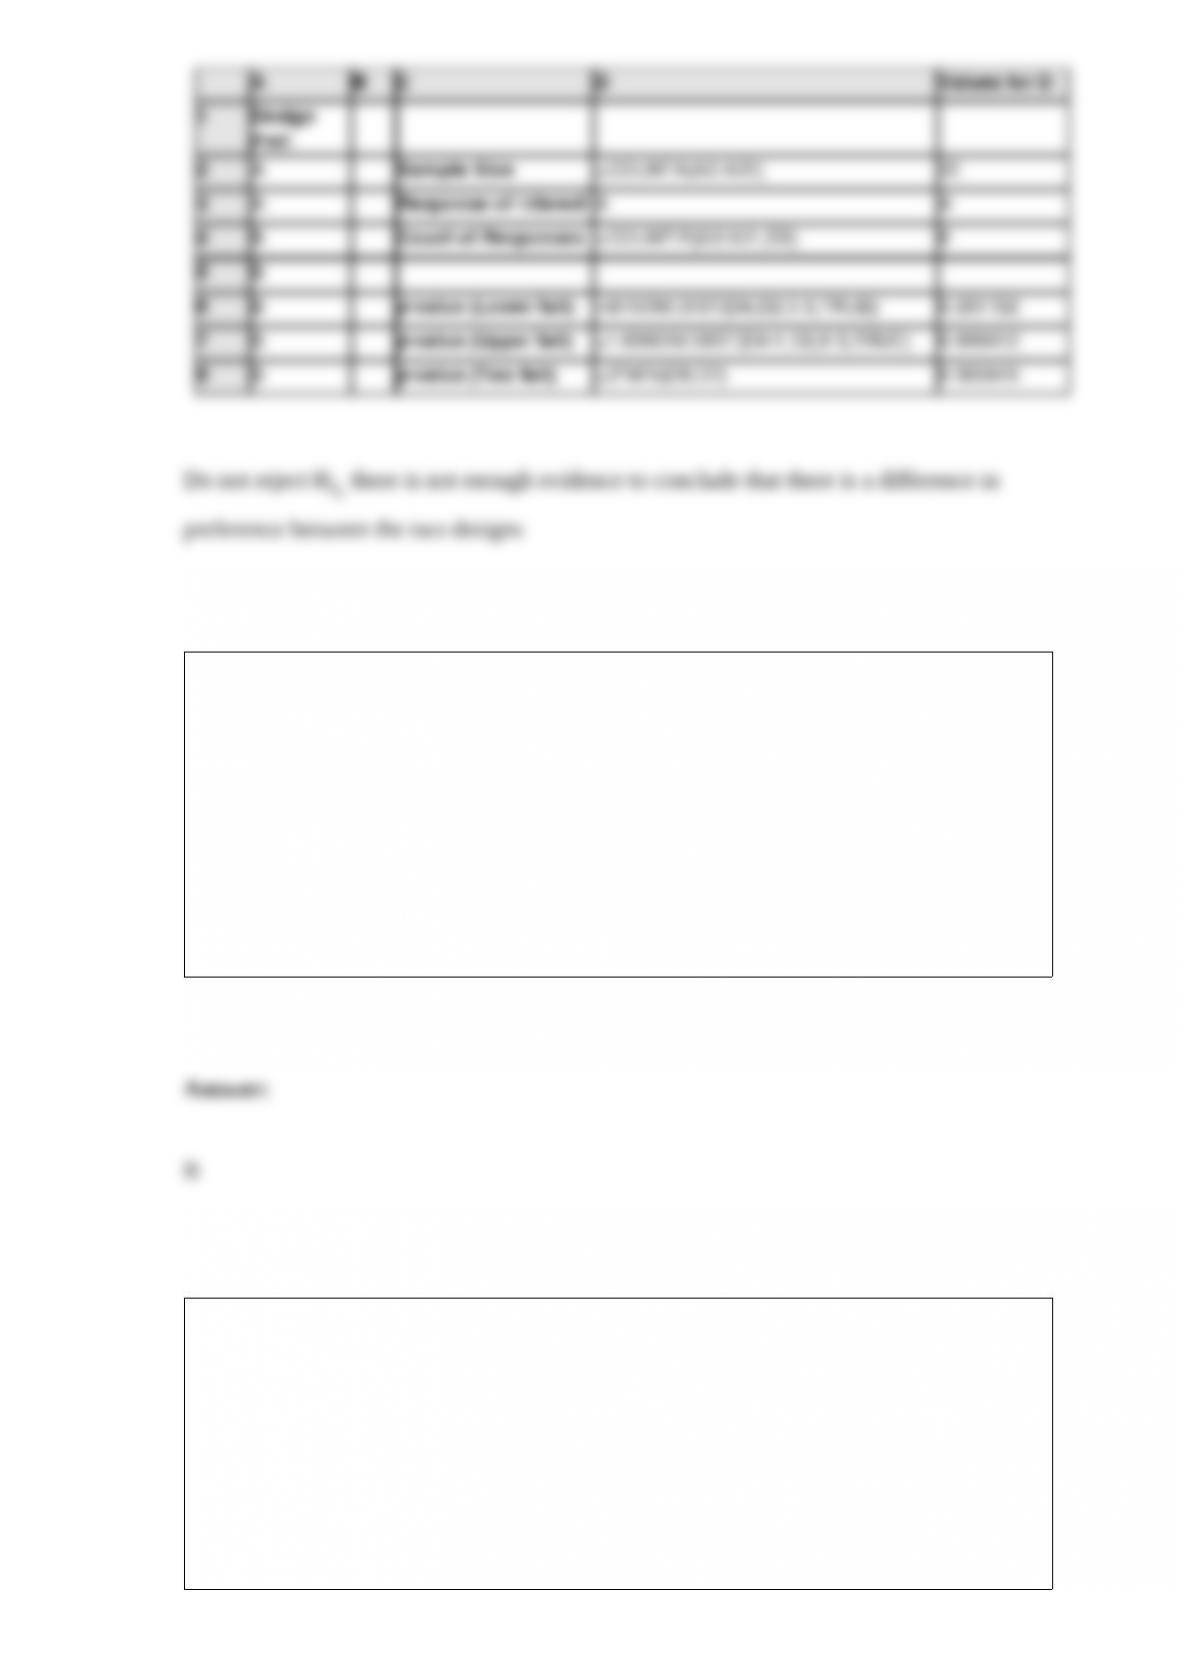
A market research firm is conducting a study to determine which of two package
designs for a liquid soap product potential customers prefer, the current design (A) or a
new design (B). A sample of 20 potential customers is taken. The results follow.
Use Excel to conduct the appropriate hypothesis test at = .05 to determine if the data
indicate that there is a difference in preference between the two designs.
Excel’s __________ function can be used to calculate a p-value for a hypothesis test
when is unknown.
a. RAND
b. T.DIST
c. NORM.S.DIST
d. Not enough information is given to answer this question.
A random sample of 25 employees of a local company has been measured. A 95%
confidence interval estimate for the mean systolic blood pressure for all company
employees is 123 to 139. Which of the following statements is valid?
a. 95% of the sample of employees has a systolic blood pressure between 123 and 139.
b. If the sampling procedure were repeated many times, 95% of the resulting confidence
intervals would contain the population mean systolic blood pressure.

c. 95% of the population of employees has a systolic blood pressure between 123 and
139.
d. If the sampling procedure were repeated many times, 95% of the sample means
would be between 123 and 139.
The sampling distribution of is approximated by a
a. normal distribution
b. t-distribution with n1 + n2 degrees of freedom
c. t-distribution with n1 + n2 – 1 degrees of freedom
d. t-distribution with n1 + n2 + 2 degrees of freedom
For a continuous random variable x, the probability density function f(x) represents
a. the probability at a given value of x
b. the area under the curve at x
c. Both the probability at a given value of x and the area under the curve at x are correct
answers.
d. the height of the function at x
The difference between the largest and the smallest data values is the
a. variance
b. interquartile range
c. range
d. coefficient of variation
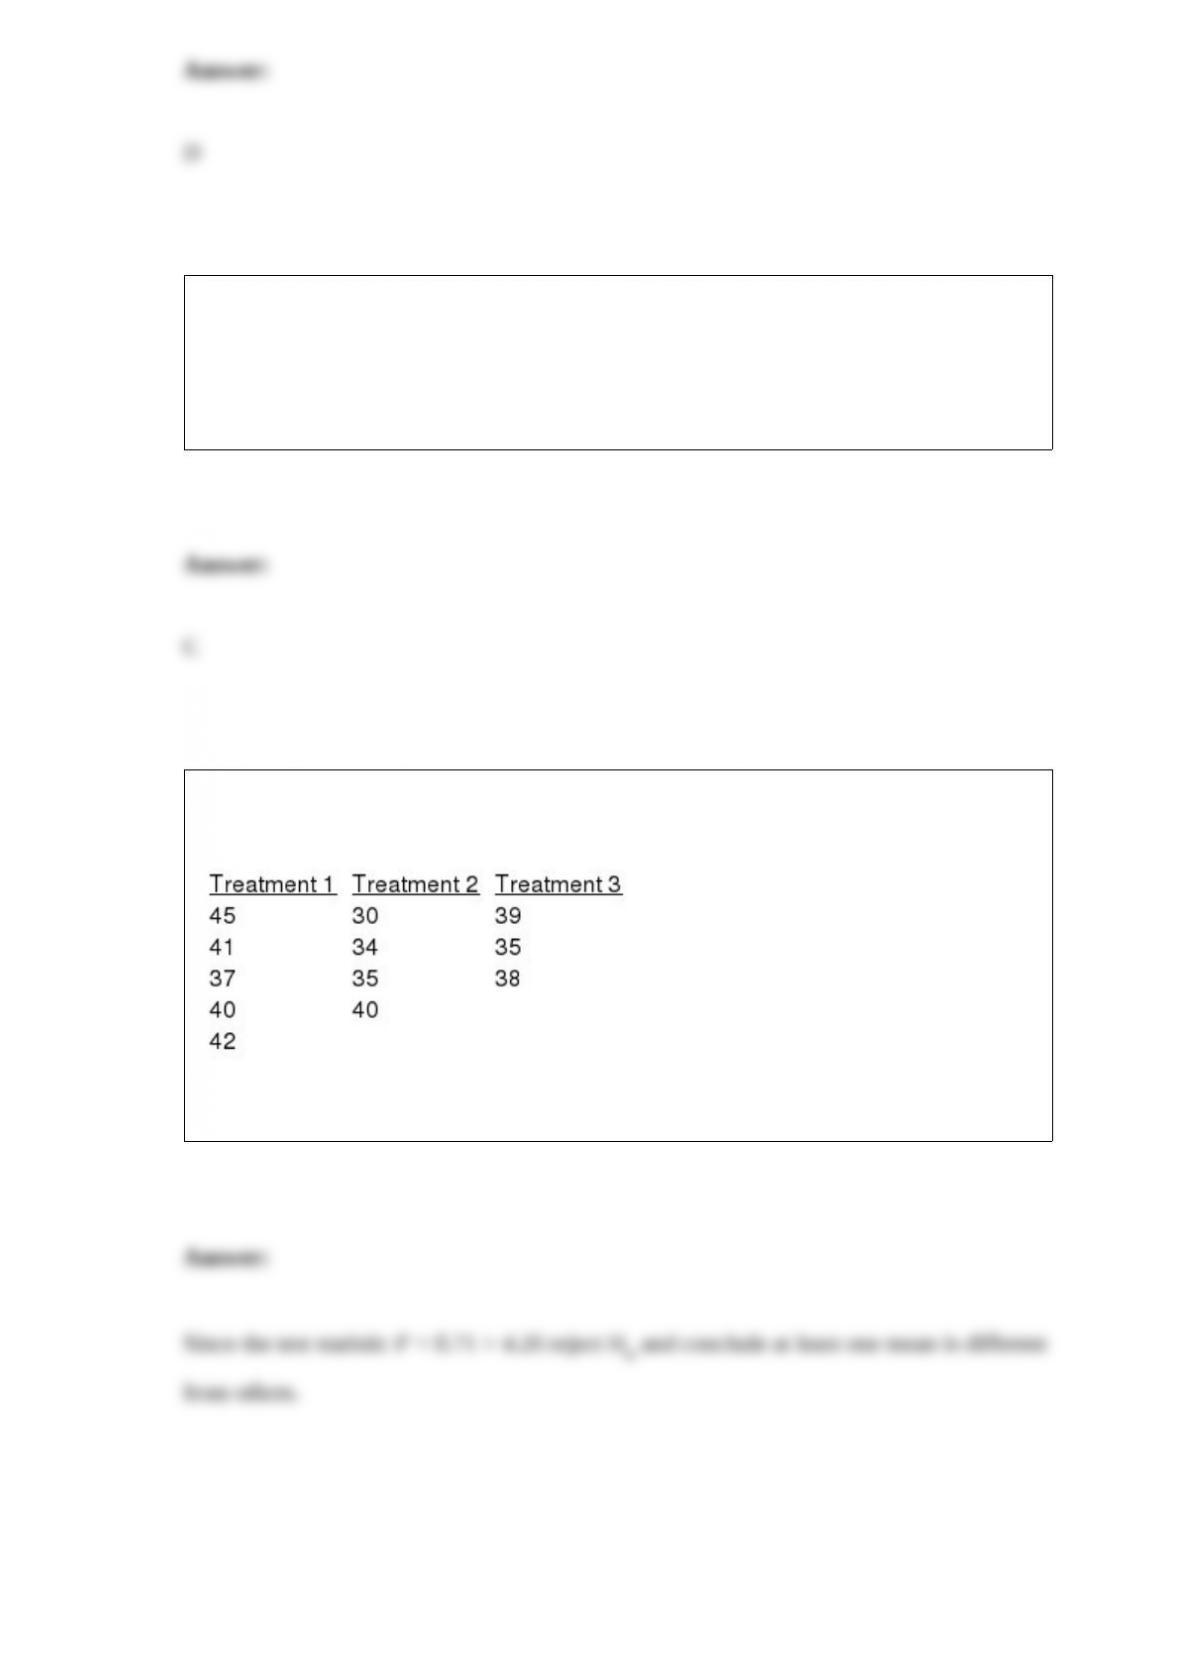
Random samples were selected from three populations. The data obtained are shown
below.
At a 5% level of significance, test to see if there is a significant difference in the means
of the three populations. (Please note that the sample sizes are not equal.)
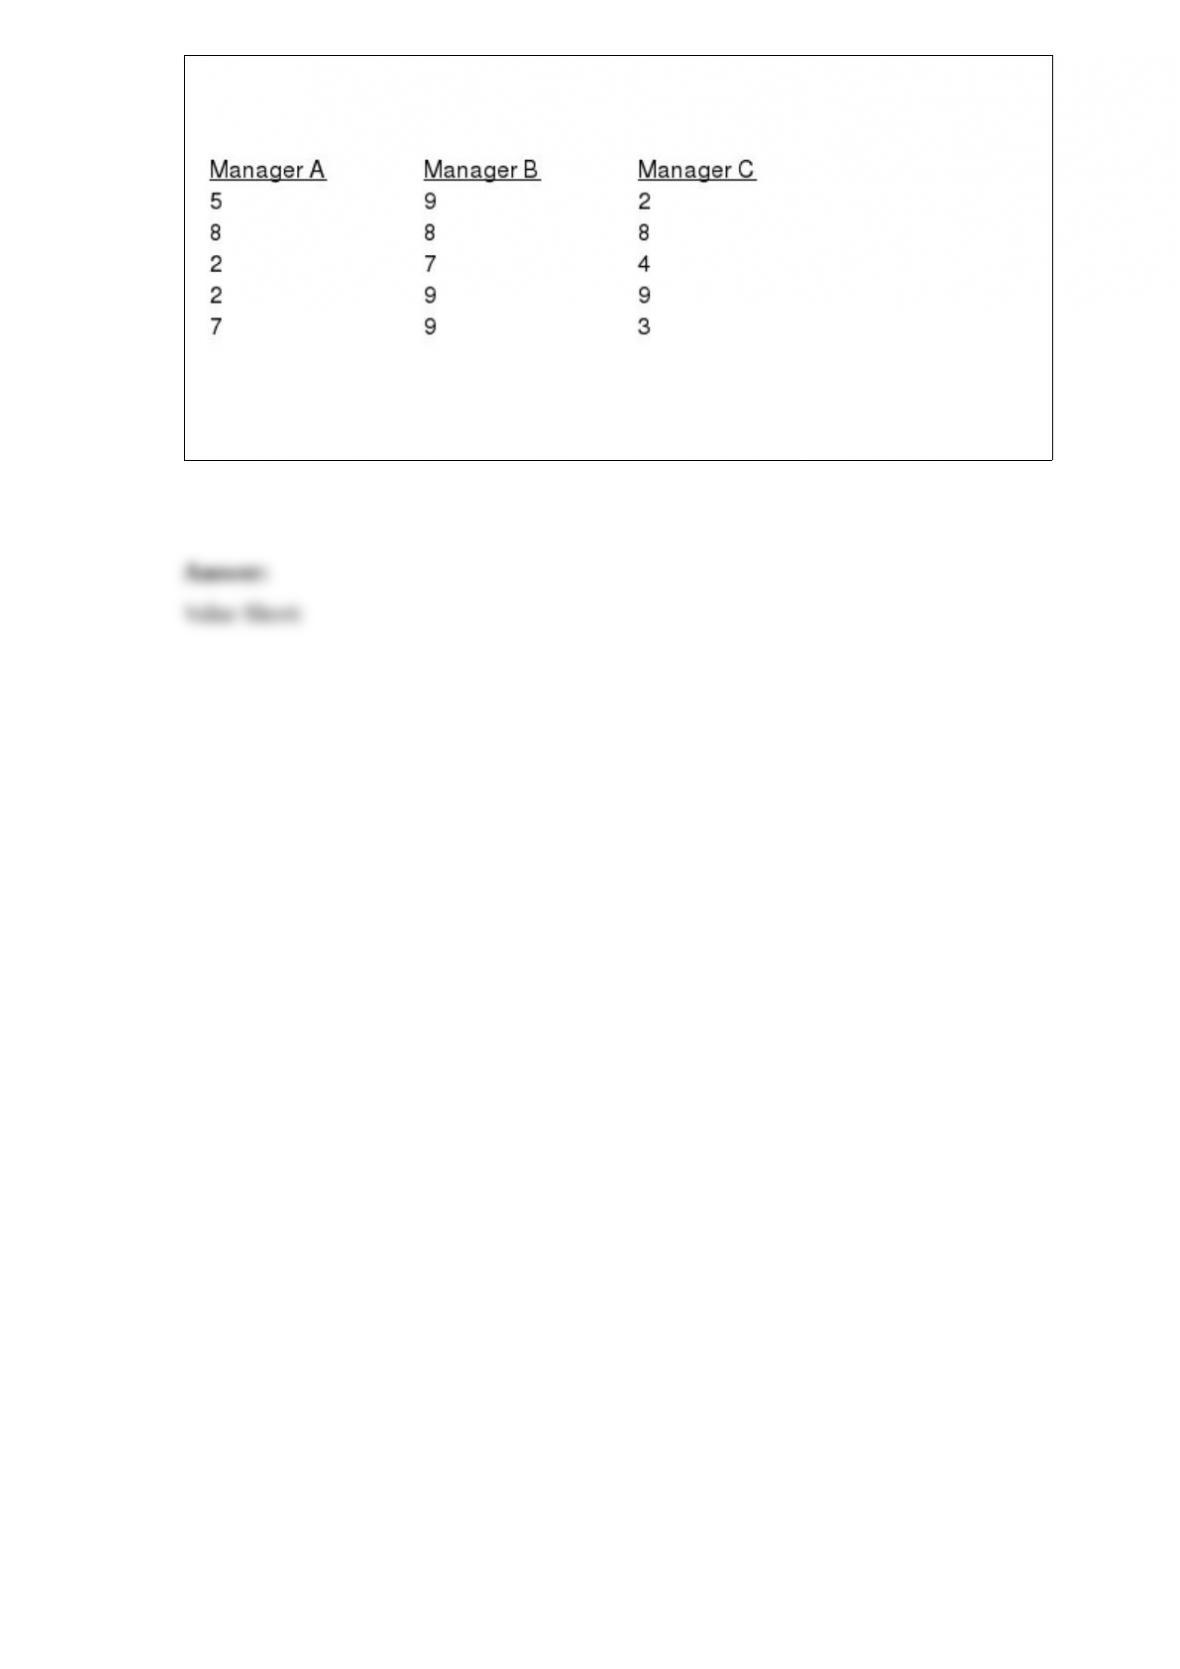
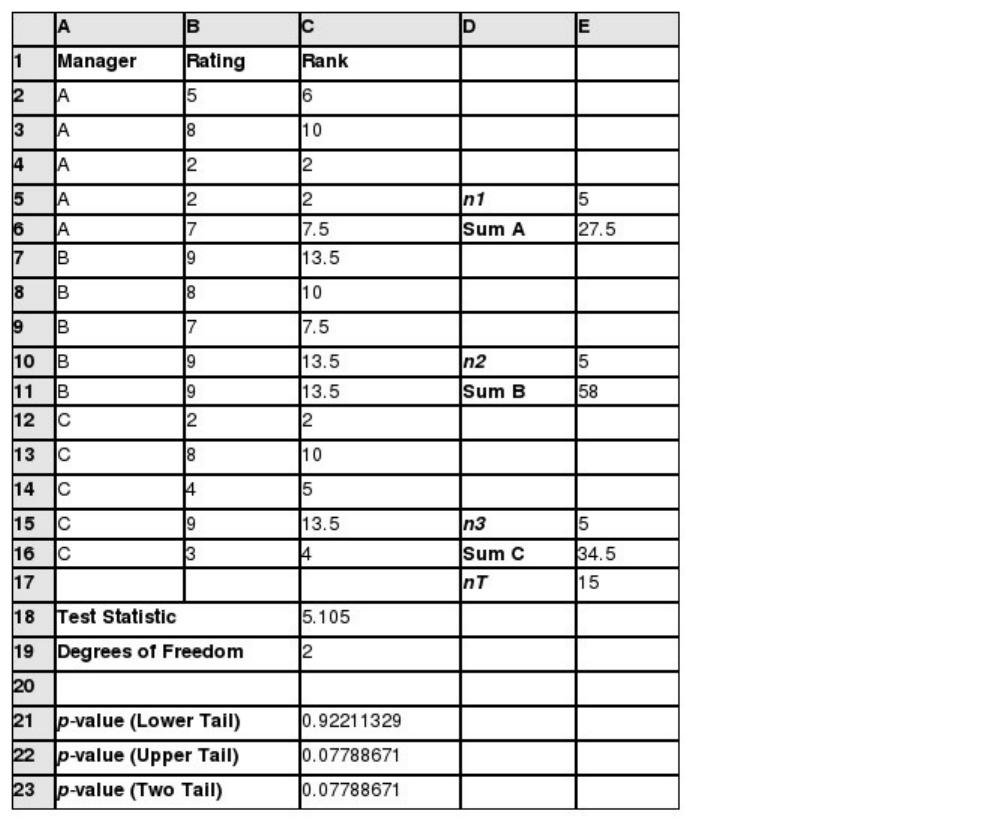
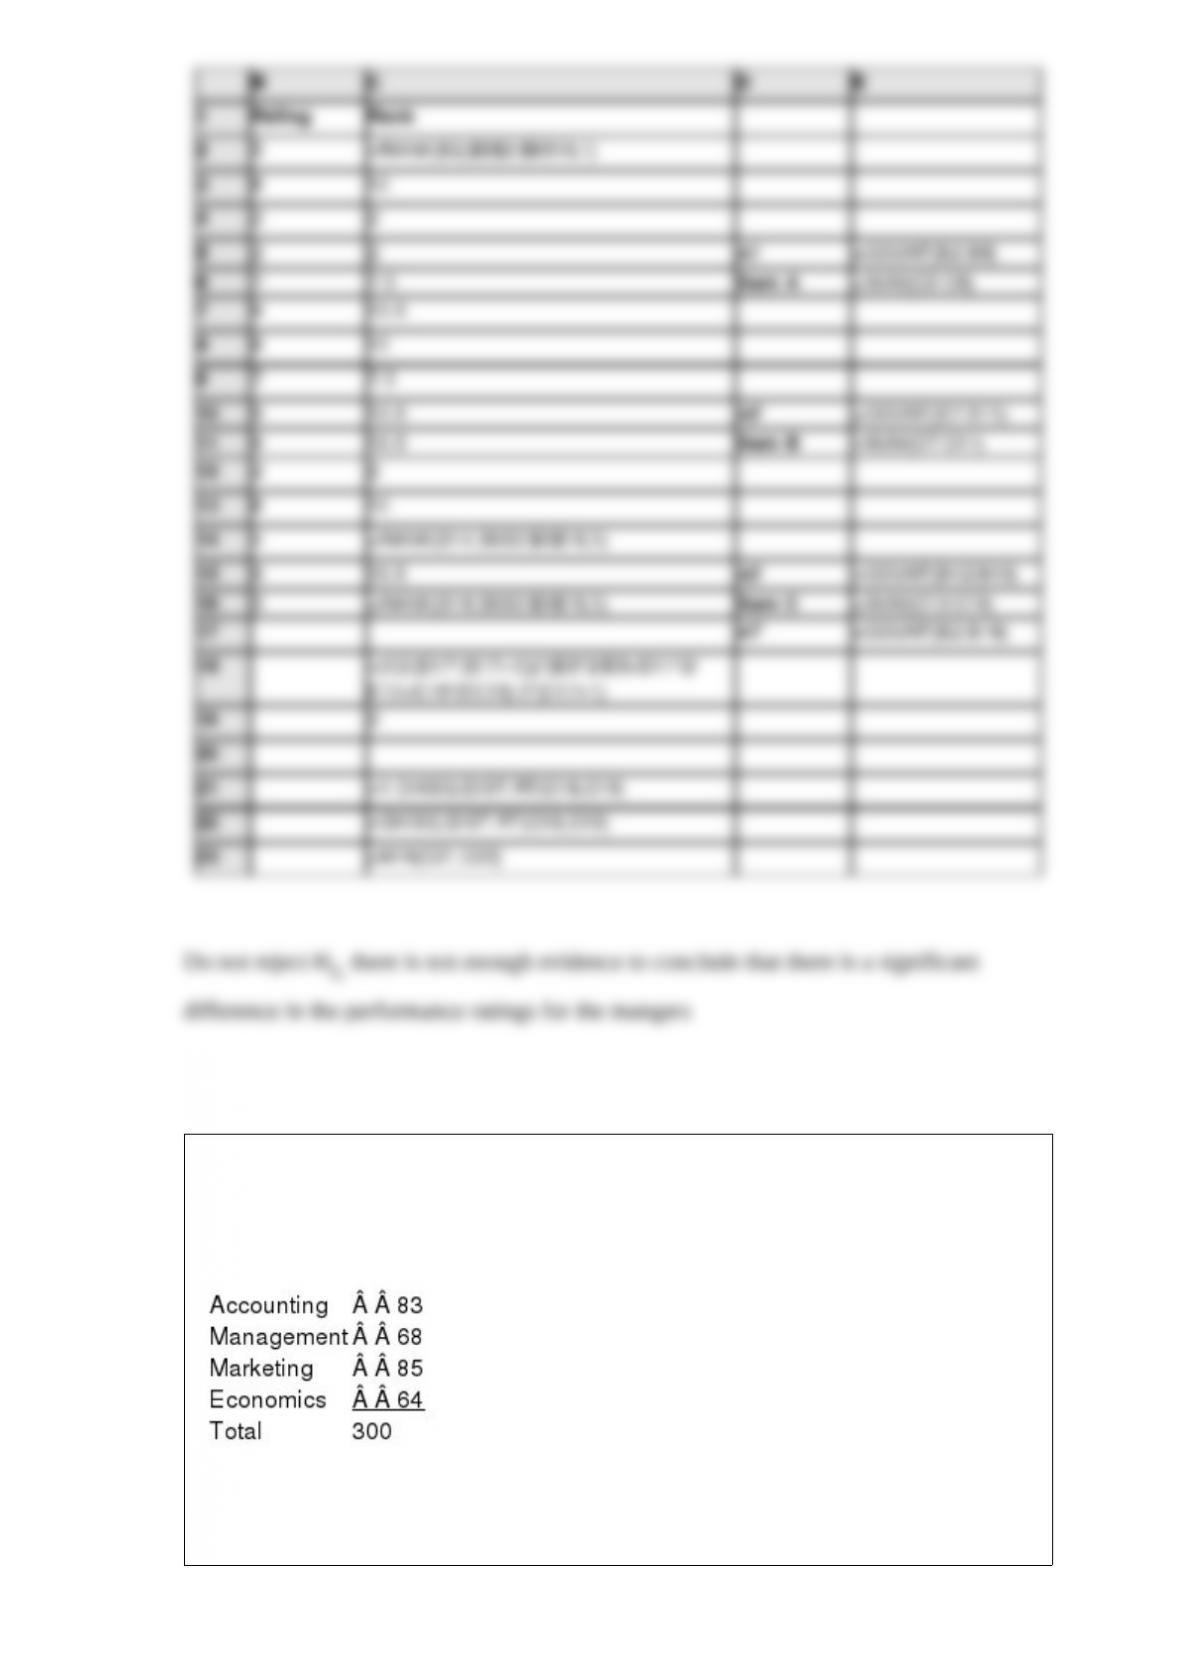
Three managers received the following performance ratings from a group of 15
employees.
Use Excel to perform the appropriate test at = .05 to determine whether there is a
significant difference in the performance ratings for the mangers.
Last school year, in the school of Business Administration, 30% were Accounting
majors, 24% Management majors, 26% Marketing majors, and 20% Economics majors.
A sample of 300 students taken from this year’s students of the school showed the
following number of students in each major:
Has there been any significant change in the number of students in each major between
the last school year and this school year? Use = 0.05.
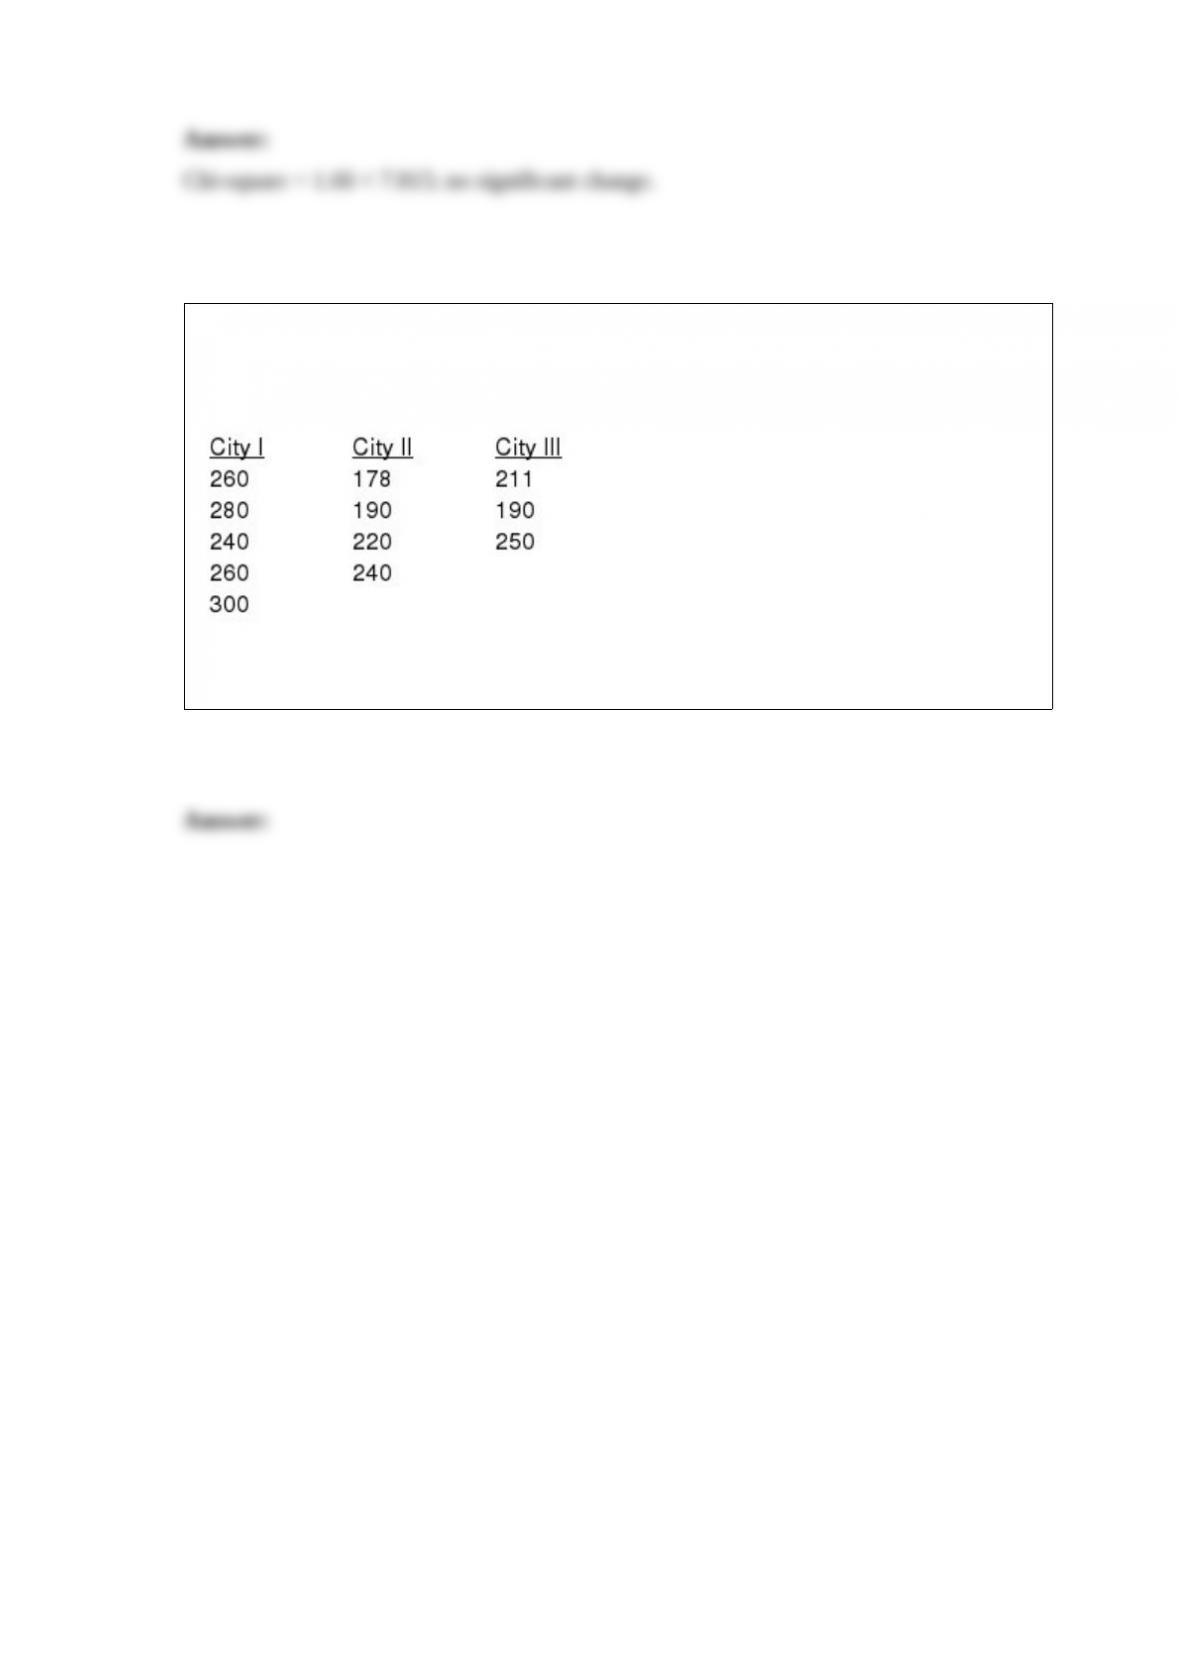
Random samples of individuals from three different cities were asked how much time
they spend per day watching television. The results (in minutes) for the three groups are
shown below.
At = 0.05, use Excel to test to see if there is a significant difference in the averages of
the three groups.
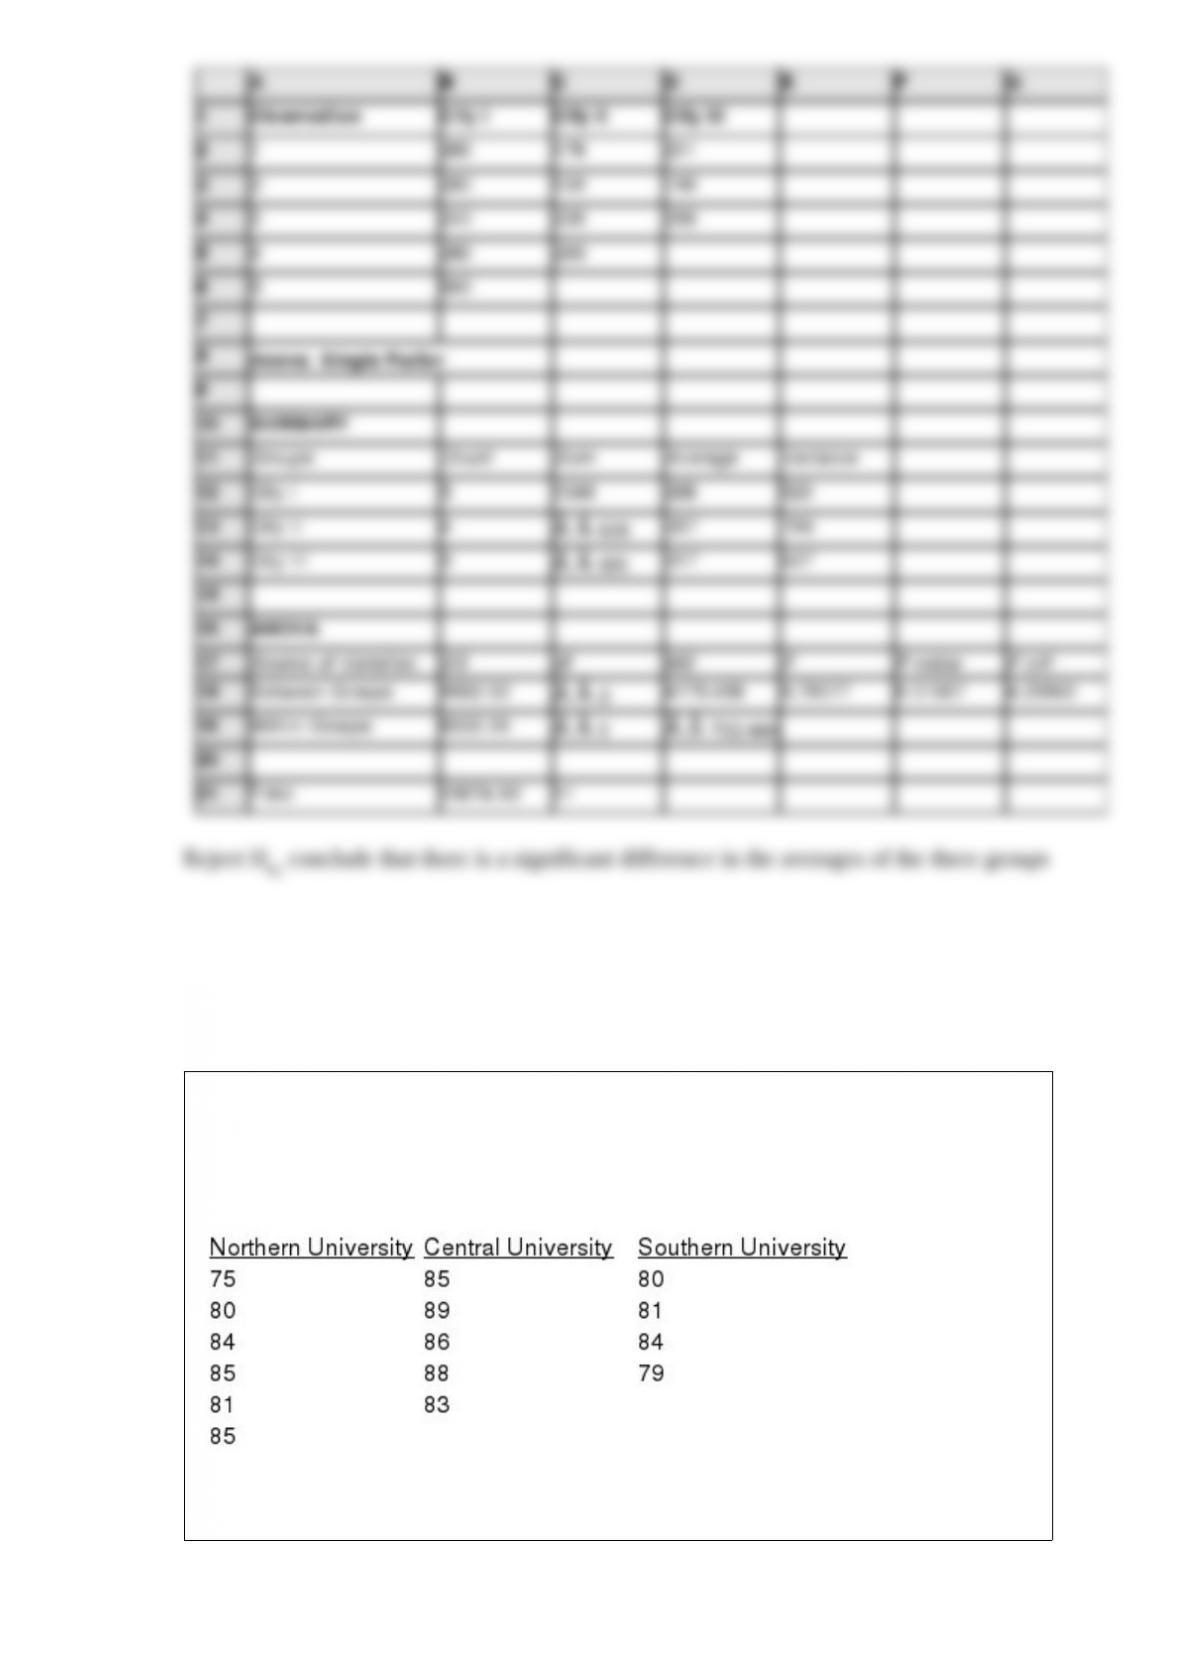
Three universities in your state decided to administer the same comprehensive
examination to the recipients of MBA degrees from the three institutions. From each
institution, MBA recipients were randomly selected and were given the test. The
following table shows the scores of the students from each university.
At = 0.01, test to see if there is any significant difference in the average scores of the
students from the three universities. (Note that the sample sizes are not equal.)
For inventory purposes, a grocery store manager wants to estimate the mean number of
pounds of cat food sold per month. The estimate is desired to be within 10 pounds with
a 95% level of confidence. A pilot study provided a standard deviation of 27.6 pounds.
How many months should be sampled?
Thirty-five percent of the students who enroll in a statistics course go to the statistics
laboratory on a regular basis. Past data indicates that 40% of those students who use the
lab on a regular basis make a grade of B or better. On the other hand, 10% of students
who do not go to the lab on a regular basis make a grade of B or better. If a particular
student made an A, determine the probability that she or he used the lab on a regular
basis.
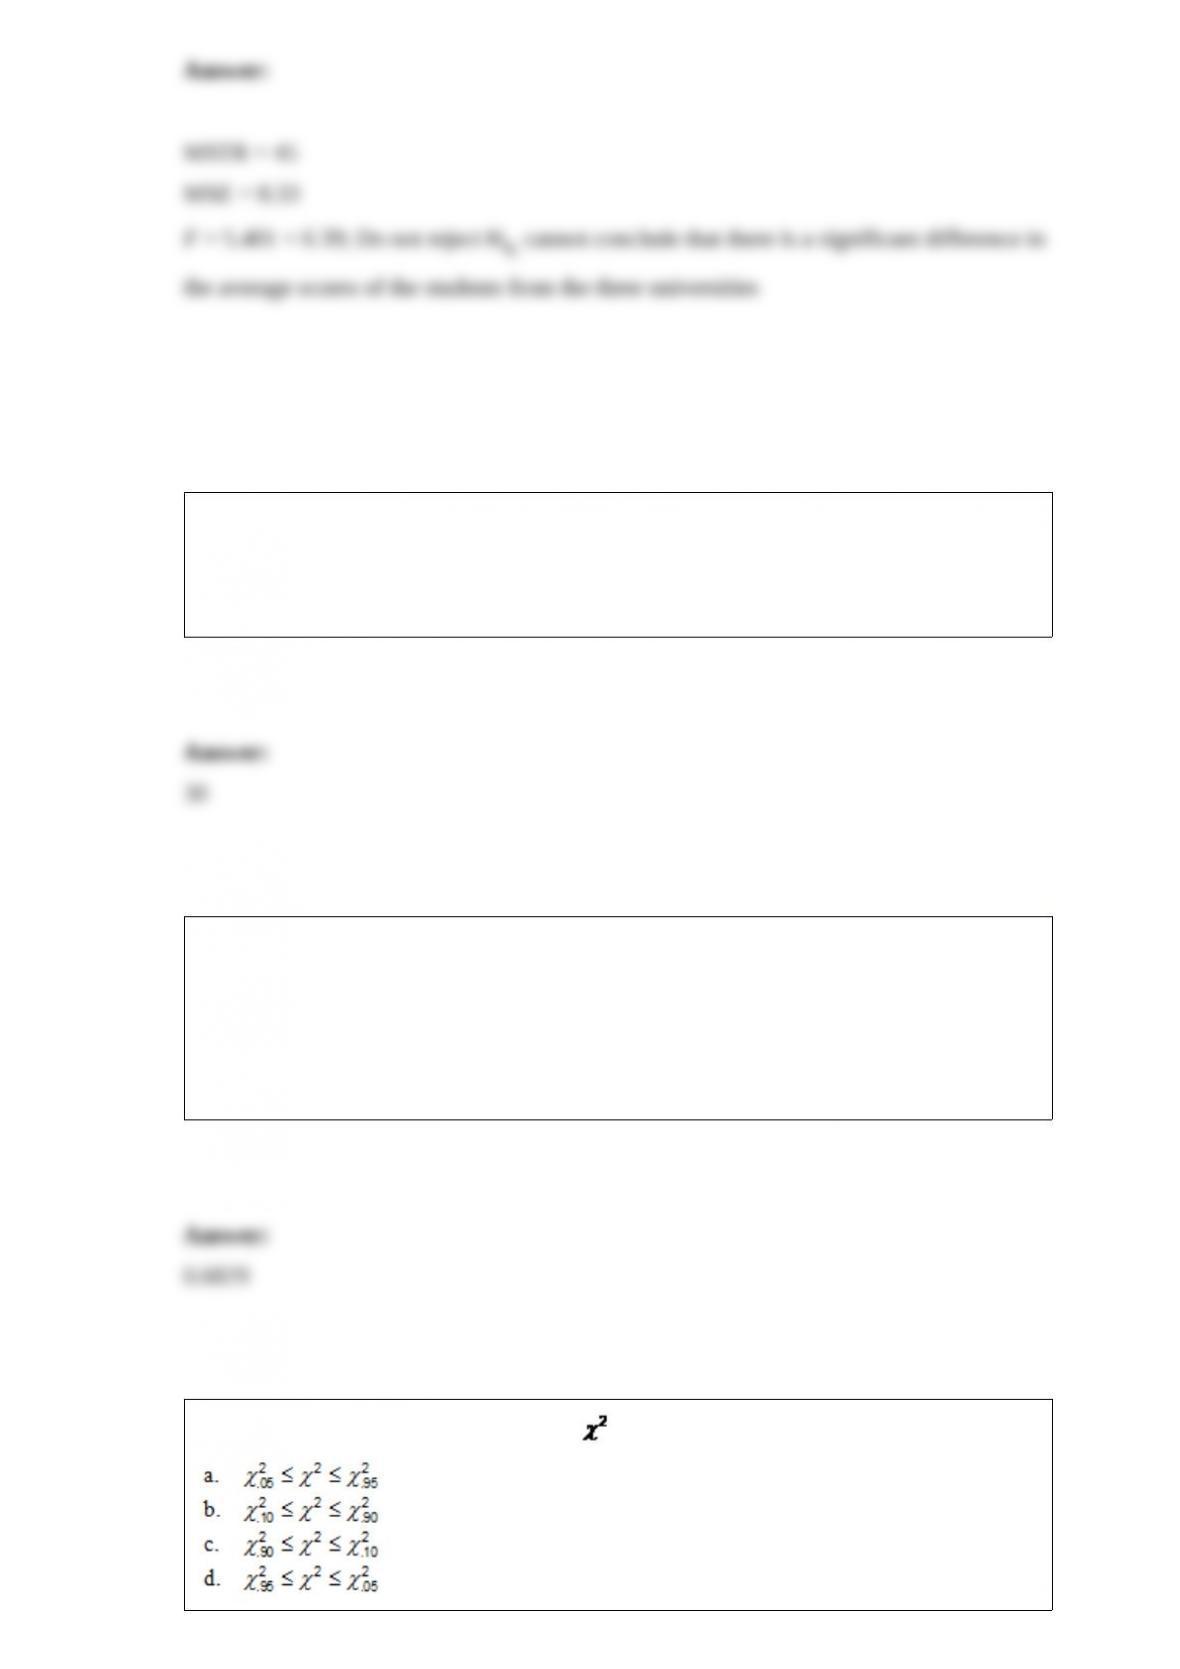
There is a .90 probability of obtaining a value such that
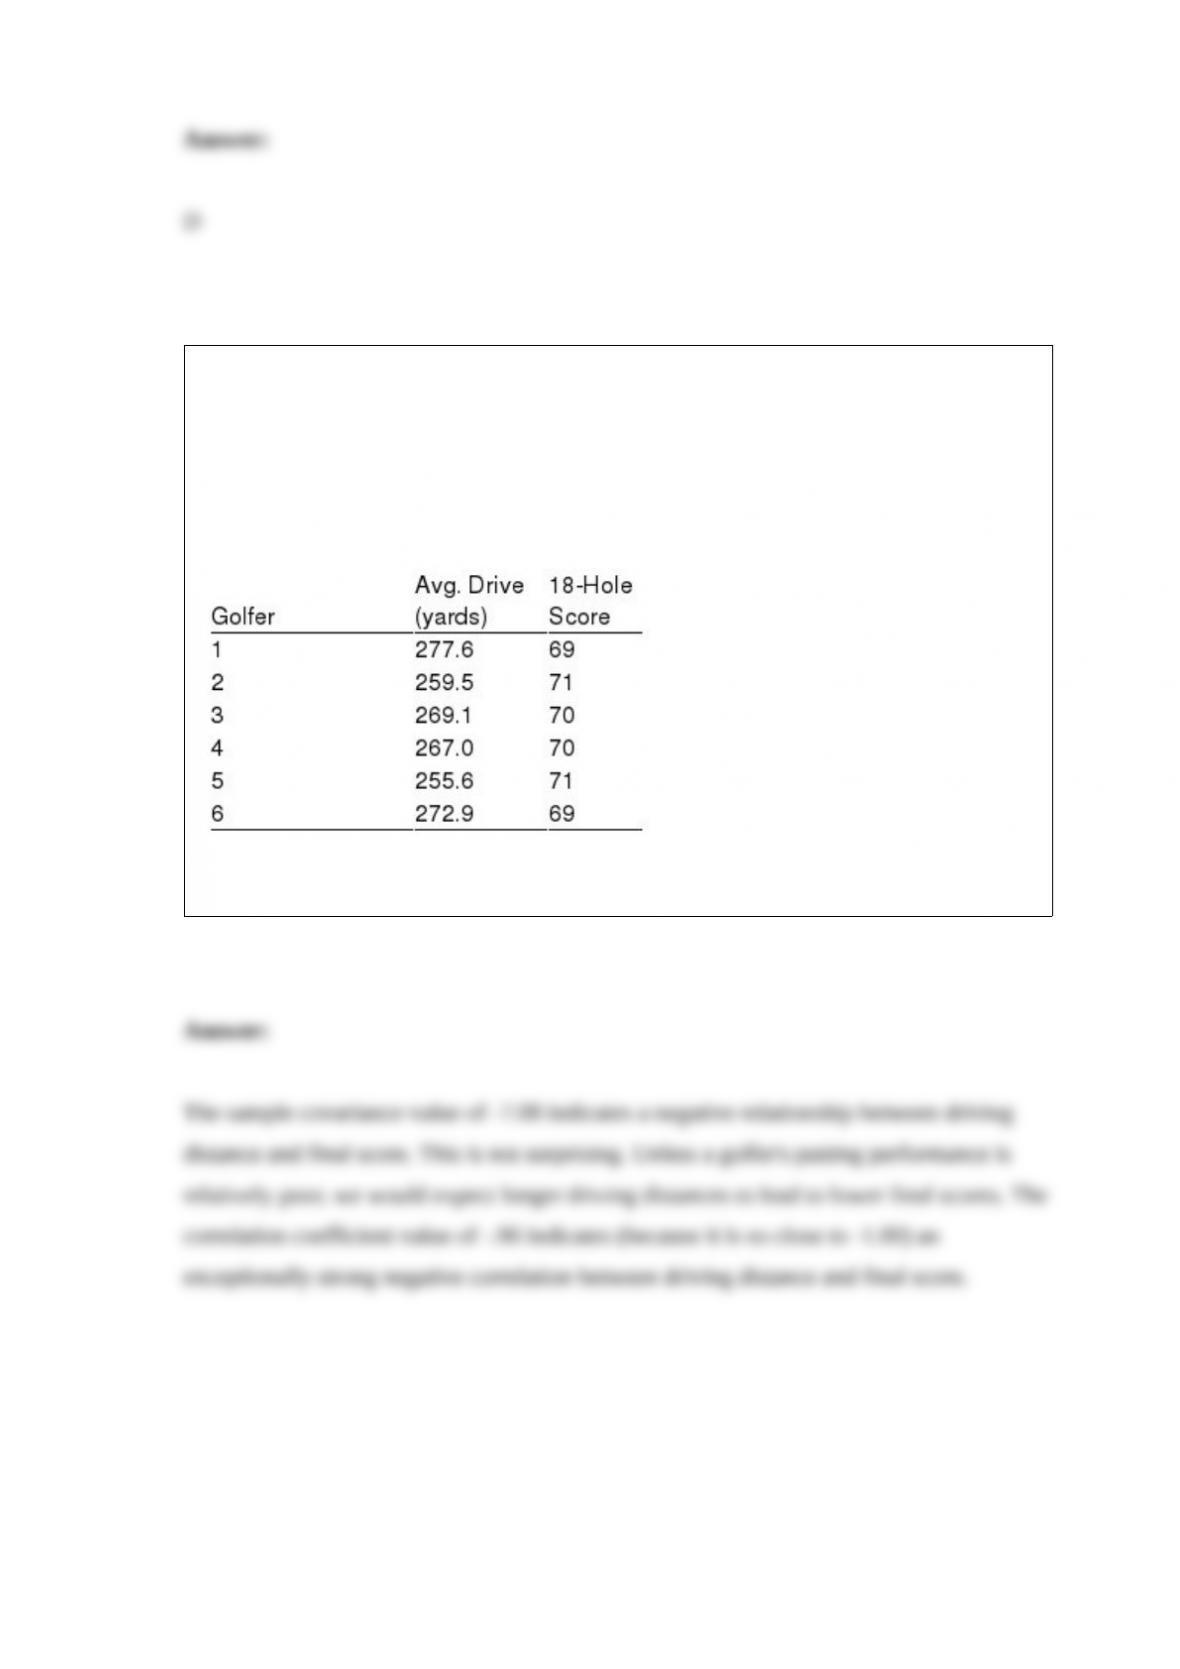
Angela Lopez, a golf instructor, is interested in investigating the relationship between a
golfer’s average driving distance and 18-hole score. She recently observed the
performance of six golfers during one round of a tournament and measured, as
accurately as possible, the distances (yards) of their drives and noted their final scores.
She then computed each golfer’s average drive distance for 18 holes. The results of her
sample are shown below.
Compute and interpret both the sample covariance and the sample correlation
coefficient.