A regression model involving 8 independent variables for a sample of 69 periods
resulted in the following sum of squares.
SSE = 306
SST = 1800
The 75th percentile is also the
a. first quartile
b. second quartile
c. third quartile
d. fourth quartile
Which of the following is(are) required condition(s) for a discrete probability function?
a. f(x) 0
b. f(x) 1 for all values of x
c. f(x) 0
d. None of the answers is correct.

In a southern state, it was revealed that 5% of all automobiles in the state did not pass
inspection. Of the next ten automobiles entering the inspection station,
a. what is the probability that none will pass inspection?
b. what is the probability that all will pass inspection?
c. what is the probability that exactly two will not pass inspection?
d. what is the probability that more than three will not pass inspection?
e. what is the probability that fewer than two will not pass inspection?
f. Find the expected number of automobiles not passing inspection.
g. Determine the standard deviation for the number of cars not passing inspection.
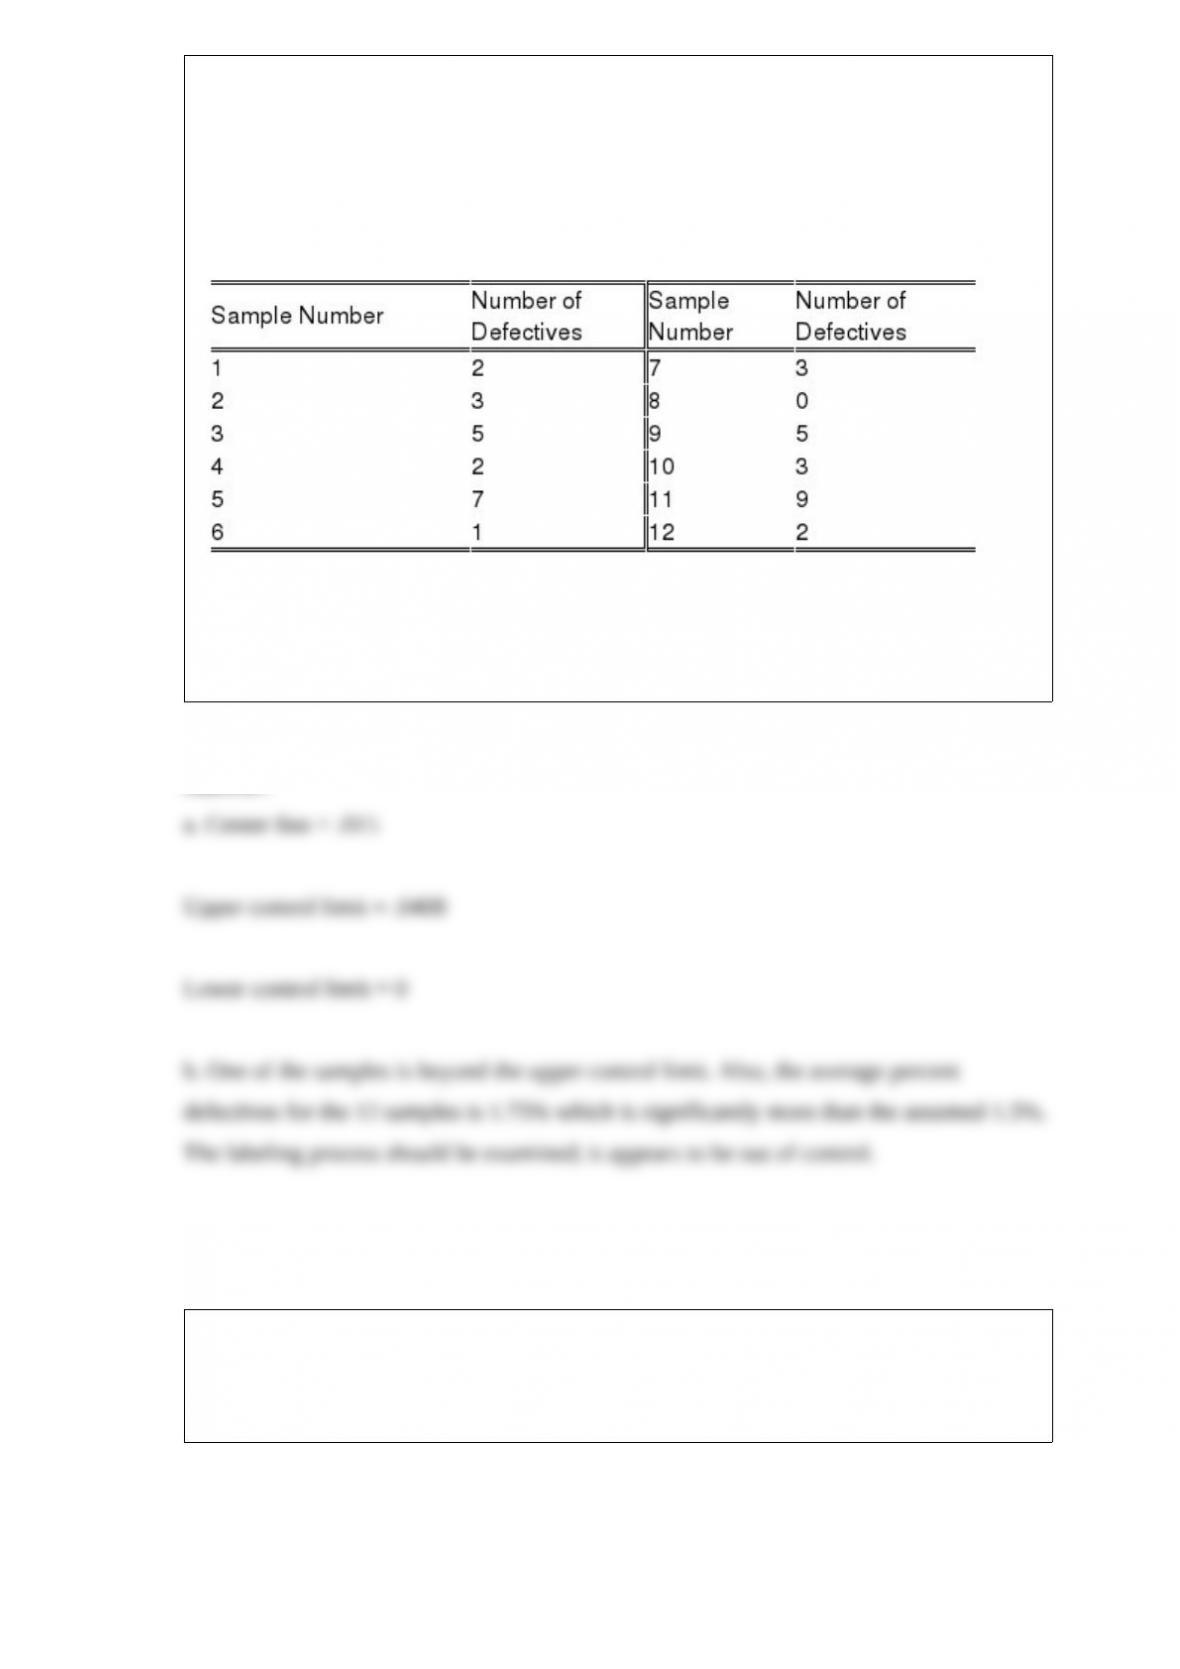
Jane Hotchkiss, director of production at the center, has decided to record the number of
defective labels in random daily samples on control charts. Jane estimates that 1.5
percent loose labels is typical when the labeling process is in control.
Twelve daily samples, each consisting of 200 pairs of jeans, were selected and
examined. The number of defective labels found in each sample is shown below.
a. Determine the center line and the 3 control limits for the p chart.
b. Decide if the labeling operation is in control.
Below you are given a partial ANOVA table relating the price of a company’s stock (y
in dollars), the Dow Jones industrial average (x1), and the stock price of the company’s
major competitor (x2 in dollars).
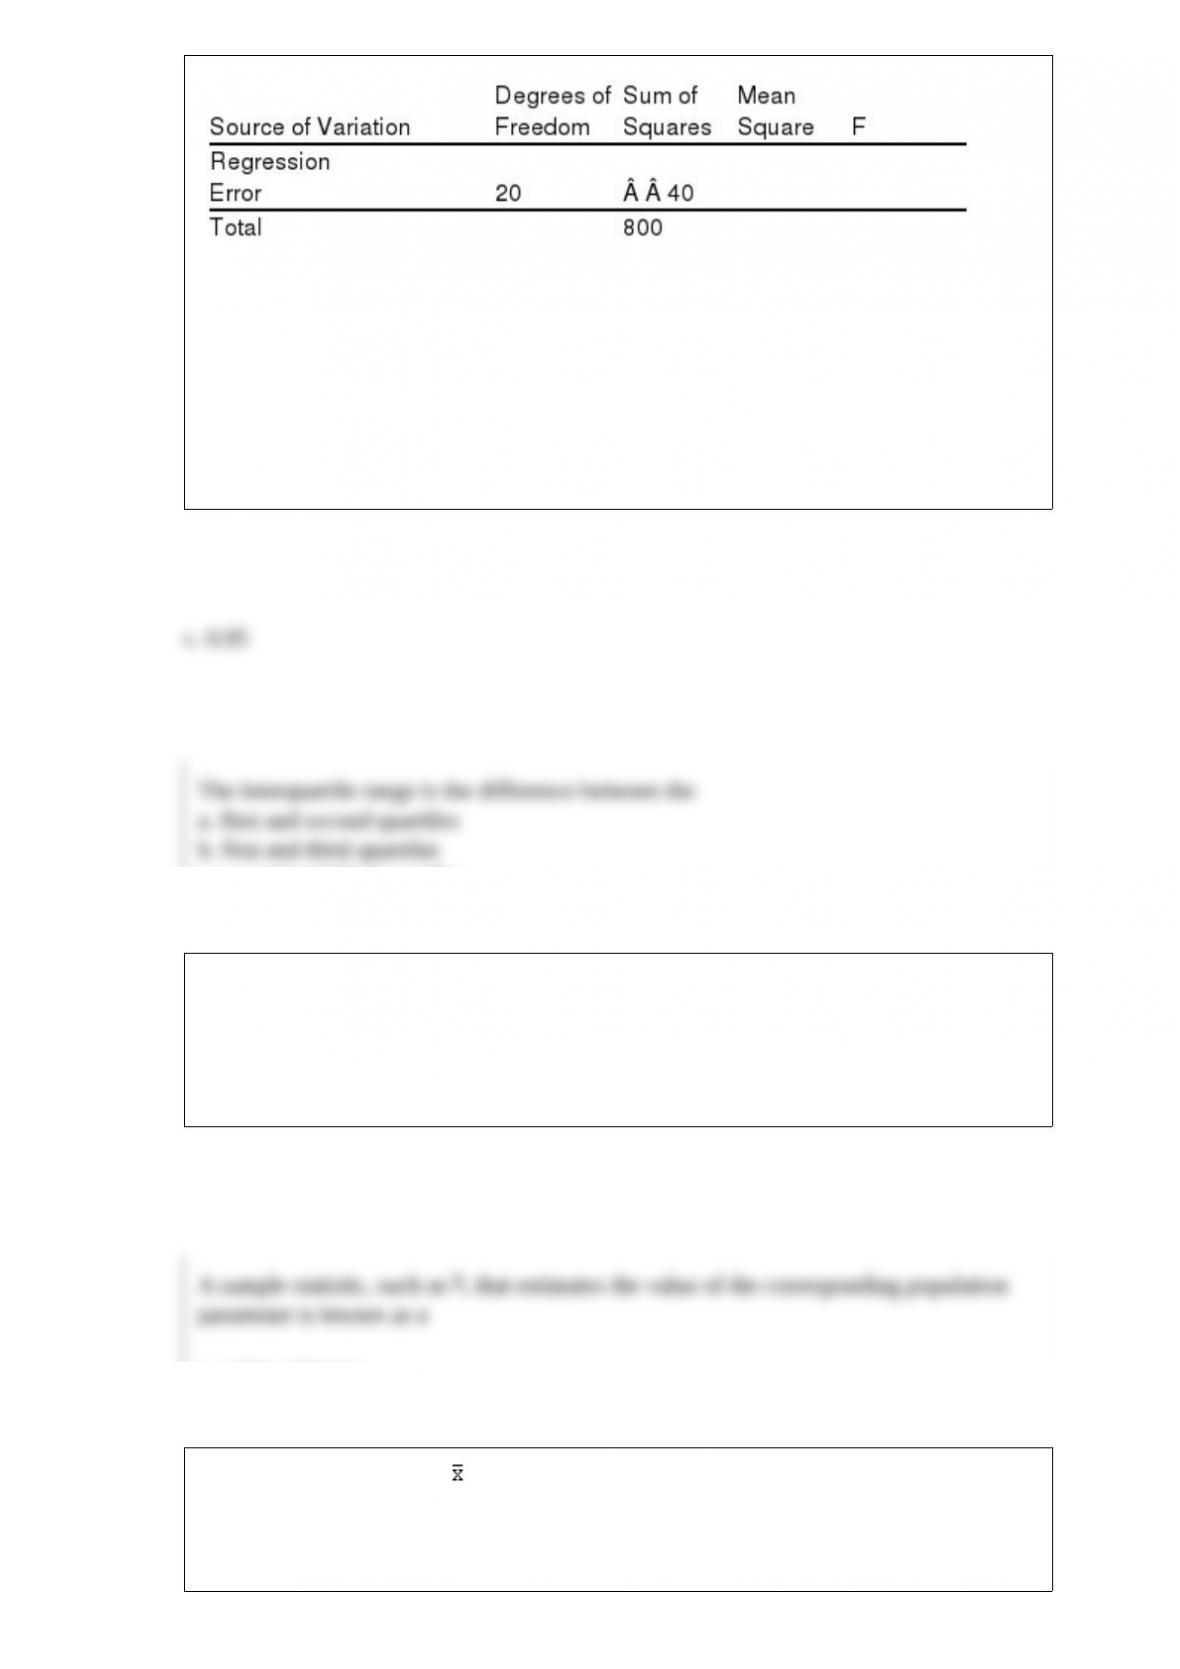
a. What has been the sample size for this regression analysis?
b. At = 0.05 level of significance, test to determine if the model is significant. That is,
determine if there exists a significant relationship between the independent variables
and the dependent variable.
c. Determine the multiple coefficient of determination.
The interquartile range is the difference between the
a. first and second quartiles
b. first and third quartiles
c. second and third quartiles
d. second and fourth quartiles
A sample statistic, such as , that estimates the value of the corresponding population
parameter is known as a
a. point estimator

b. parameter
c. population parameter
d. Both a parameter and a population parameter are correct.
A bank manager wishes to estimate the average waiting time for customers in line for
tellers. A random sample of 50 times is measured and the average waiting time is 5.7
minutes. The population standard deviation of waiting time is 2 minutes. Which Excel
function would be used to construct a confidence interval estimate?
a. CONFIDENCE.NORM
b. NORM.INV
c. T.INV
d. INT
The difference between the observed value of the dependent variable and the value
predicted by using the estimated regression equation is the
a. standard error
b. residual
c. predicted interval
d. variance
Exhibit 6-3
The weight of football players is normally distributed with a mean of 200 pounds and a
standard deviation of 25 pounds.
Refer to Exhibit 6-3. What percent of players weigh between 180 and 220 pounds?
a. 34.13%
b. 68.26%
c. 0.3413%
d. None of the alternative answers is correct.
A population has a mean of 180 and a standard deviation of 24. A sample of 64
observations will be taken. The probability that the mean from that sample will be
between 183 and 186 is
a. 0.1359
b. 0.8185
c. 0.3413
d. 0.4772
An experiment consists of three steps. There are four possible results on the first step,
three possible results on the second step, and two possible results on the third step. The
total number of experimental outcomes is
a. 9
b. 14
c. 24
d. 36
The number of random samples (without replacement) of size 3 that can be drawn from
a population of size 5 is
a. 15
b. 10
c. 20
d. 125
For a two-tailed test with a sample size of 40, the null hypothesis will not be rejected at

a 5% level of significance if the test statistic is
a. between -1.96 and 1.96, exclusively
b. greater than 1.96
c. less than 1.645
d. greater than -1.645
Events that have no sample points in common are
a. independent events
b. posterior events
c. mutually exclusive events
d. complements
When the data have the properties of interval data and the ratio of two values is
meaningful, the variable has which scale of measurement?
a. nominal
b. ordinal
c. interval
d. ratio

If there is a very strong correlation between two variables, then the coefficient of
correlation must be
a. much larger than 1, if the correlation is positive
b. much smaller than 1, if the correlation is negative
c. either much larger than 1 or much smaller than 1
d. None of these answers is correct.
Exhibit 6-5
The weight of items produced by a machine is normally distributed with a mean of 8
ounces and a standard deviation of 2 ounces.
Refer to Exhibit 6-5. What percentage of items will weigh at least 11.7 ounces?
a. 46.78%
b. 96.78%
c. 3.22%
d. 53.22%
The variance for the binomial probability distribution is
a. Var(x) p(1 p)
b. Var(x) np
c. Var(x) n(1 p)
d. Var(x) np(1 p)
A(n) __________ is a graphical representation in which the sample space is represented
by a rectangle and events are represented as circles.
a. frequency polygon
b. histogram
c. Venn diagram
d. tree diagram
Z is a standard normal random variable. Compute the following probabilities.
a. P(-1.33 z 1.67)
b. P(1.23 z 1.55)
c. P(z 2.32)
d. P(z -2.08)
e. P(z -1.08)