
It is known that the population variance equals 484. With a 0.95 probability, the sample
size that needs to be taken to estimate the population mean if the desired margin of error
is 5 or less is
a. 25
b. 74
c. 189
d. 75
When ranking combined data in a Wilcoxon signed rank test, the data that receives a
rank of 1 is the
a. lowest value
b. highest value
c. middle value
d. average of the highest and the lowest of values
Excel’s EXPON.DIST function can be used to compute
a. exponents
b. exponential probabilities
c. cumulative exponential probabilities

d. Both exponential probabilities and cumulative exponential probabilities are correct.
Doubling the size of the sample will
a. reduce the standard error of the mean to one-half its current value
b. reduce the standard error of the mean to approximately 70% of its current value
c. have no effect on the standard error of the mean
d. double the standard error of the mean
In order to test for the significance of a regression model involving 8 independent
variables and 121 observations, the numerator and denominator degrees of freedom
(respectively) for the critical value of F are
a. 8 and 121
b. 7 and 120
c. 8 and 112
d. 7 and 112
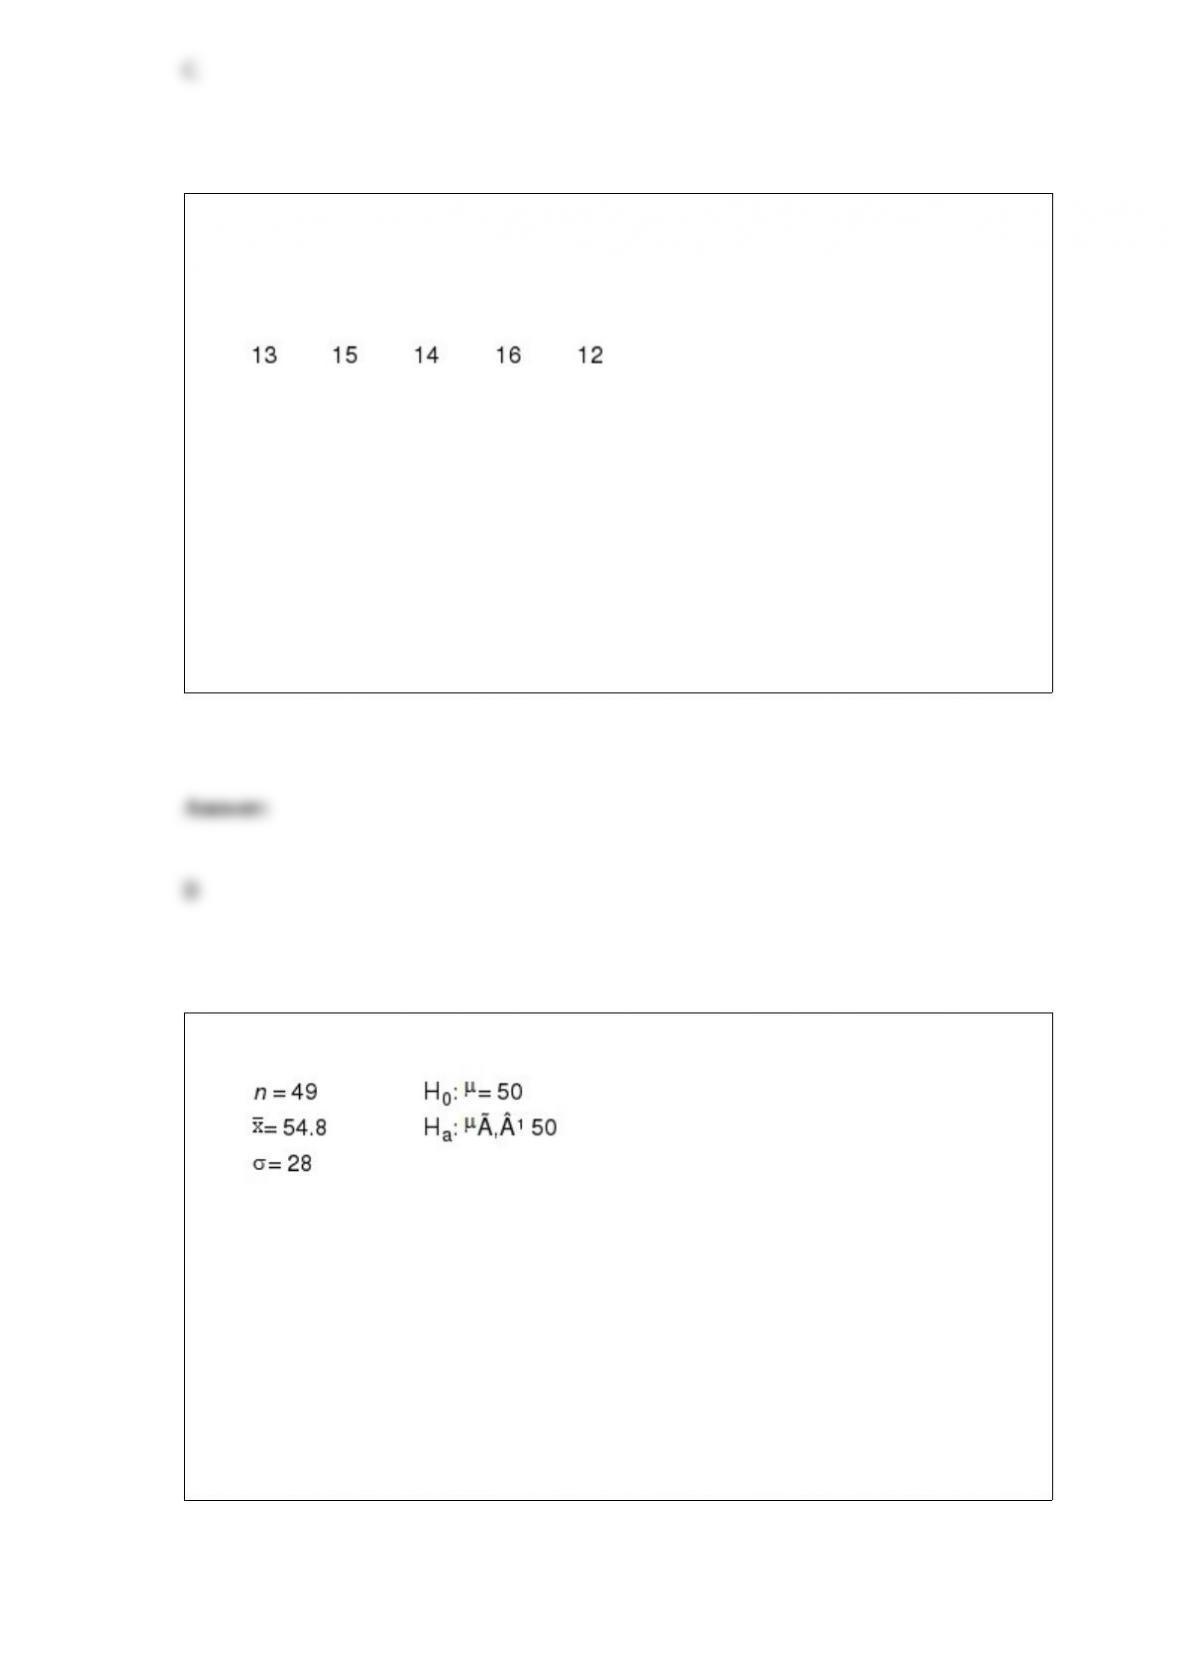
Exhibit 7-1
The following data was collected from a simple random sample from a process (an
infinite population).
Refer to Exhibit 7-1. The point estimate of the population standard deviation is
a. 2.500
b. 1.581
c. 2.000
d. 1.414
Exhibit 9-3
Refer to Exhibit 9-3. The test statistic equals
a. 0.1714
b. 0.3849
c. -1.2
d. 1.2

Exhibit 9-6
A random sample of 100 people was taken. Eighty of the people in the sample favored
Candidate A. We are interested in determining whether or not the proportion of the
population in favor of Candidate A is significantly more than 75%.
Refer to Exhibit 9-6. The p-value is
a. 0.2112
b. 0.05
c. 0.025
d. 0.0156
At a certain manufacturing plant, a machine produced ball bearings that should have a
diameter of 0.50 mm. If the machine produces ball bearings that are either too small or
too large, the ball bearings must be scrapped. Every hour, a quality control manager
takes a random sample of 30 ball bearings to test to see if the process is “out of control”
(i.e. to test to see if the average diameter differs from 0.50 mm).
a. State the hypotheses associated with the manager’s test.
b. Describe a Type I error for this situation.
c. Describe a Type II error for this situation.
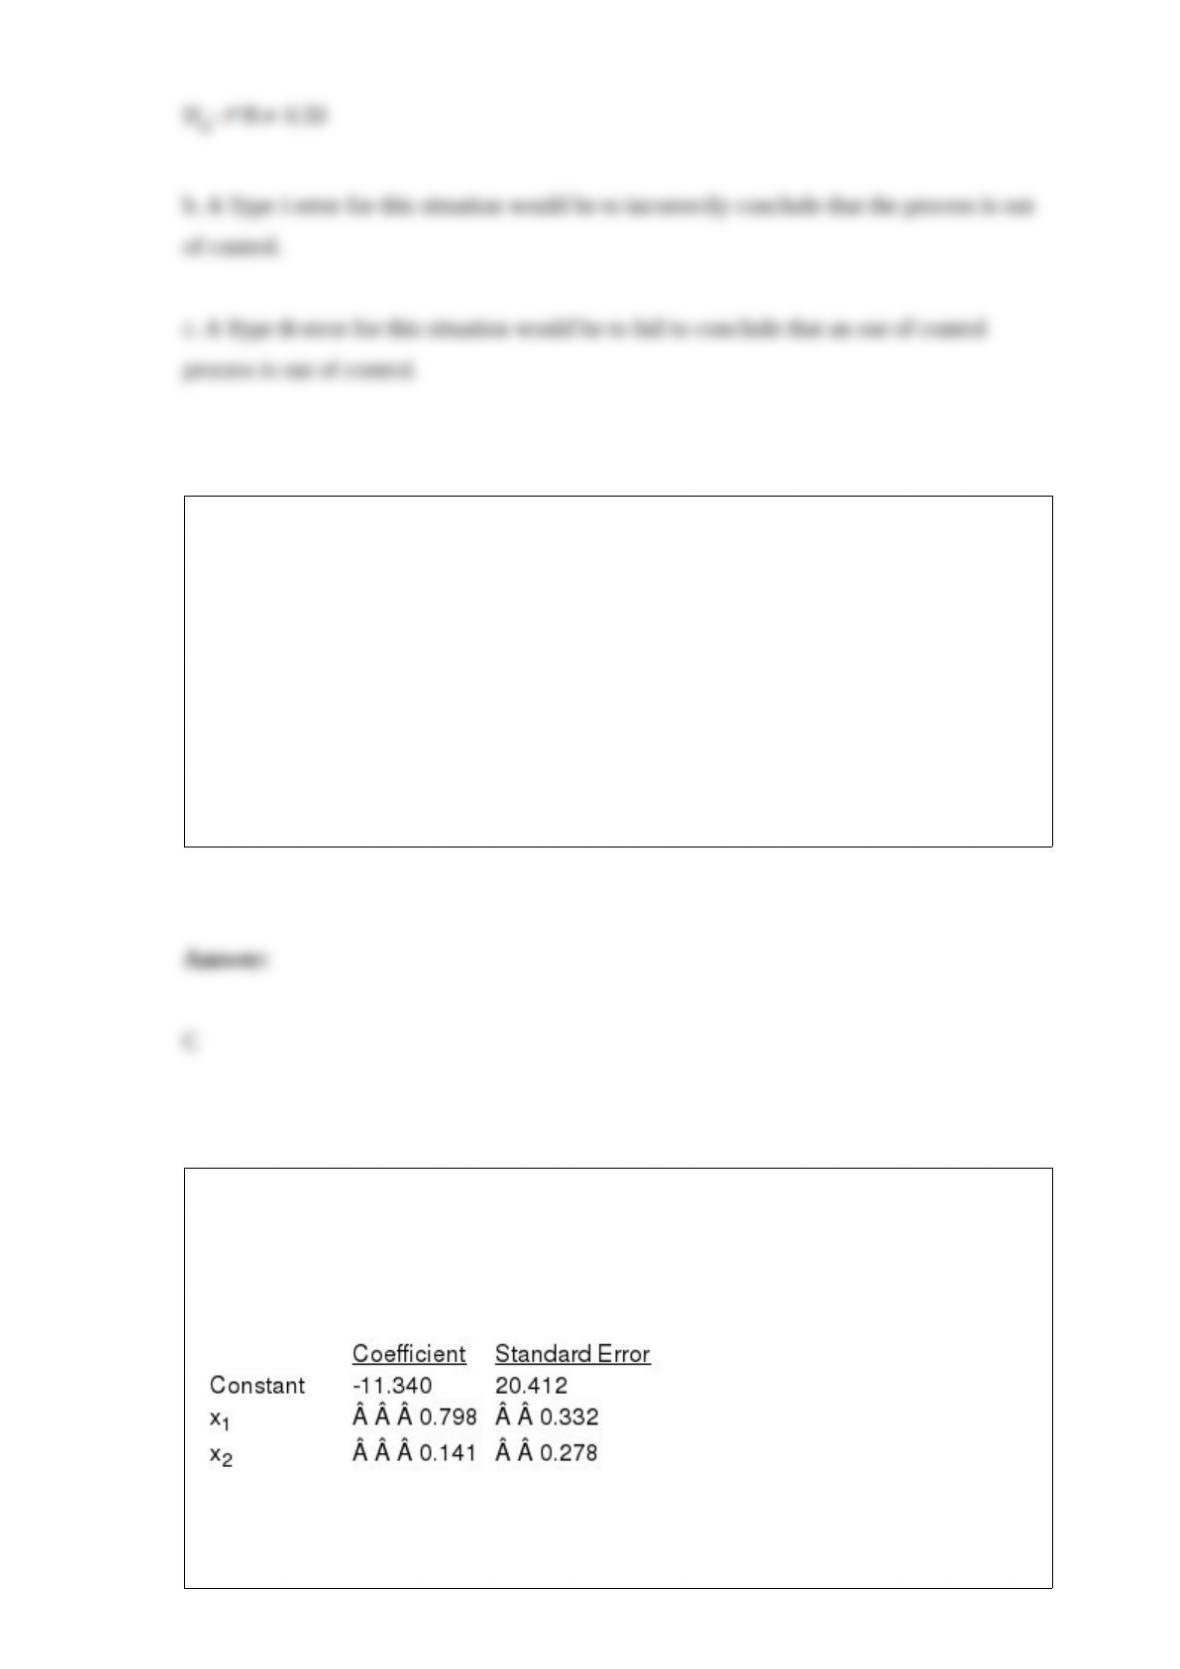
A regression model involved 5 independent variables and 126 observations. The critical
value of t for testing the significance of each of the independent variable’s coefficients
will have
a. 131 degrees of freedom
b. 125 degrees of freedom
c. 130 degrees of freedom
d. 4 degrees of freedom
The following is part of the results of a regression analysis involving sales (y in
millions of dollars), advertising expenditures (x1 in thousands of dollars), and number
of salespeople (x2) for a corporation. The regression was performed on a sample of 10
observations.
a. Write the regression equation.
b. Interpret the coefficients of the estimated regression equation found in Part (a).
c. At =0.05, test for the significance of the coefficient of advertising.
d. At =0.05, test for the significance of the coefficient of number of salespeople.
e. If the company uses $50,000 in advertisement and has 800 salespersons, what are the
expected sales? Give your answer in dollars.
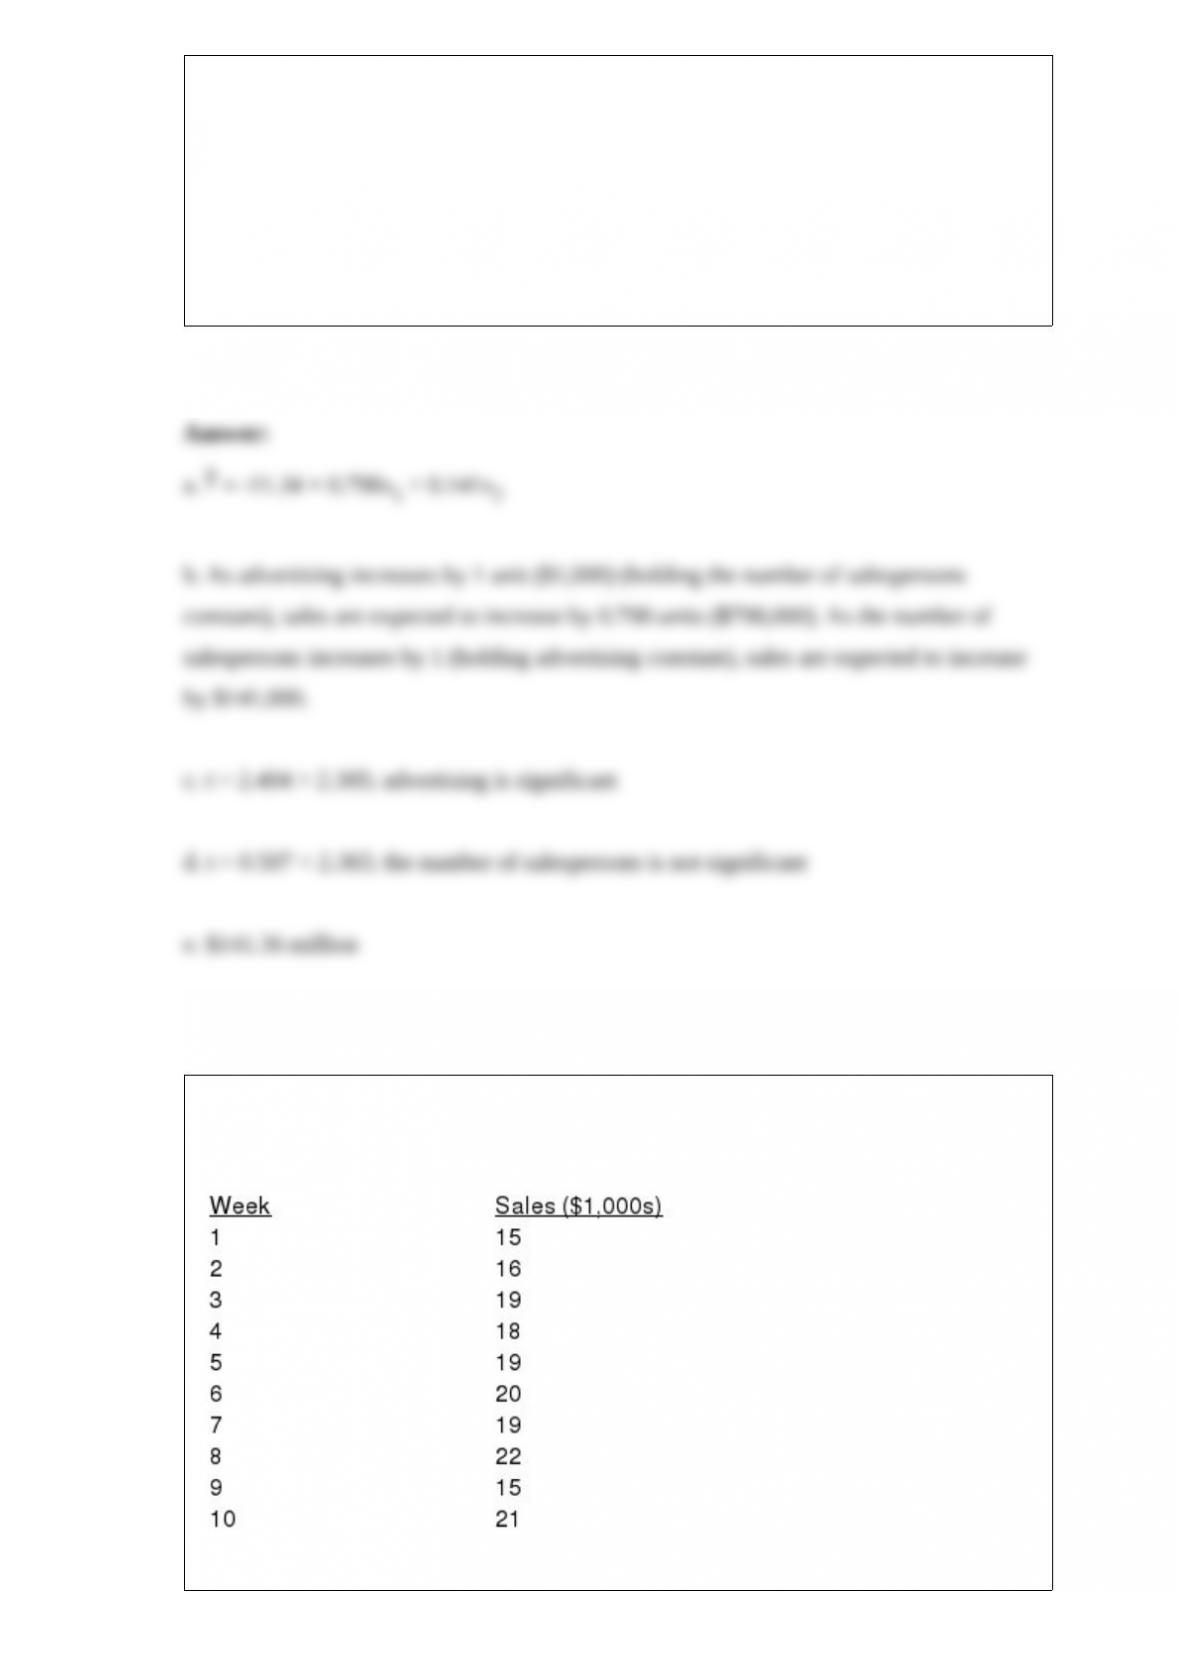
The following time series shows the sales of a clothing store over a 10-week period.
a. Compute a 4-week moving average for the above time series.
b. Compute the mean square error (MSE) for the 4-week moving average forecast.
c. Use = 0.3 to compute the exponential smoothing values for the time series.
d. Forecast sales for week 11.
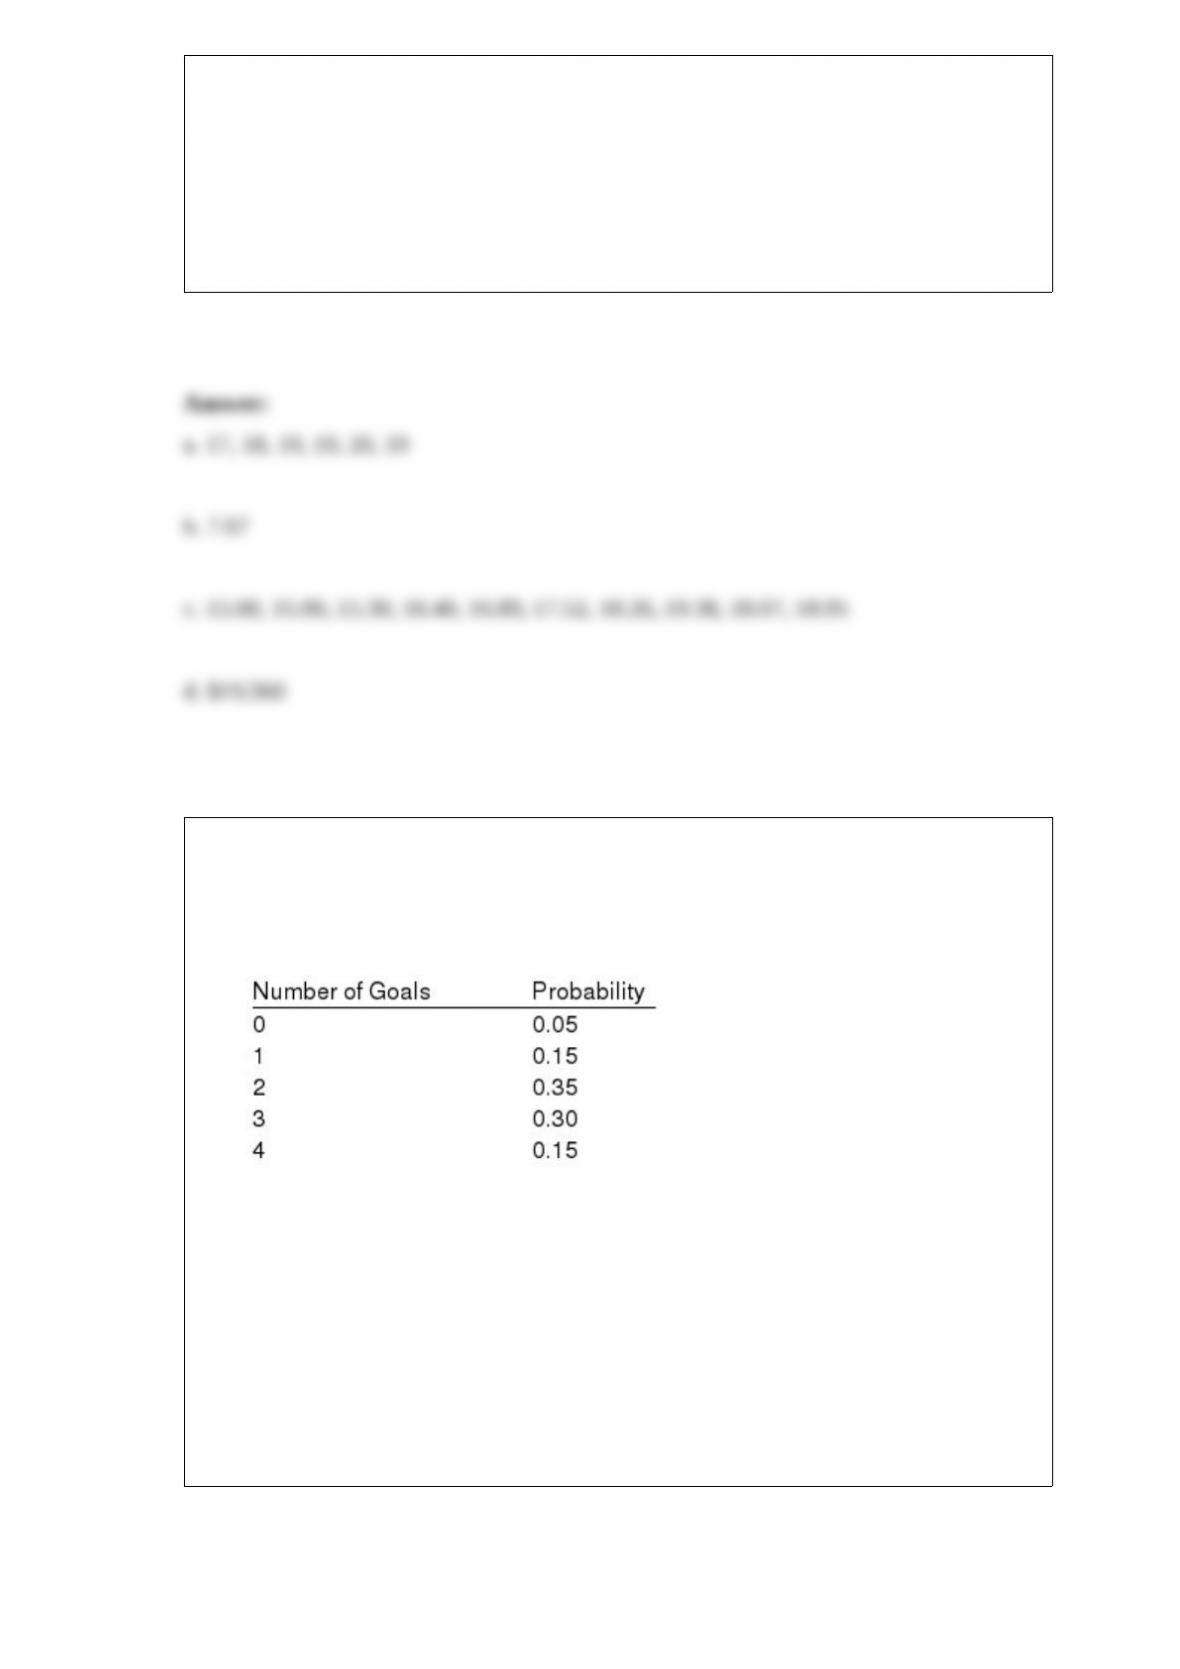
Exhibit 5-3
The probability distribution for the number of goals the Lions soccer team makes per
game is given below.
Refer to Exhibit 5-3. The expected number of goals per game is
a. 0
b. 1
c. 2
d. 2.35
The union of events A and B is the event containing
a. all the sample points common to both A and B
b. all the sample points belonging to A or B
c. all the sample points belonging to A or B or both
d. all the sample points belonging to A or B, but not both
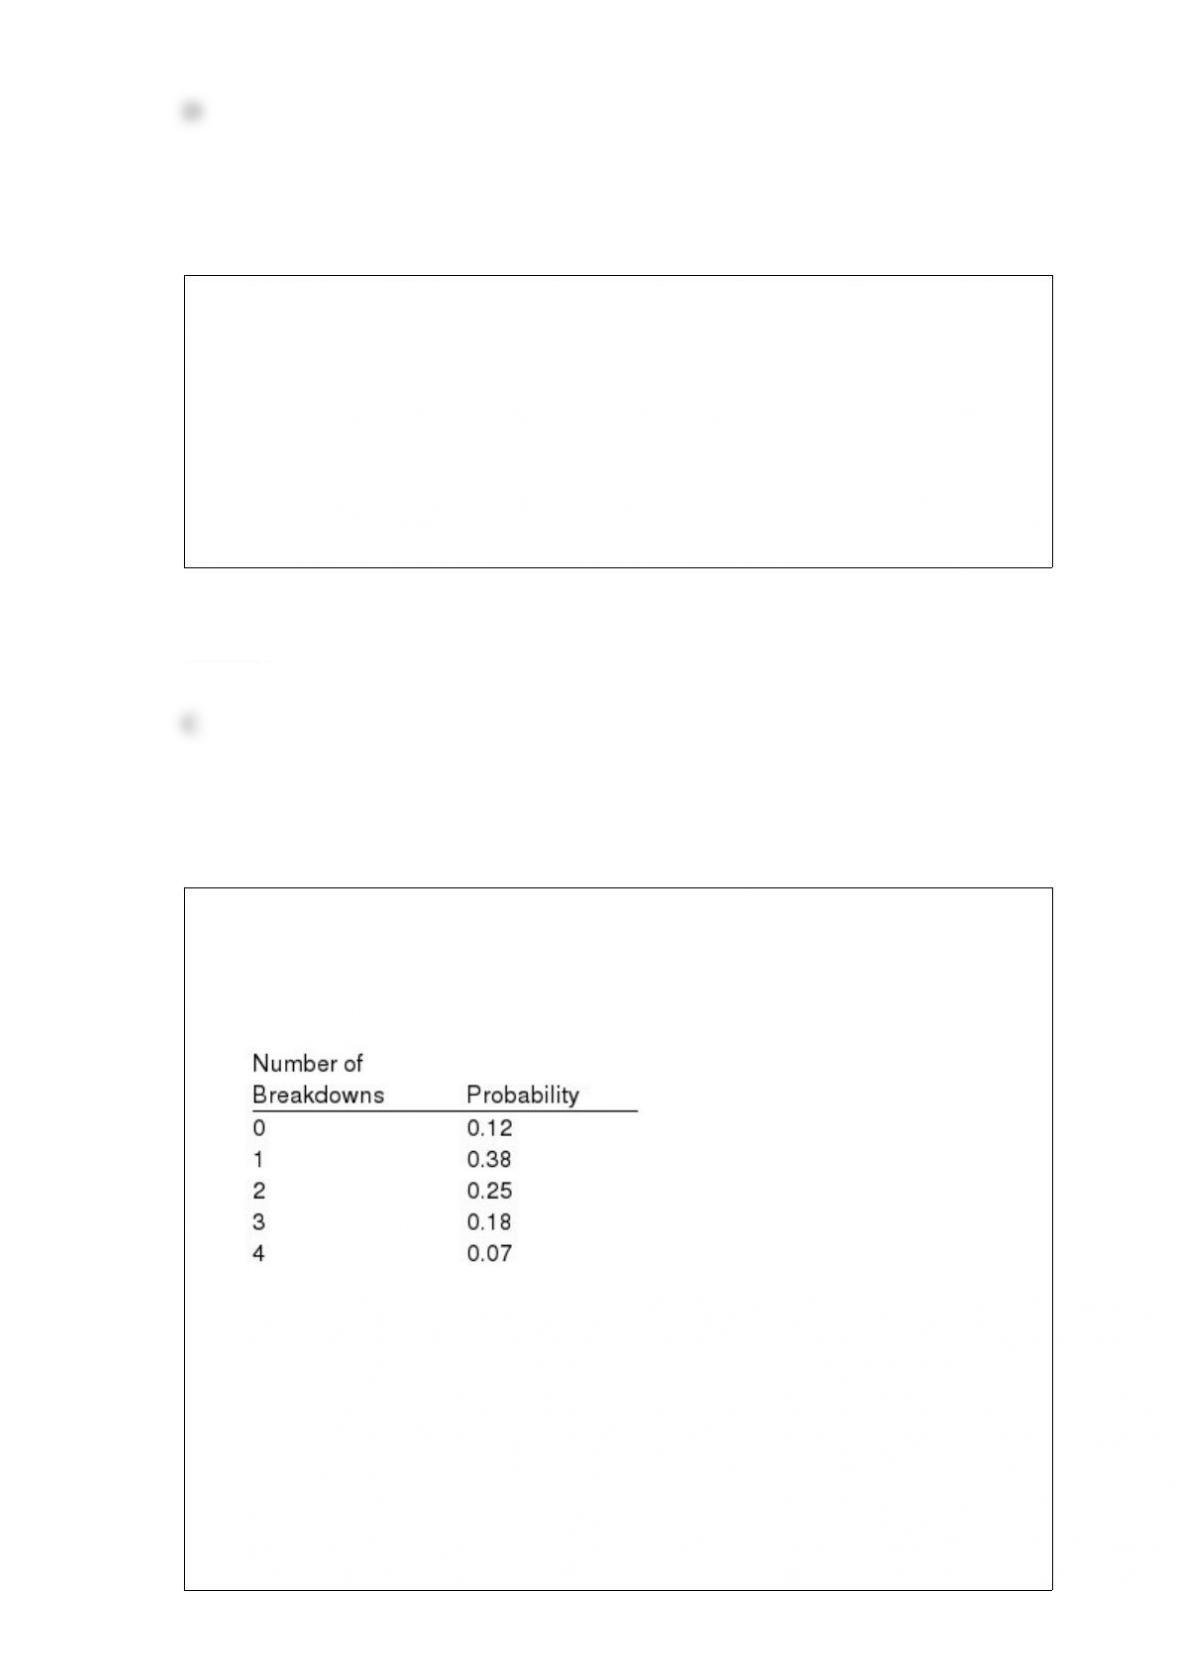
Exhibit 5-4
A local bottling company has determined the number of machine breakdowns per
month and their respective probabilities as shown below.
Refer to Exhibit 5-4. The expected number of machine breakdowns per month is
a. 2
b. 1.70
c. one
d. None of the alternative answers is correct.

As the sample size increases, the margin of error
a. increases
b. decreases
c. stays the same
d. None of the other answers are correct.
Construct a stem-and-leaf display for the following data. Specify the leaf unit for the
display.
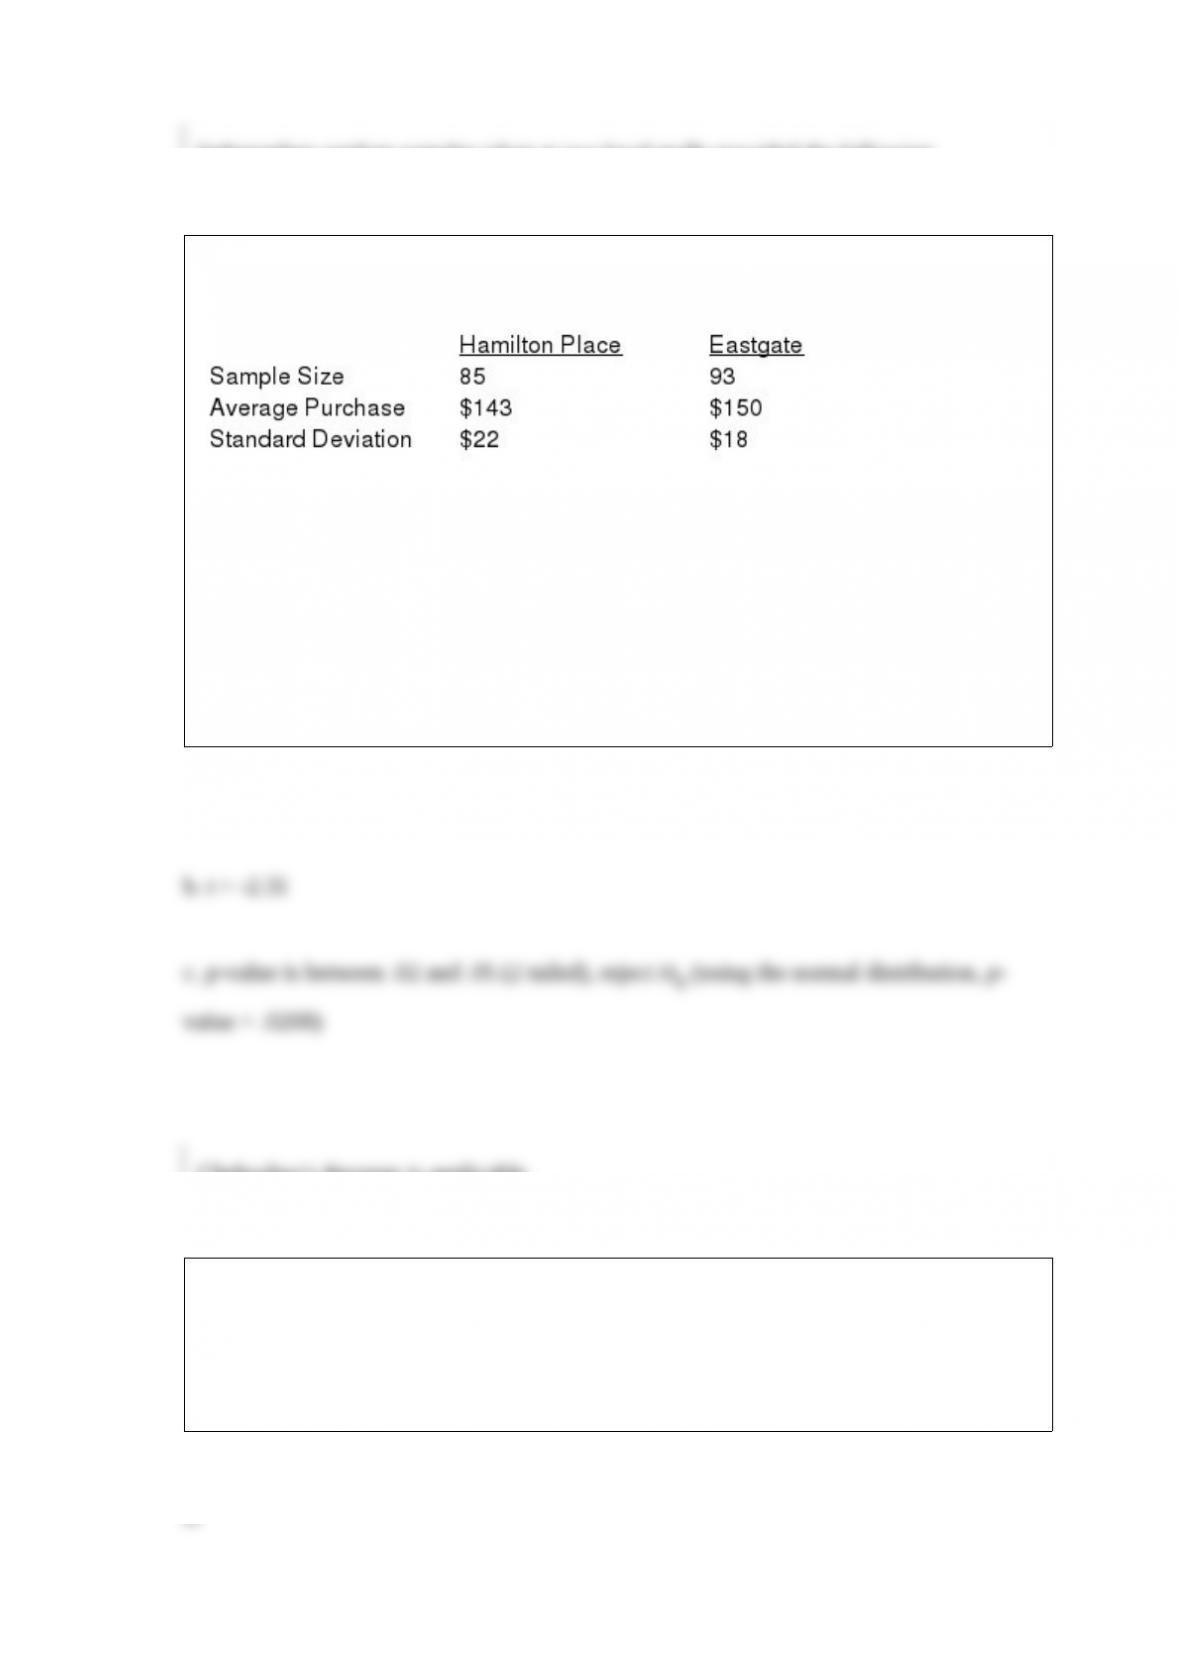
Independent random samples taken at two local malls provided the following
information regarding purchases by patrons of the two malls.
We want to determine whether or not there is a significant difference between the
average purchases by the patrons of the two malls.
a. Give the hypotheses for the above.
b. Compute the test statistic.
c. At 95% confidence, test the hypotheses.
Chebyshev’s theorem is applicable
a. only to large (n > 30) data sets
b. only to data sets with no outliers
c. only to bell-shaped data sets
d. to any data set

In general, higher confidence levels provide
a. wider confidence intervals
b. narrower confidence intervals
c. a smaller standard error
d. unbiased estimates