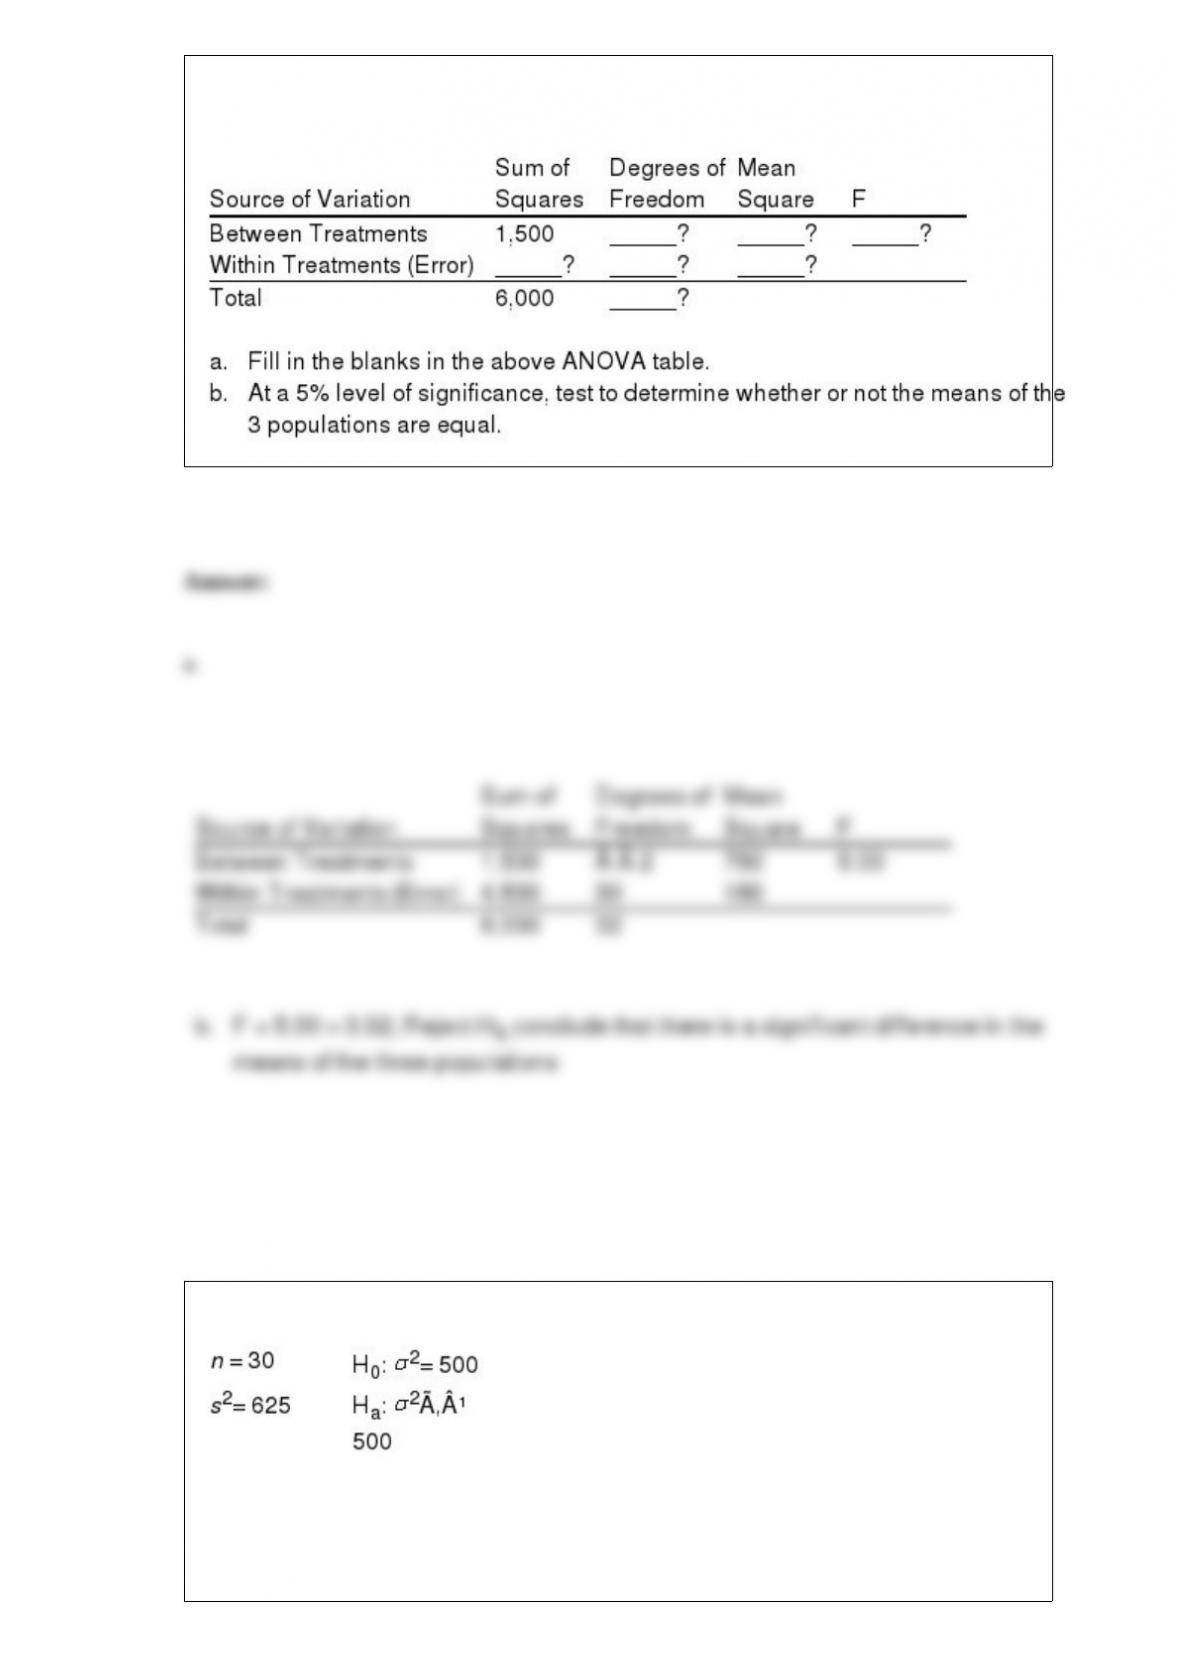
In a completely randomized experimental design, 11 experimental units were used for
each of the 3 treatments. Part of the ANOVA table is shown below.
Exhibit 11-4
Refer to Exhibit 11-4. The test statistic for this problem equals
a. 23.2
b. 24
c. 36.25
d. 37.5
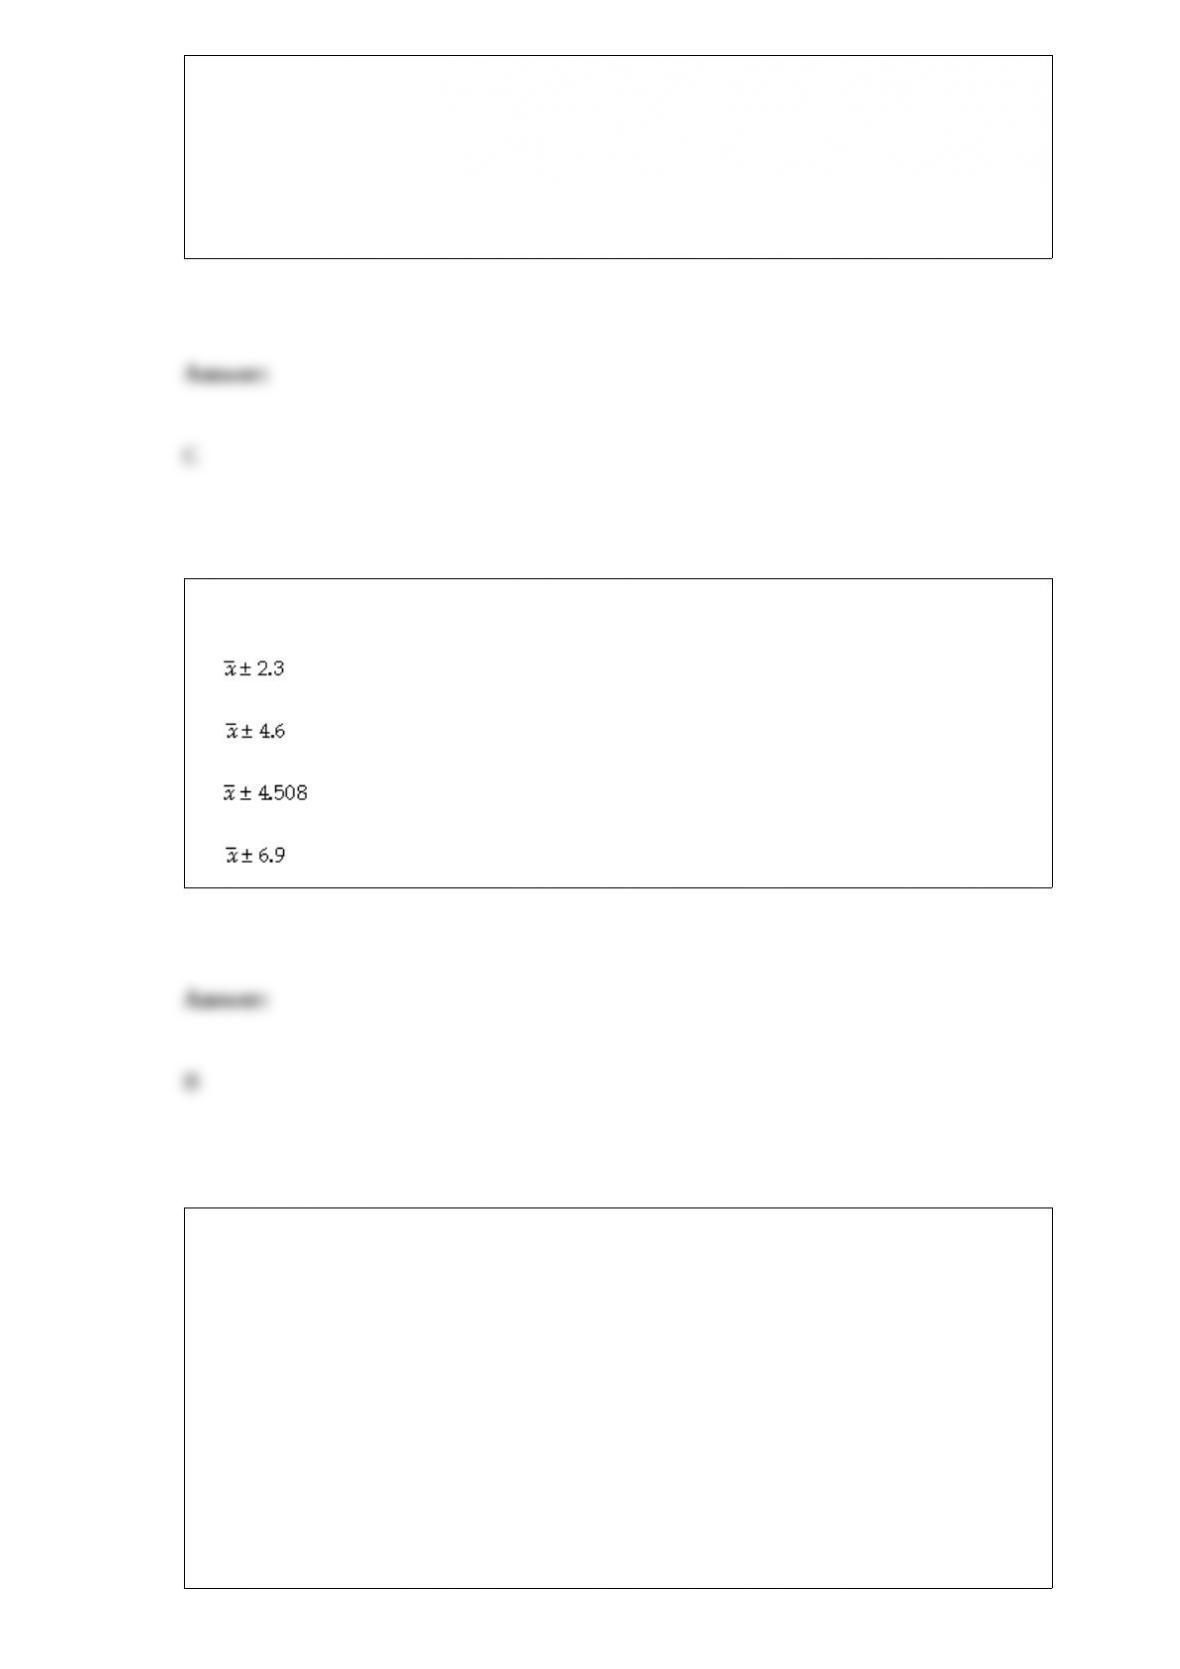
If the margin of error in an interval estimate of
is 4.6, the interval estimate equals
a.
b.
c.
d.
Exhibit 21-2
A simple random sample of 43 elements has been selected from a population of size
800. The sample mean is 500, and the sample standard deviation is 60.
Refer to Exhibit 21-2. The standard error of the mean is
a. 9.2
b. 43.0
c. 1.6
d. 8.9
X is a normally distributed random variable with a mean of 8 and a standard deviation
of 4. The probability that x is between 1.48 and 15.56 is
a. 0.0222
b. 0.4190
c. 0.5222
d. 0.9190
Candidate A is running for president of the student government at a large university.
The proportion of voters who favor the candidate is 0.8. A simple random sample of
100 voters is taken.
a. What are the expected value, standard deviation, and shape of the sampling
distribution of ?
b. What is the probability that the number of voters in the sample who will not favor
Candidate A will be between 26 and 30?
c. What is the probability that the number of voters in the sample who will not favor
Candidate A will be more than 16?
Larger values of the standard deviation result in a normal curve that is
a. shifted to the right
b. shifted to the left
c. narrower and more peaked
d. wider and flatter
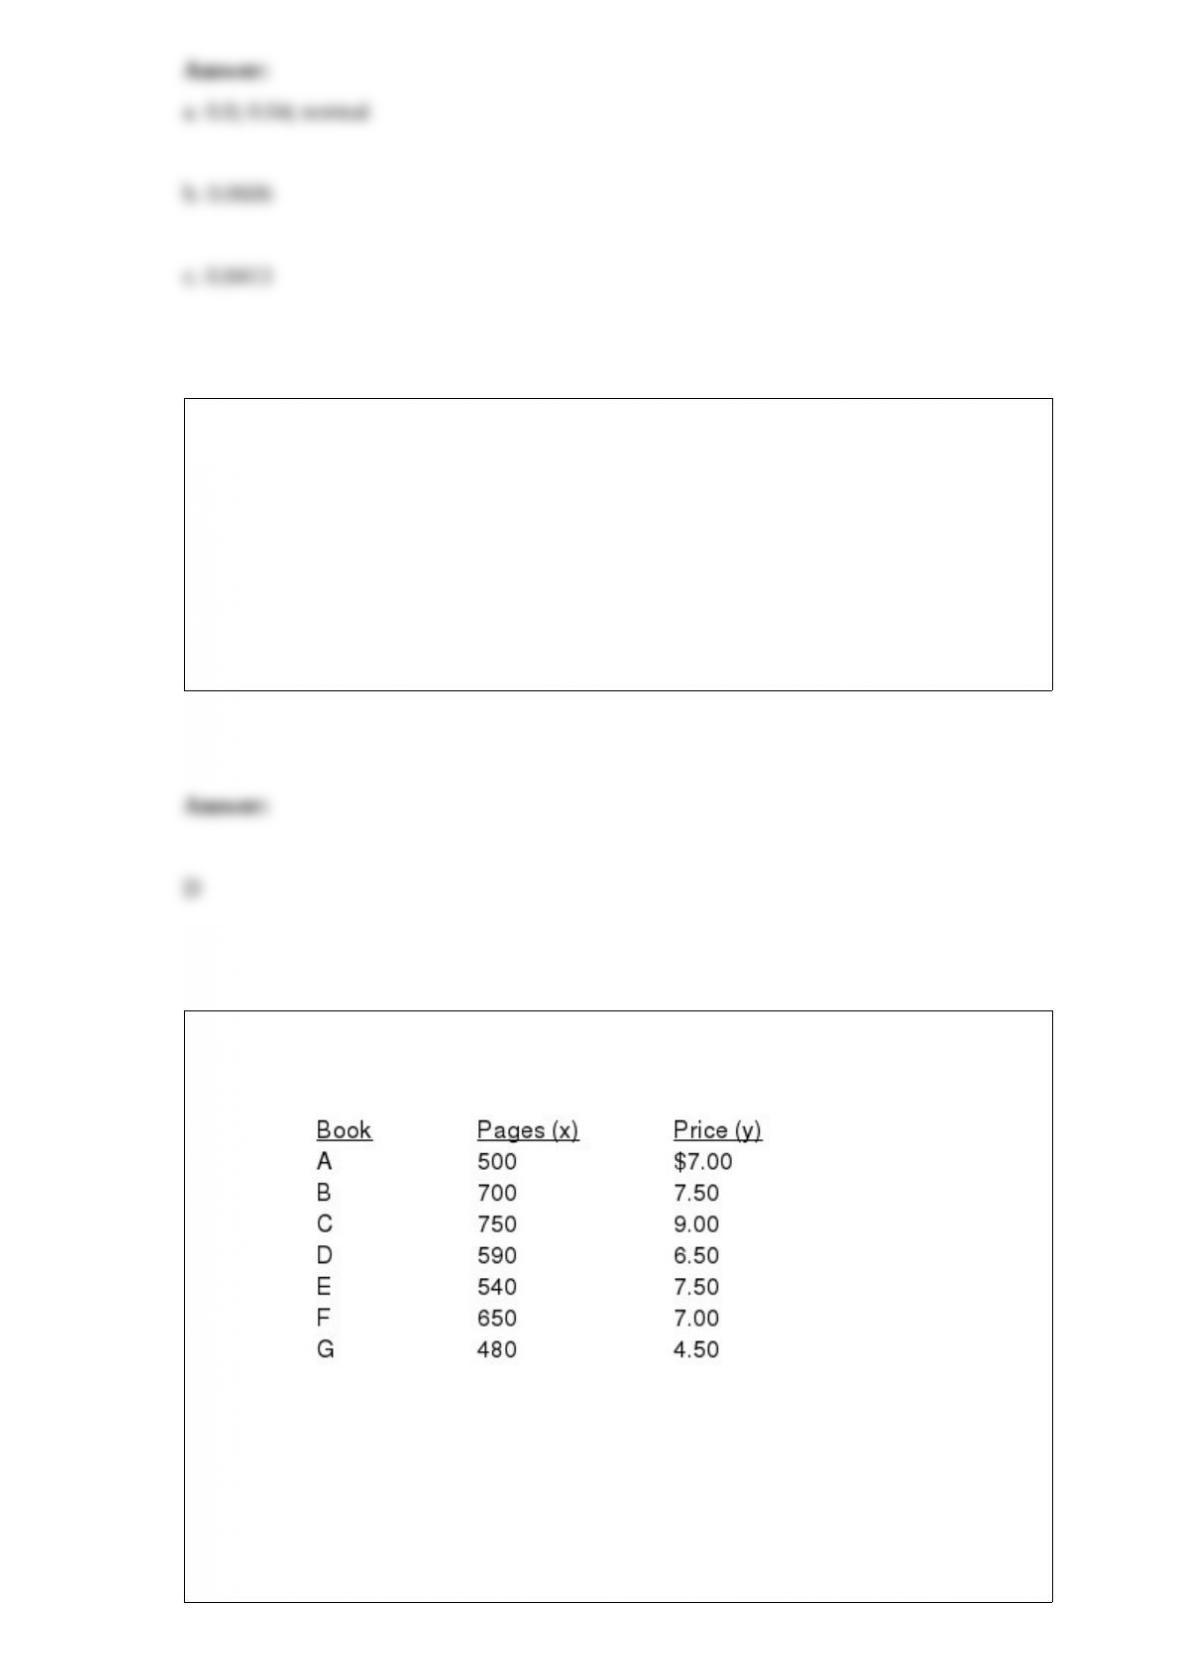
Assume you have noted the following prices for books and the number of pages that
each book contains.
a. Develop a least-squares estimated regression line.
b. Compute the coefficient of determination and explain its meaning.
c. Compute the correlation coefficient between the price and the number of pages. Test
to see if x and y are related. Use = 0.10.
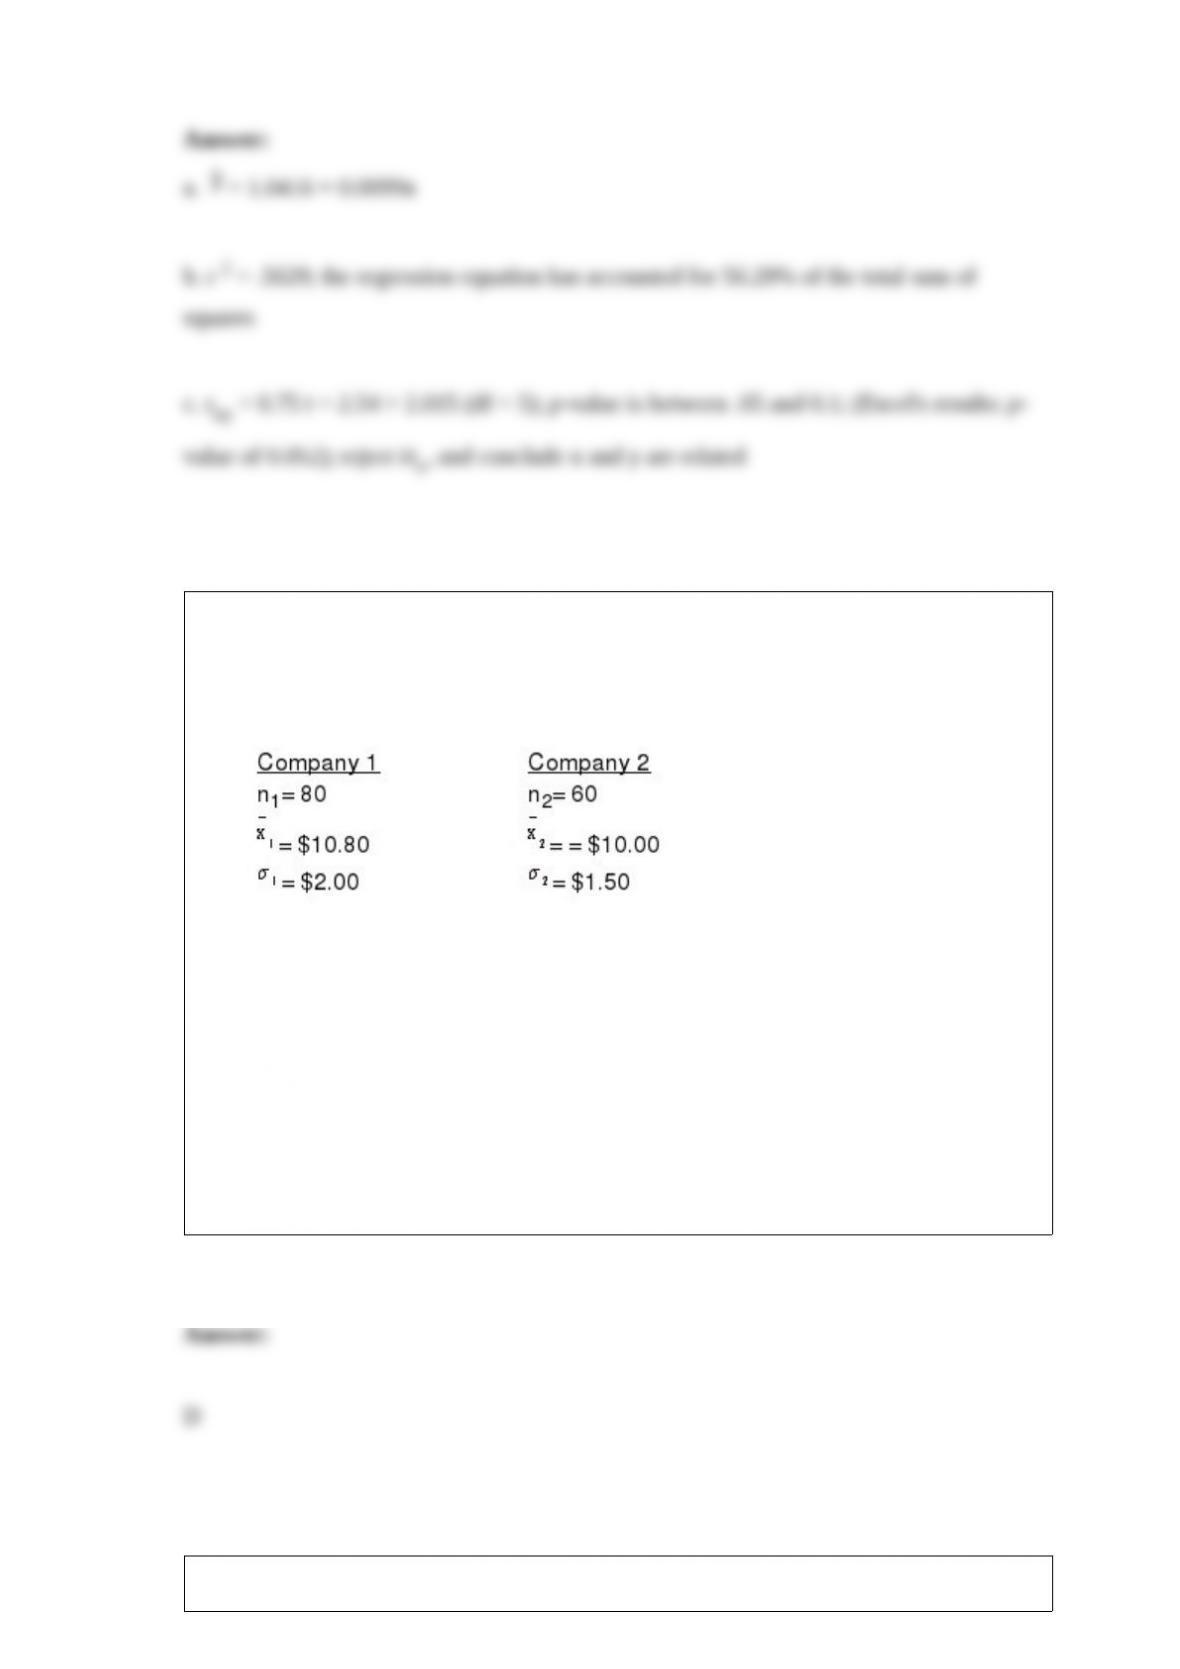
Exhibit 10-13
In order to determine whether or not there is a significant difference between the hourly
wages of two companies, the following data have been accumulated.
Refer to Exhibit 10-13. The test statistic has a value of
a.
b.
c.
d.
Exhibit 5-8
The student body of a large university consists of 60% female students. A random
sample of 8 students is selected.
Refer to Exhibit 5-8. What is the probability that among the students in the sample
exactly two are female?
a. 0.0896
b. 0.2936
c. 0.0413
d. 0.0007
The most common type of observational study is
a. an experiment
b. a survey
c. a debate
d. a statistical inference
The expression used to compute an interval estimate of
may depend on any of the
following factors except
a. the sample size
b. whether the population standard deviation is known
c. whether the population has an approximately normal distribution
d. whether there is sampling error
The miles-per-gallon obtained by the 2013 model Q cars is normally distributed with a
mean of 22 miles-per-gallon and a standard deviation of 5 miles-per-gallon.
a. What is the probability that a car will get between 13.35 and 35.1 miles-per-gallon?
b. What is the probability that a car will get more than 29.6 miles-per-gallon?
c. What is the probability that a car will get less than 21 miles-per-gallon?
d. What is the probability that a car will get exactly 22 miles-per-gallon?
A dietician wants to see if there is any difference in the effectiveness of three diets.
Eighteen people, comprising a sample, were randomly assigned to the three diets.
Below you are given the total amount of weight lost in a month by each person.
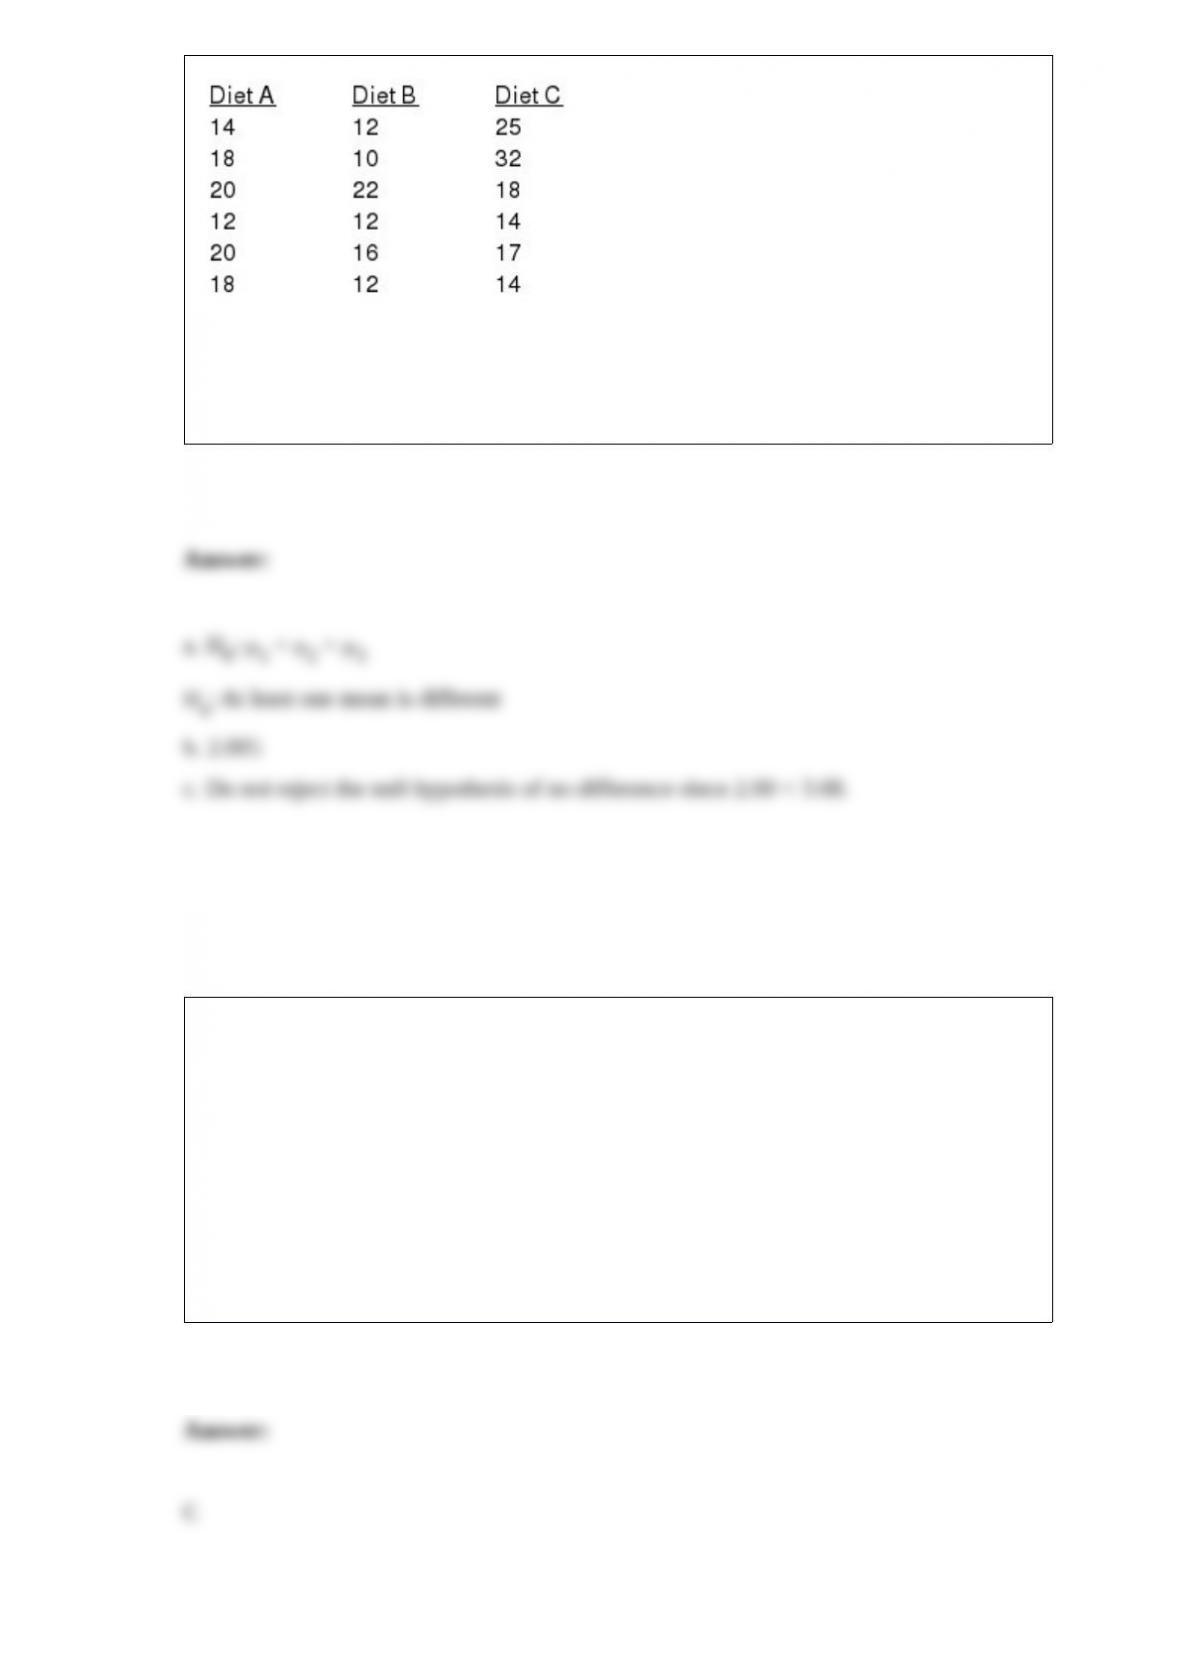
a. State the null and alternative hypotheses.
b. Calculate the test statistic.
c. What would you advise the dietician about the effectiveness of the three diets? Use
a .05 level of significance.
Assume that you have a binomial experiment with p 0.5 and a sample size of 100.
The expected value of this distribution is
a. 0.50
b. 0.30
c. 50
d. Not enough information is given to answer this question.