
The number observations in a complete data set having 10 elements and 5 variables is
a. 5
b. 10
c. 25
d. 50
A binomial probability distribution with p = .3 is
a. negatively skewed
b. symmetrical
c. positively skewed
d. bimodal
Which of the following symbols represents the size of the population?
a. 2
b.
c.
d. N
Excel’s ____ function can be used to conduct a sign test.
a. POISSON.DIST
b. T.INV
c. BINOM.DIST
d. CHISQ.DIST.RT
A company has recorded data on the daily demand for its product (y in thousands of
units) and the unit price (x in hundreds of dollars). A sample of 15 days demand and
associated prices resulted in the following data.
a. Using the above information, develop the least-squares estimated regression line and
write the equation.
b. Compute the coefficient of determination.
c. Perform an F test and determine whether or not there is a significant relationship
between demand and unit price. Let 0.05.
d. Would the demand ever reach zero? If yes, at what price would the demand be zero?
Missy Walters owns a mail-order business specializing in clothing, linens, and furniture
for children. She is considering offering her customers a discount on shipping charges
for furniture based on the dollar-amount of the furniture order. Before Missy decides the
discount policy, she needs a better understanding of the dollar-amount distribution of
the furniture orders she receives.
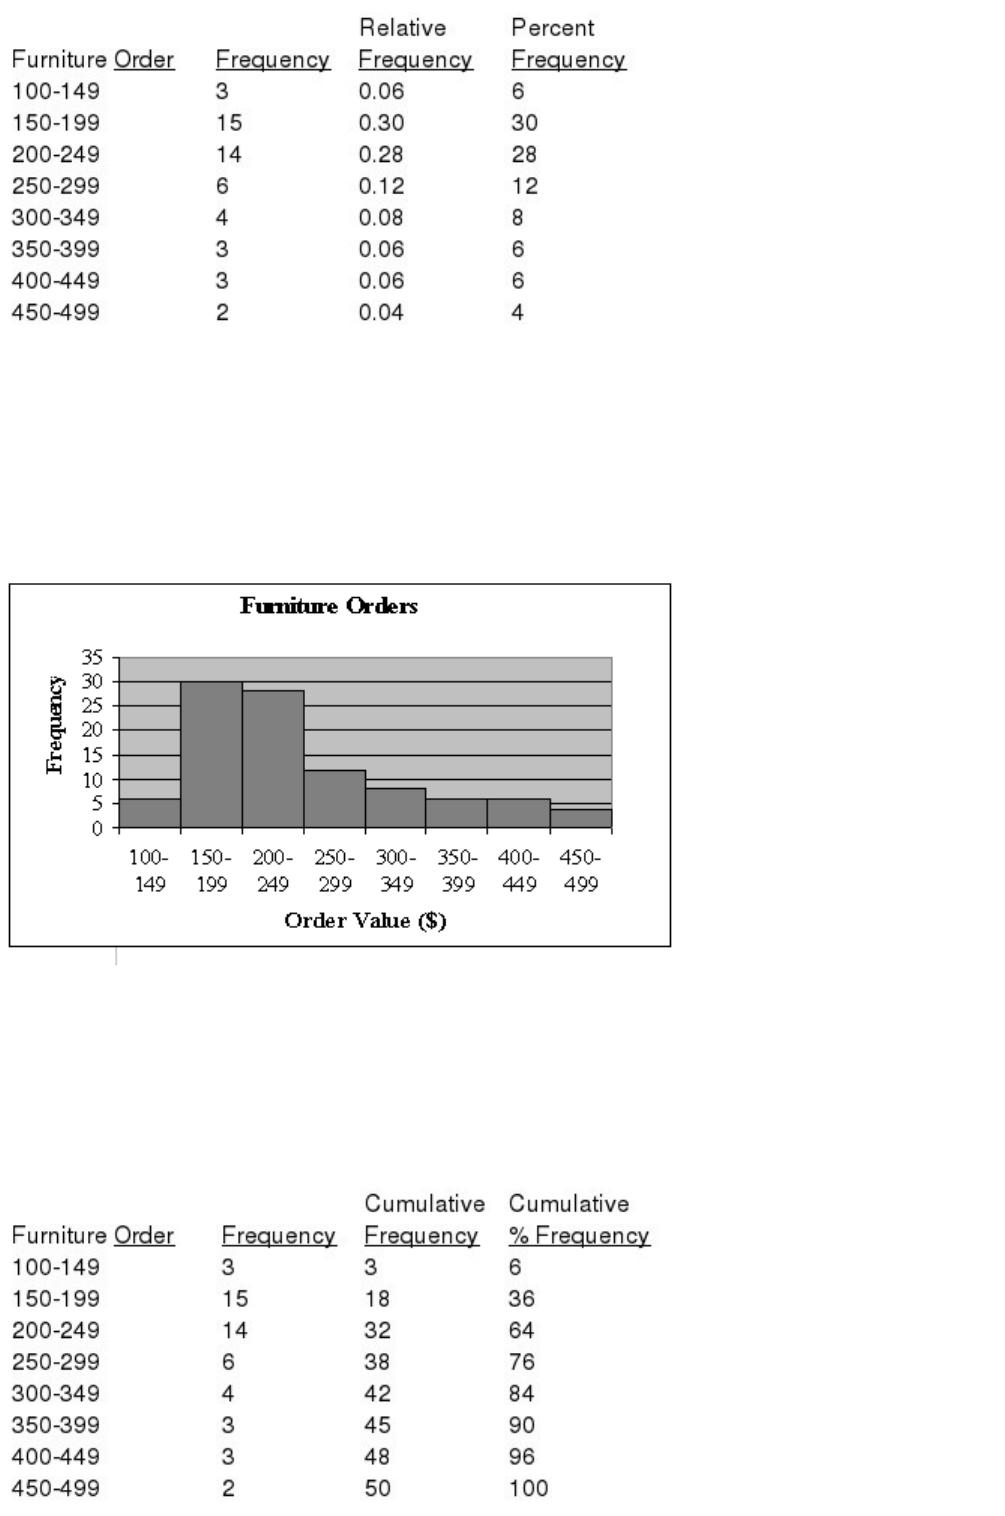
Missy had an assistant randomly select 50 recent orders that included furniture. The
assistant recorded the value, to the nearest dollar, of the furniture portion of each order.
The data collected is listed below.
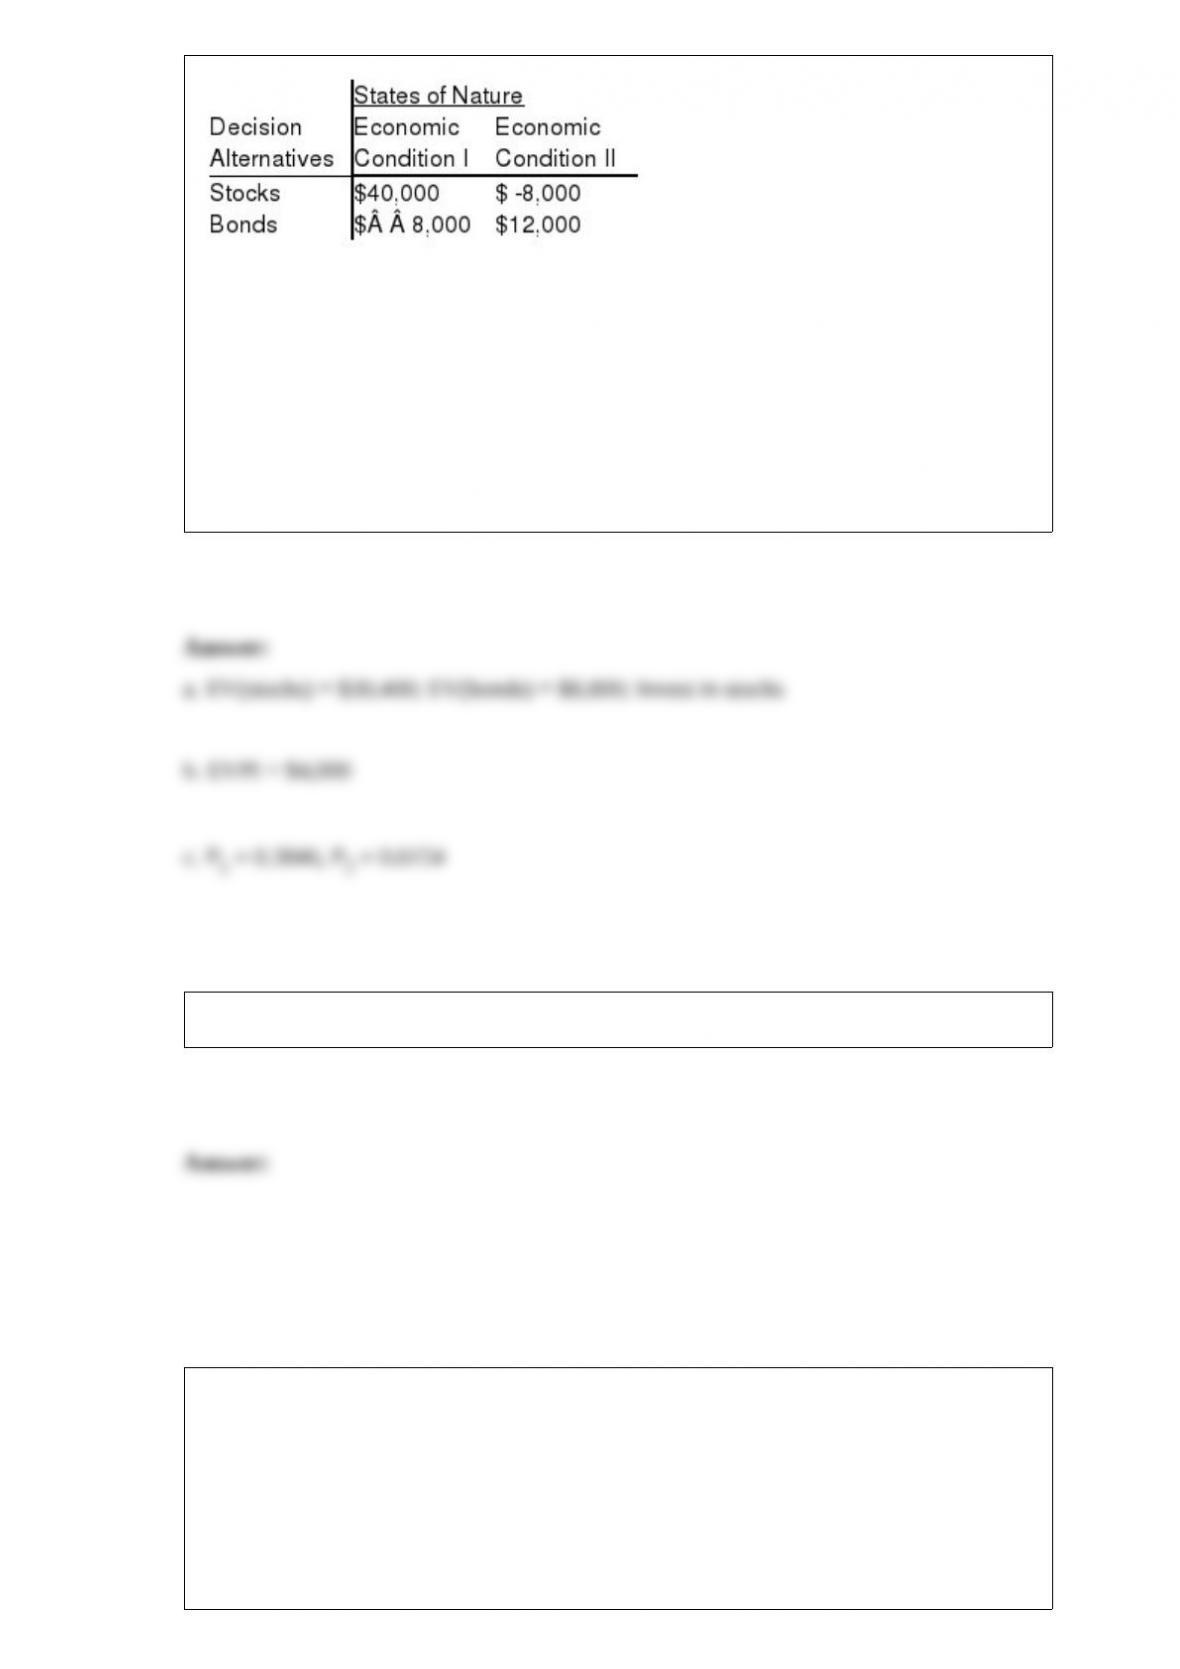
a. Prepare a frequency distribution, relative frequency distribution, and percent
frequency distribution for the data set using a class width of $50.
b. Construct a histogram showing the percent frequency distribution of the
furniture-order values in the sample.
c. Develop a cumulative frequency distribution and a cumulative percent frequency
distribution for this data.

If two independent large samples are taken from two populations, the sampling
distribution of the difference between the two sample means
a. can be approximated by a Poisson distribution
b. will have a variance of one
c. can be approximated by a normal distribution
d. will have a mean of one
A description of how the probabilities are distributed over the values the random
variable can assume is called a
a. probability distribution
b. probability function
c. random variable
d. expected value
Assume you have a sum of money available which you would like to invest in one of
the two available investment plans: Stocks or bonds. The conditional payoffs of each
plan under two possible economic conditions are as follows:
a. If the probability of Economic Condition I occurring is 0.8, where should you invest
your money? Use the expected value criterion and show your complete work.
b. Compute the expected value of perfect information (EVPI).
c. What kind of probabilities of Economic Conditions I and II should there be before
you would be indifferent between investing in stocks and bonds? (i.e., compute the
probabilities for which you will be indifferent between investing in stocks or bonds.)
Exhibit 18-6
It is believed that the median yearly income in a suburb of Atlanta is $70,000. A sample
of 67 residents was taken. Thirty-eight had yearly incomes above $70,000, 26 had
yearly incomes below $70,000, and 3 had yearly incomes equal to $70,000. The null
hypothesis to be tested is H0: median = $70,000.

Refer to Exhibit 18-6. The mean and the standard deviation (respectively) for this test
about the median are
a. 32 and 4
b. 32 and 16
c. 33.5 and 4
d. 33.5 and 16
Exhibit 15-8
The following estimated regression model was developed relating yearly income (y in
$1,000s) of 30 individuals with their age (x1) and their gender (x2) (0 if male and 1 if
female).
= 30 + 0.7x1 + 3x2
Also provided are SST = 1,200 and SSE = 384.
Refer to Exhibit 15-8. The estimated income of a 30-year-old male is
a. $51,000
b. $5,100
c. $510
d. $51
X is a normally distributed random variable with a mean of 12 and a standard deviation
of 3. The probability that x equals 19.62 is
a. 0.000
b. 0.0055
c. 0.4945
d. 0.9945
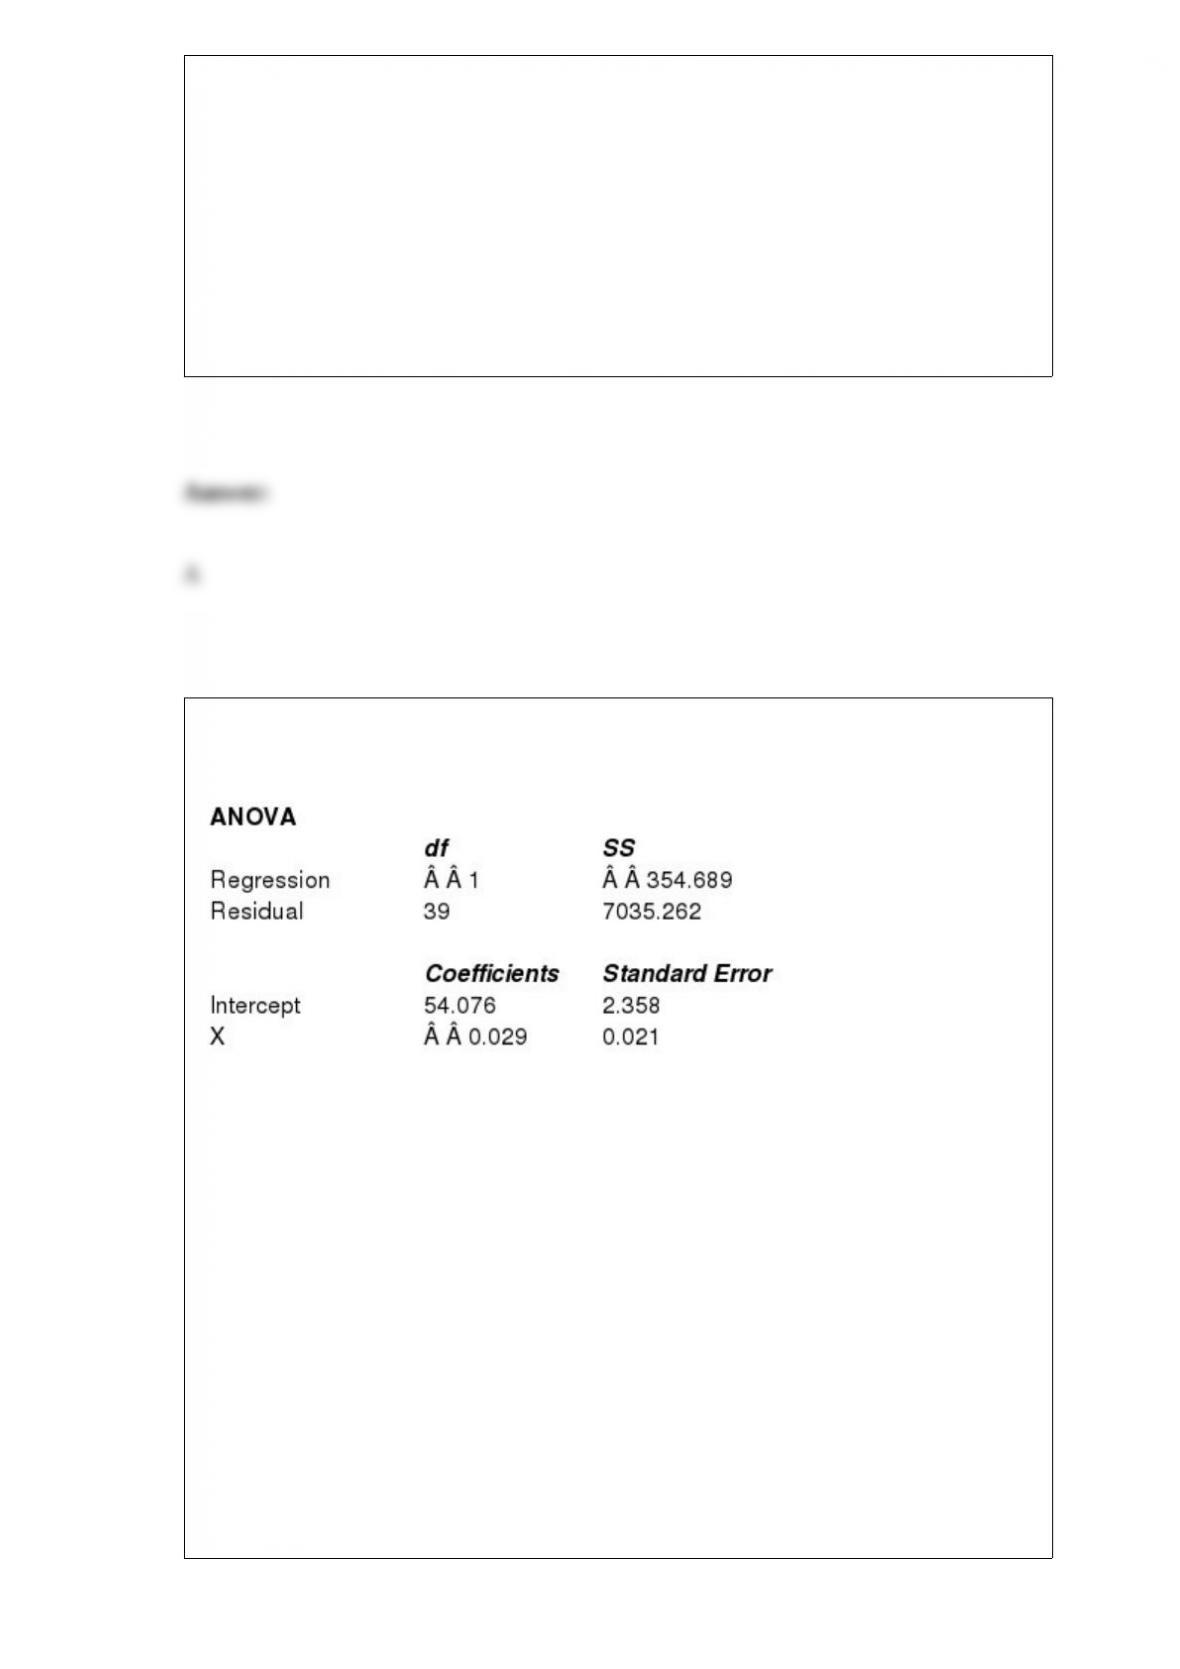
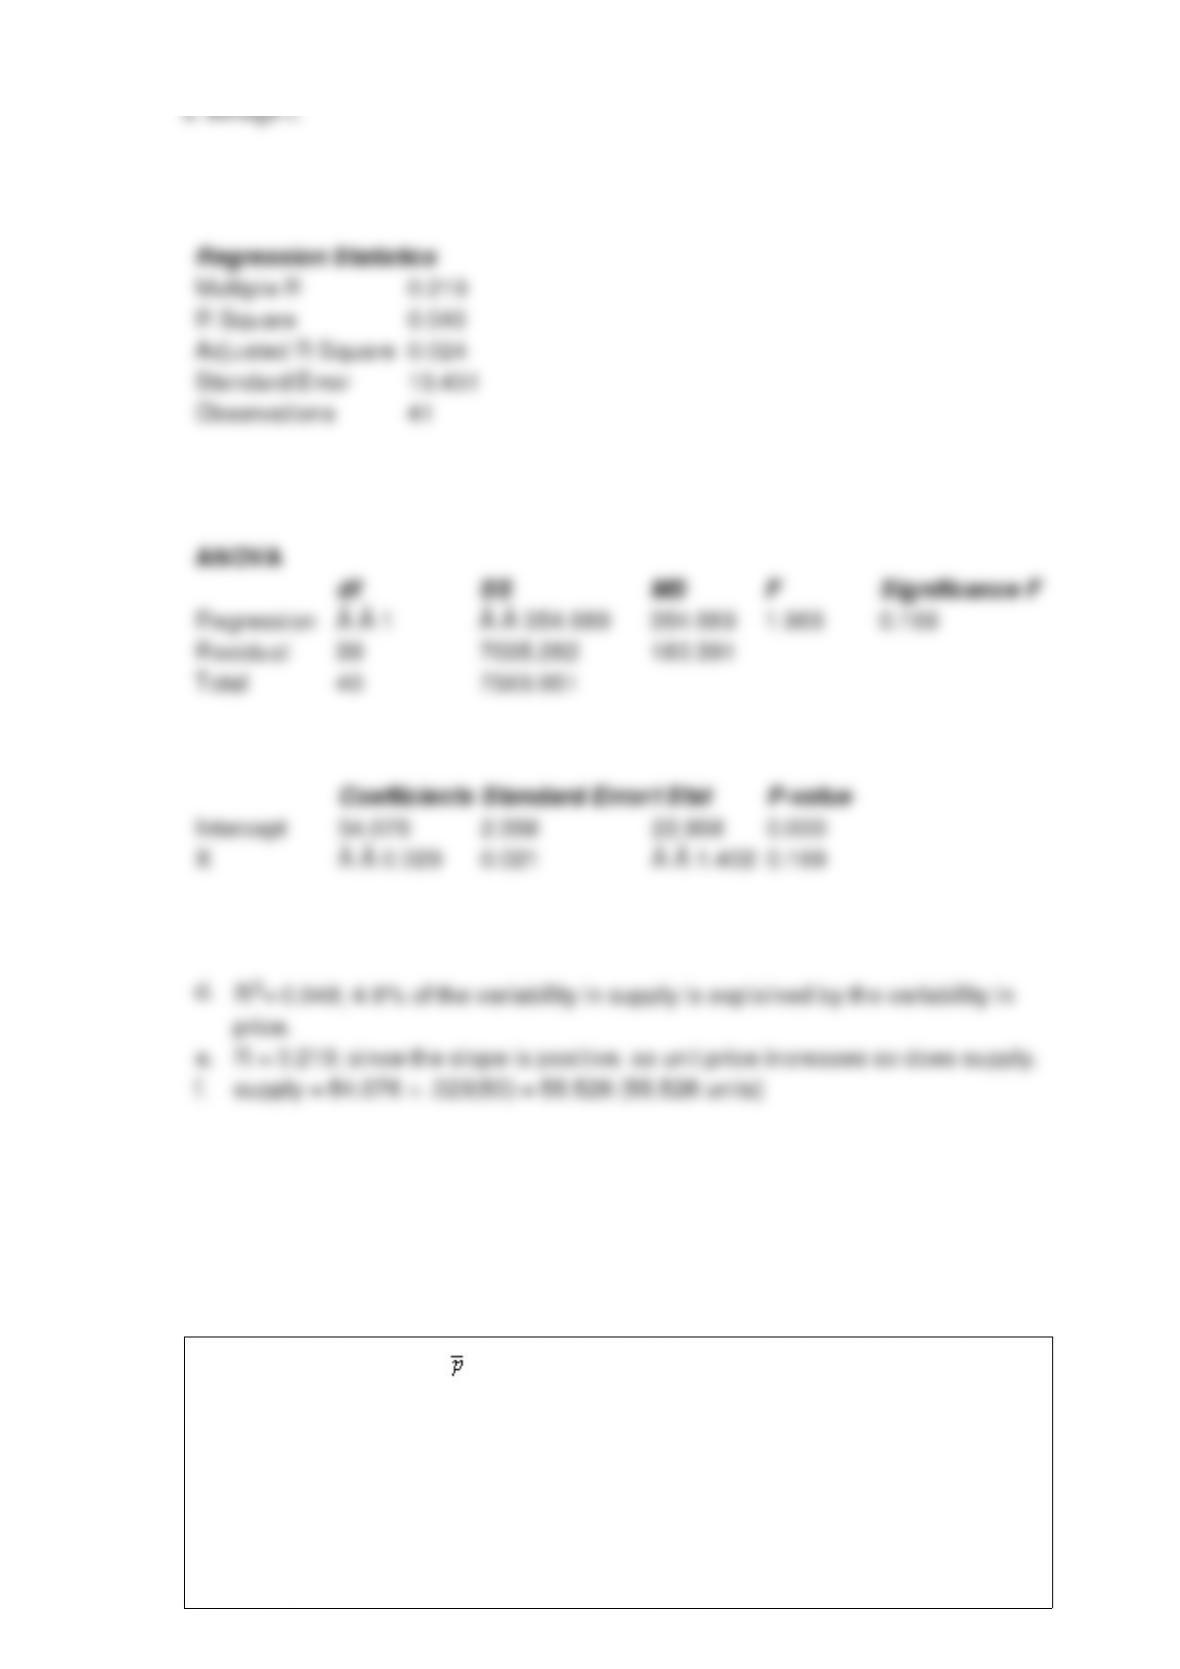
Shown below is a portion of a computer output for a regression analysis relating supply
(Y in thousands of units) and unit price (X in thousands of dollars).
a. What has been the sample size for this problem?
b. Perform a t test and determine whether or not supply and unit price are related. Let
= 0.05.
c. Perform and F test and determine whether or not supply and unit price are related.
Let = 0.05.
d. Compute the coefficient of determination and fully interpret its meaning. Be very
specific.
e. Compute the coefficient of correlation and explain the relationship between supply
and unit price.
f. Predict the supply (in units) when the unit price is $50,000.
The standard deviation of is referred to as the
a. standard proportion
b. sample proportion
c. average proportion

d. standard error of the proportion
Excel’s __________ function can be used to compute the population variance.
a. MAX
b. MODE
c. VAR
d. None of the other answers are correct.
Sampling errors can
a. be avoided by increasing the sample size to at least 30
b. be avoided if the sample is increased so that it will be at least 5% of the population
c. be avoided by using probabilistic sampling
d. not be avoided
If X and Y are mutually exclusive events with P(X) 0.295, P(Y) 0.32, then
P(XY)
a. 0.0944
b. 0.6150
c. 1.0000
d. 0.0000
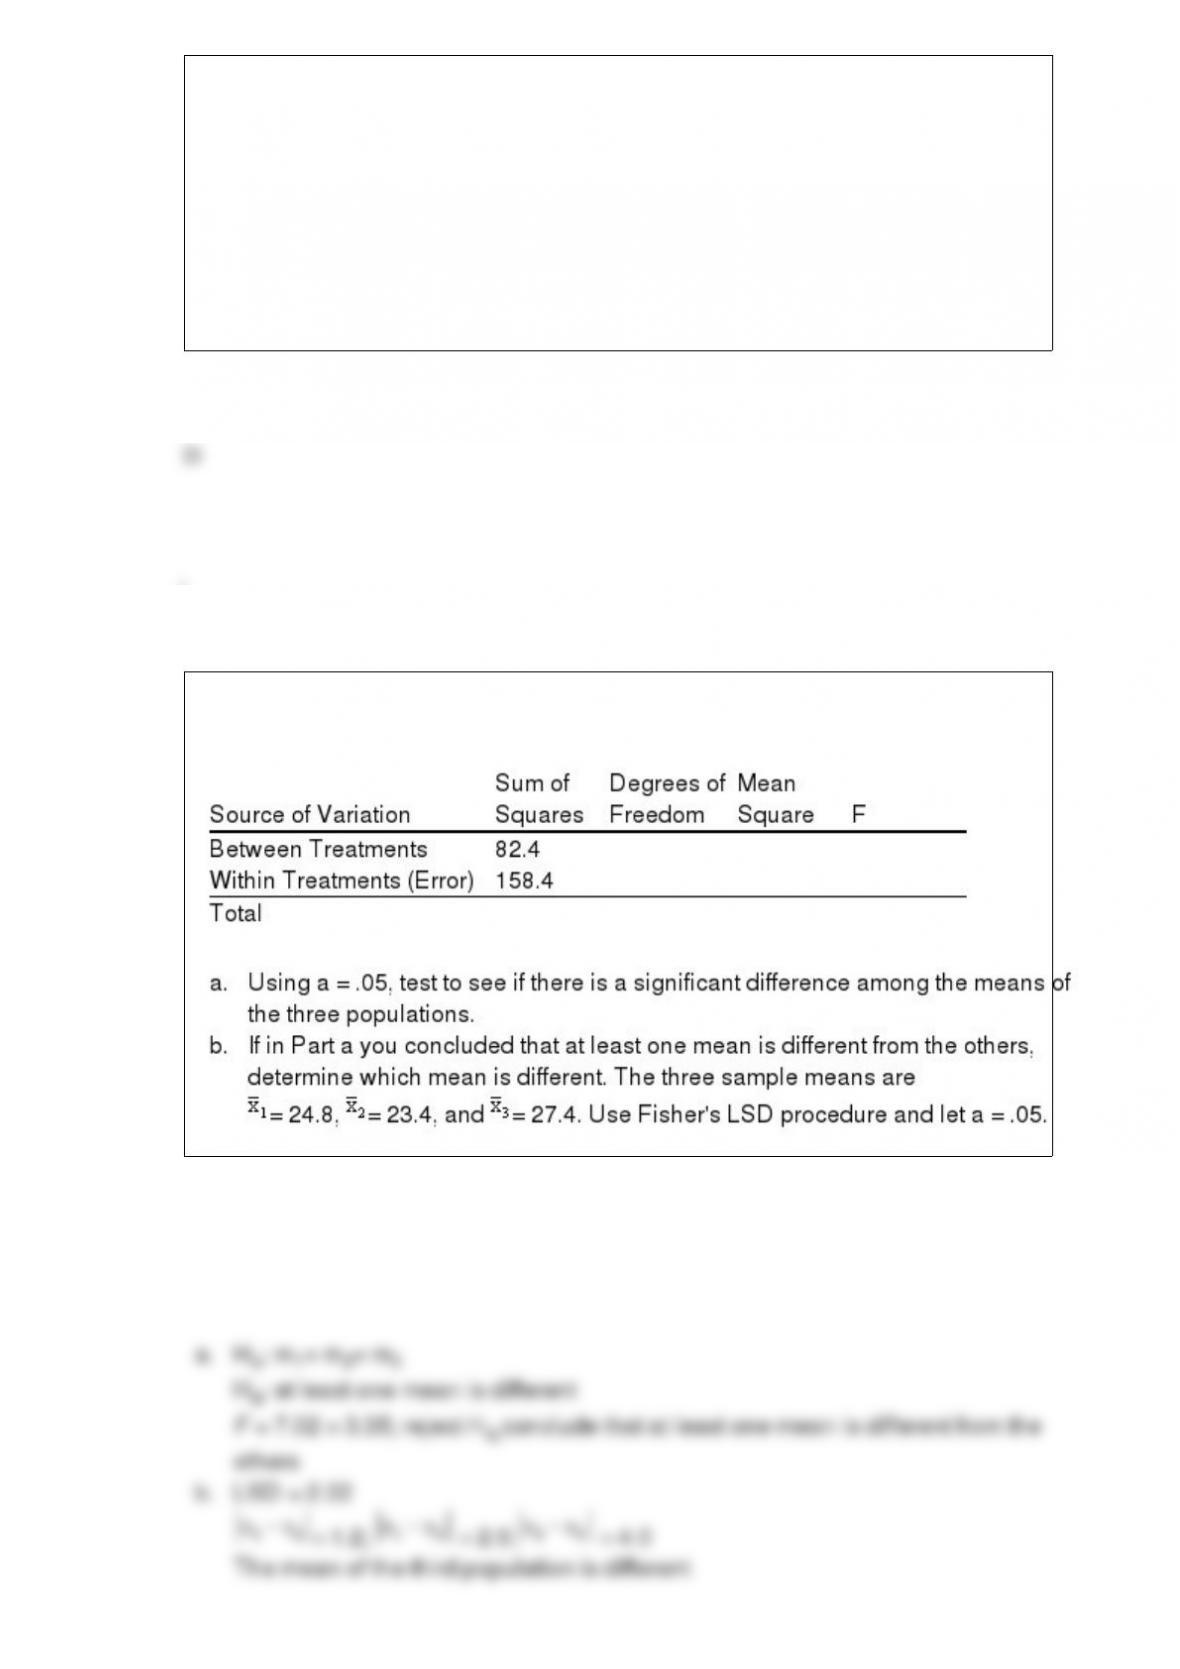
Ten observations were selected from each of 3 populations, and an analysis of variance
was performed on the data. The following are the results:
36. In a goodness of fit test, Excel’s CHISQ.DIST.RT function returns a
a. chi-square critical value
b. chi-square test statistic
c. p-value
d. confidence interval estimate
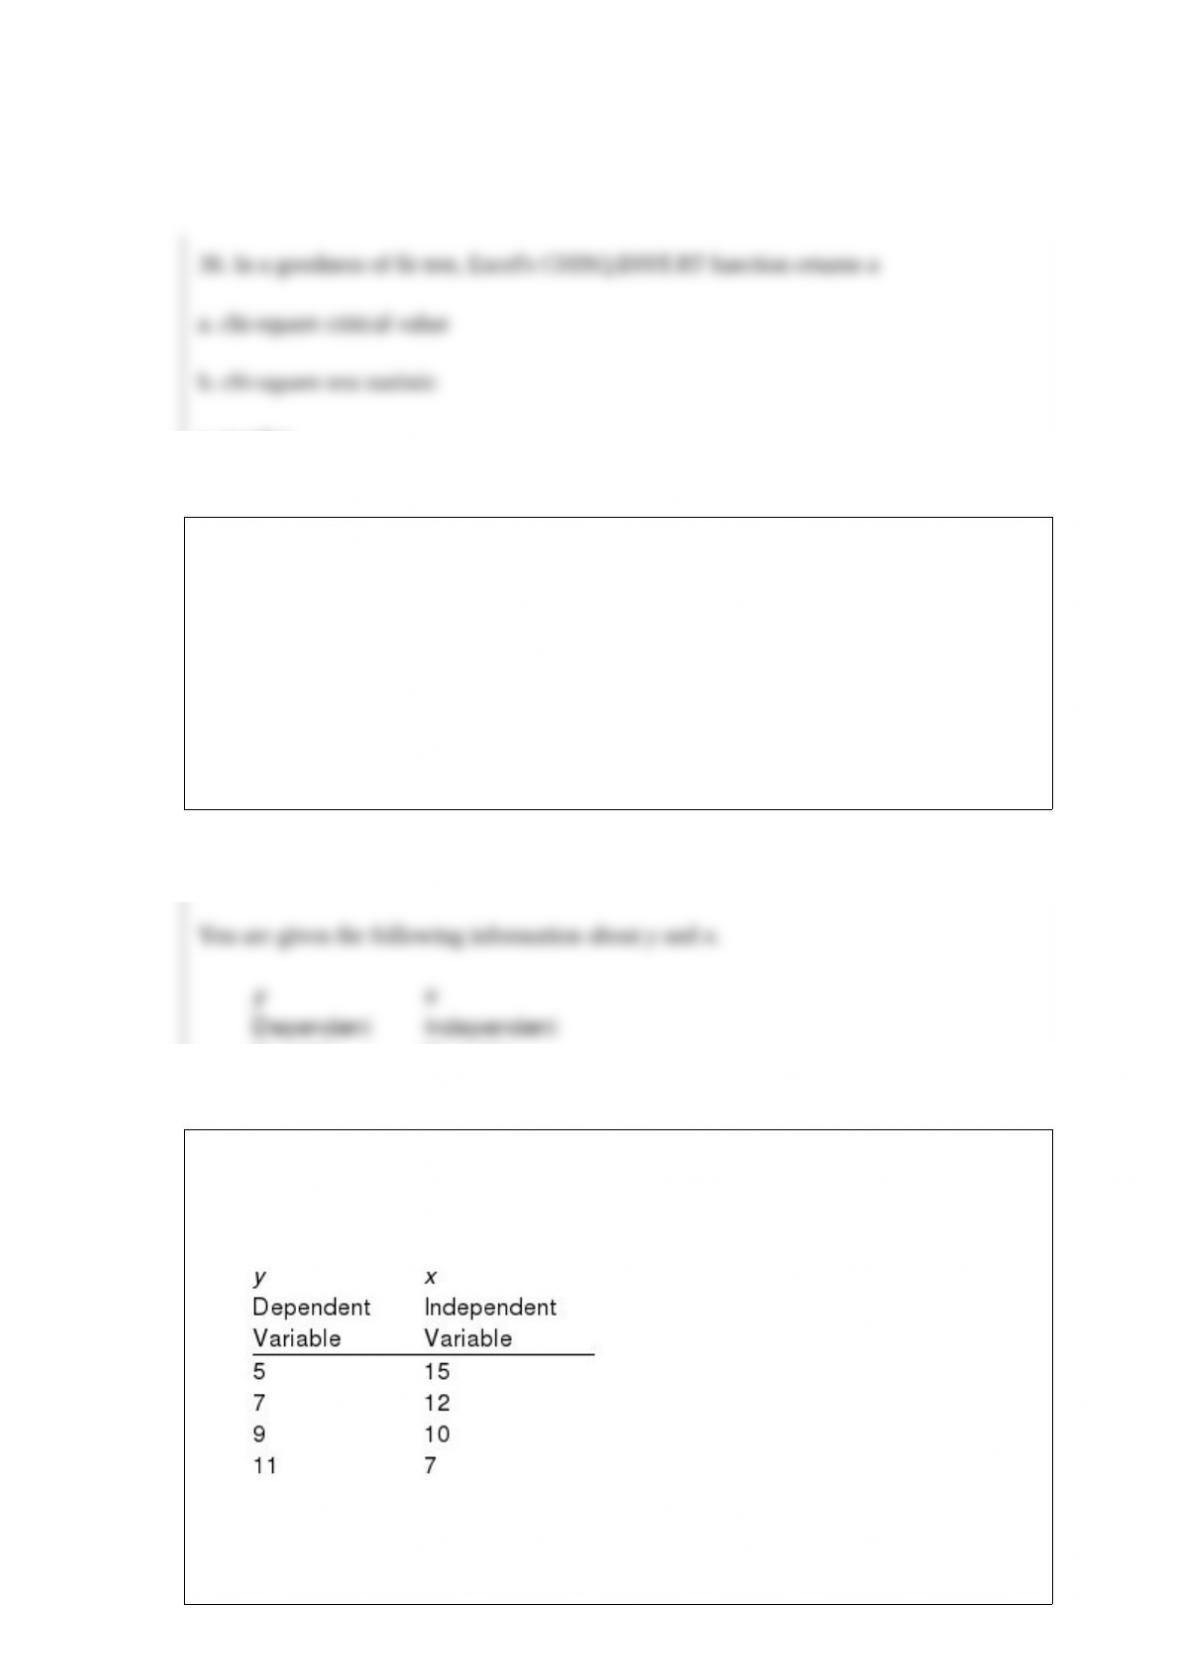
Exhibit 14-2
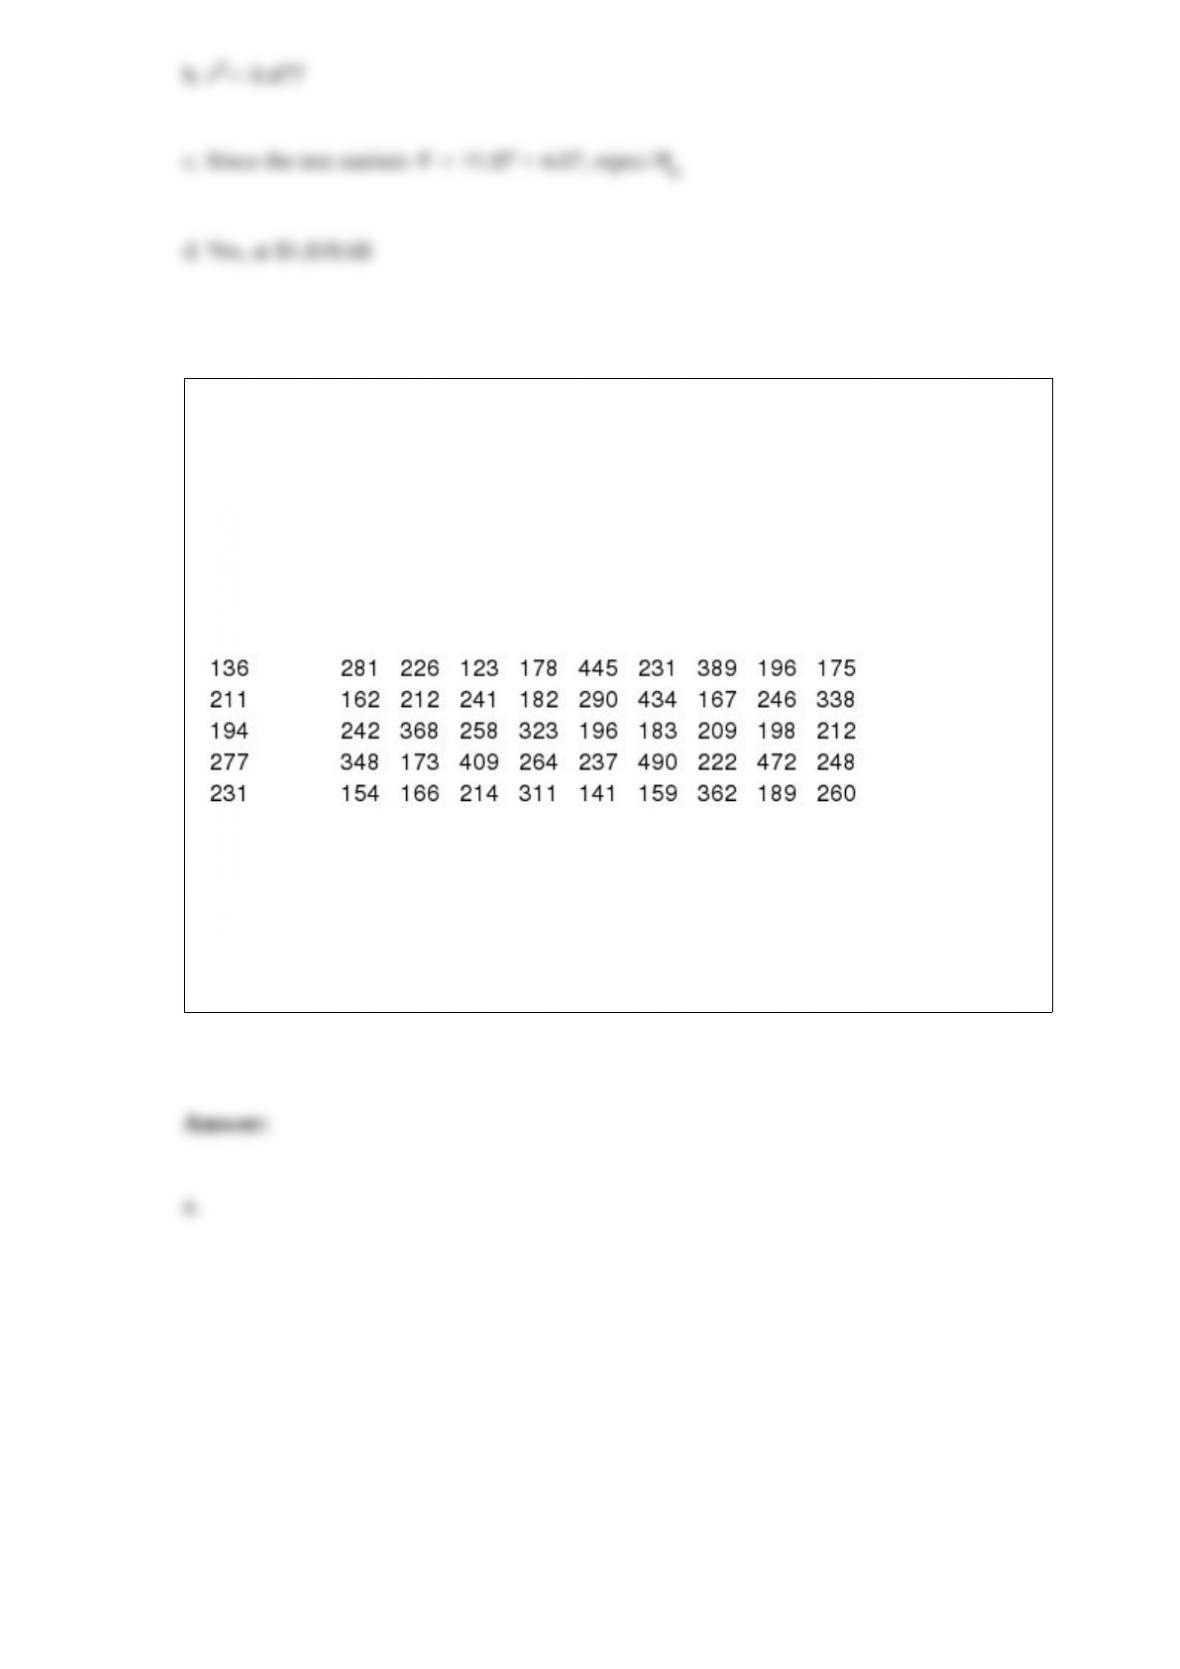
You are given the following information about y and x.
Refer to Exhibit 14-2. The least squares estimate of b0 equals

a. -7.647
b. -1.3
c. 21.4
d. 16.41176