The manager of University Credit Union (UCU) is concerned about checking account
transaction discrepancies. Customers are bringing transaction errors to the attention of
the bank’s staff several months after they occur. The manager would like to know what
proportion of his customers balance their checking accounts within 30 days of receiving
a transaction statement from the bank.
Using systematic random sampling, 400 checking account customers are contacted by
telephone and asked if they routinely balance their accounts within 30 days of receiving
a statement. 271 of the 400 customers respond Yes.
a. Develop a 95% confidence interval estimate for the proportion of the
population of checking account customers at UCU that routinely balance their
accounts in a timely manner.
b. Suppose UCU wants a 95% confidence interval estimate of the population
proportion with a margin of error of E = .025. How large a sample size is needed?
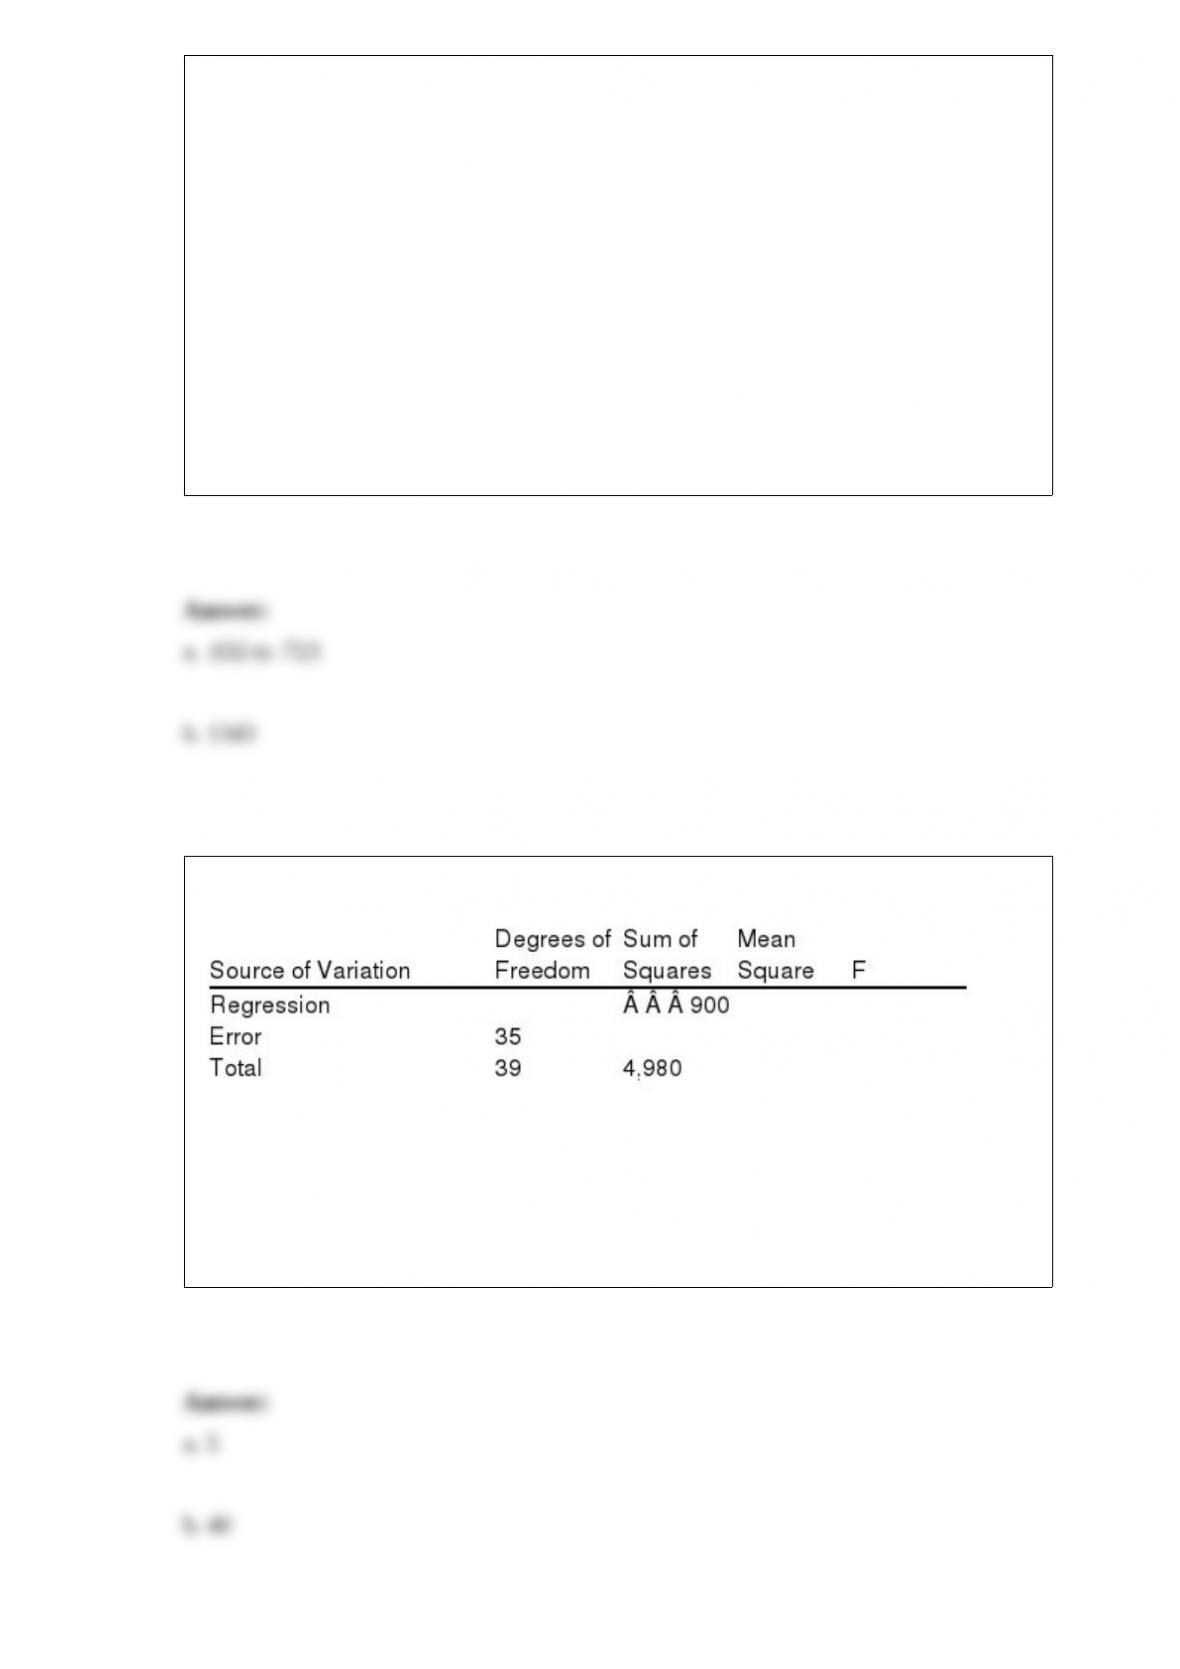
The following results were obtained from a multiple regression analysis.
a. How many independent variables were involved in this model?
b. How many observations were involved?
c. Determine the F statistic.
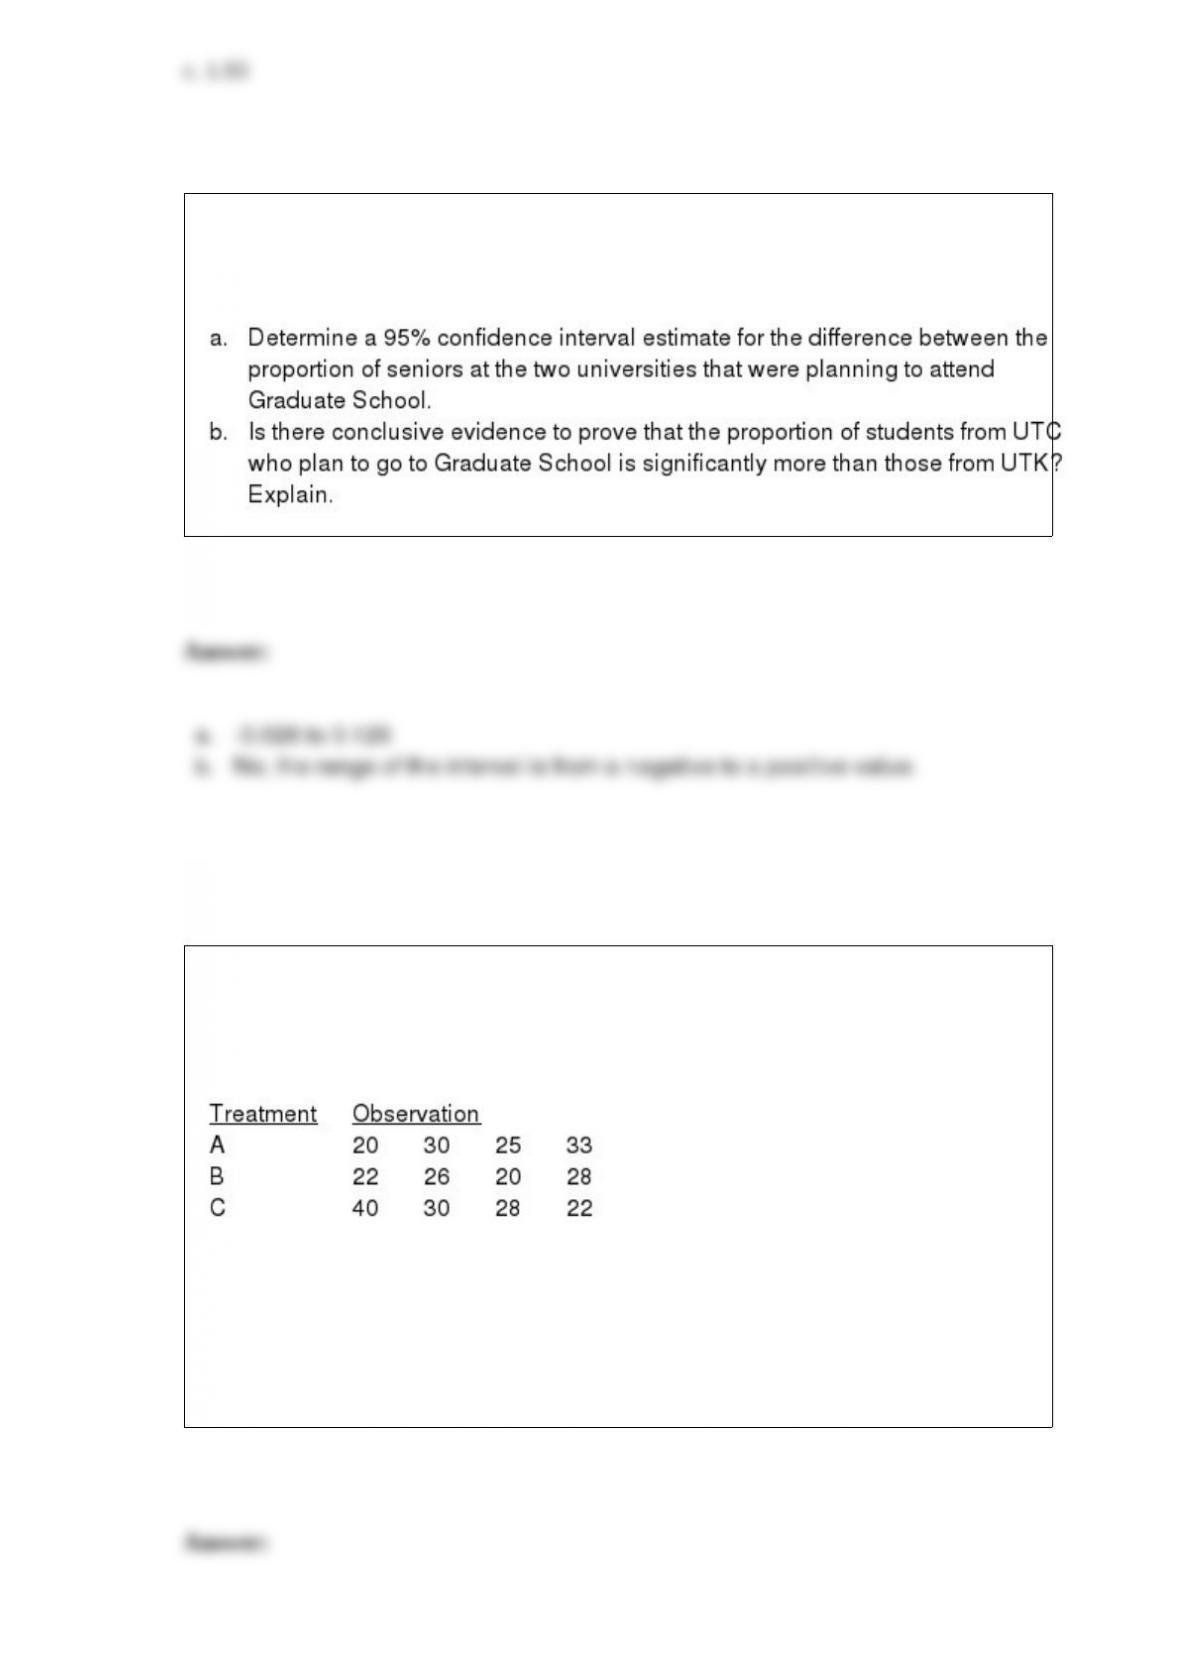
Of 200 UTC seniors surveyed, 60 were planning on attending Graduate School. At
UTK, 400 seniors were surveyed and 100 indicated that they were planning to attend
Graduate School.
Exhibit 13-3
To test whether or not there is a difference between treatments A, B, and C, a sample of
12 observations has been randomly assigned to the 3 treatments. You are given the
results below.
Refer to Exhibit 13-3. The null hypothesis is to be tested at the 1% level of significance.
The critical value from the table is
a. 4.26
b. 8.02
c. 16.69
d. 99.39

We can reduce the margin of error in an interval estimate of p by doing any of the
following except
a. increasing the sample size
b. increasing the planning value p* to .5
c. increasing the level of significance
d. reducing the confidence coefficient
A graphical tool used to help determine whether a process is in control or out of control
is a
a. scatter diagram
b. histogram
c. control chart
d. None of the other answers is correct.
In the hypothesis testing procedure, is
a. the level of significance

b. the critical value
c. the confidence level
d. 1 level of significance
Excel’s __________ function can be used to compute the mode.
a. MAX
b. AVERAGE
c. MEDIAN
d. MODE
The level of significance in hypothesis testing is the probability of
a. accepting a true null hypothesis
b. accepting a false null hypothesis
c. rejecting a true null hypothesis
d. could be any of the above, depending on the situation
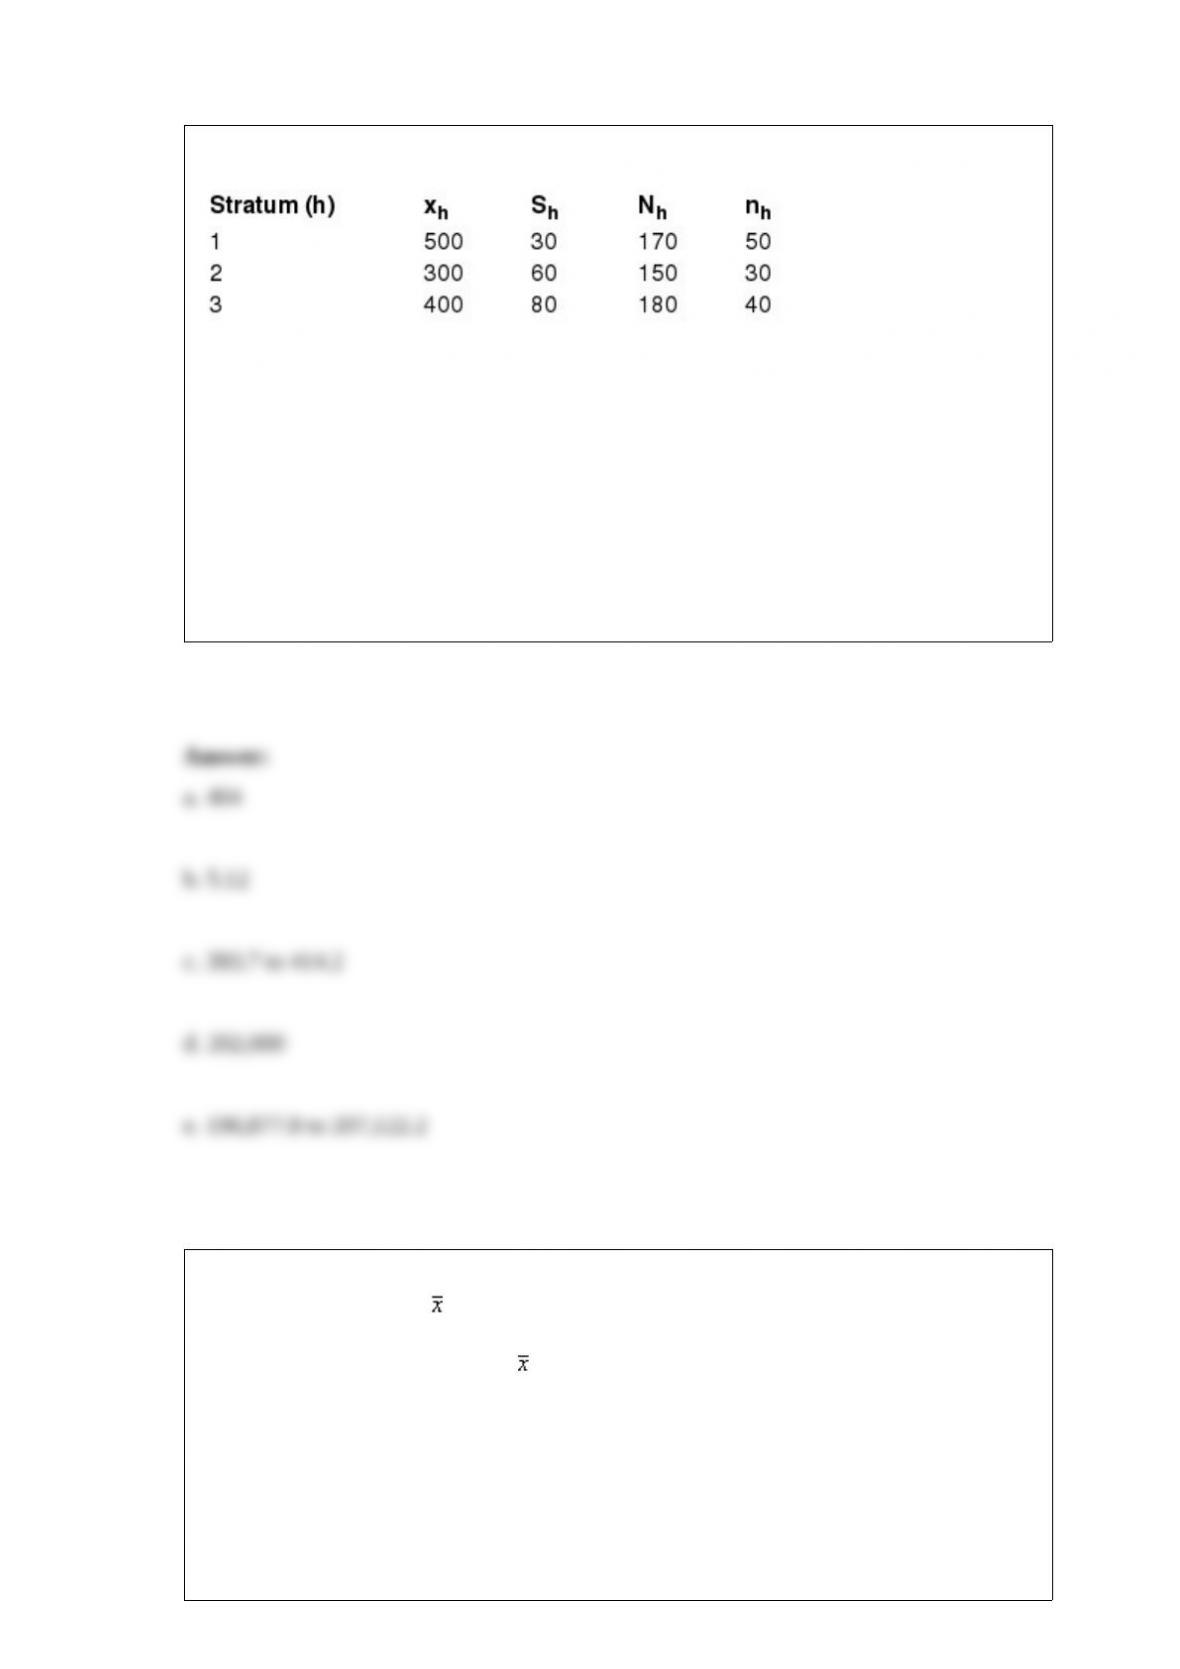
The following are the results provided by a stratified simple random sample.
a. Determine a point estimate for the mean of the population.
b. Estimate the standard error of the mean.
c. Approximate a 95% confidence interval for the population mean.
d. Compute the population total.
e. Determine a 95% confidence interval for the population total.
A sample of 24 observations is taken from a population that has 150 elements. The
sampling distribution of is
a. approximately normal because is always approximately normally distributed
b. approximately normal because the sample size is large in comparison to the
population size
c. approximately normal because of the central limit theorem
d. normal if the population is normally distributed
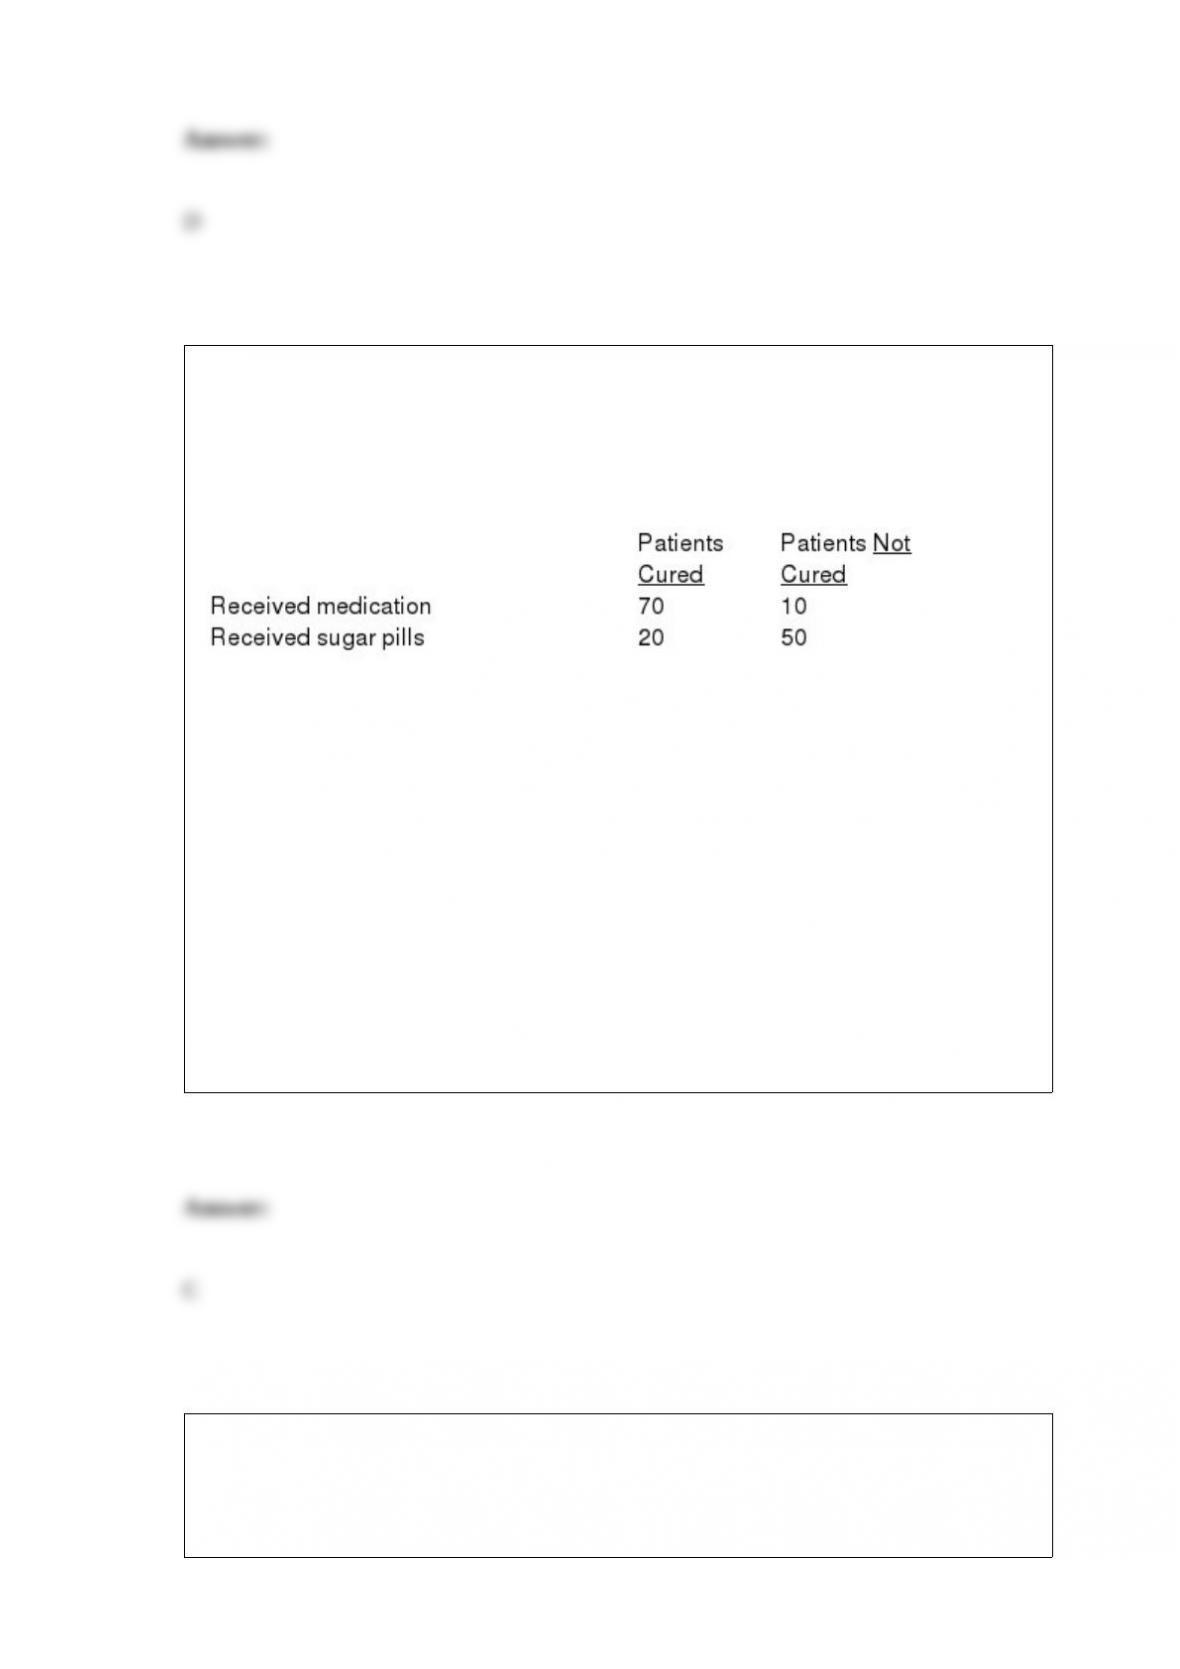
Exhibit 12-3
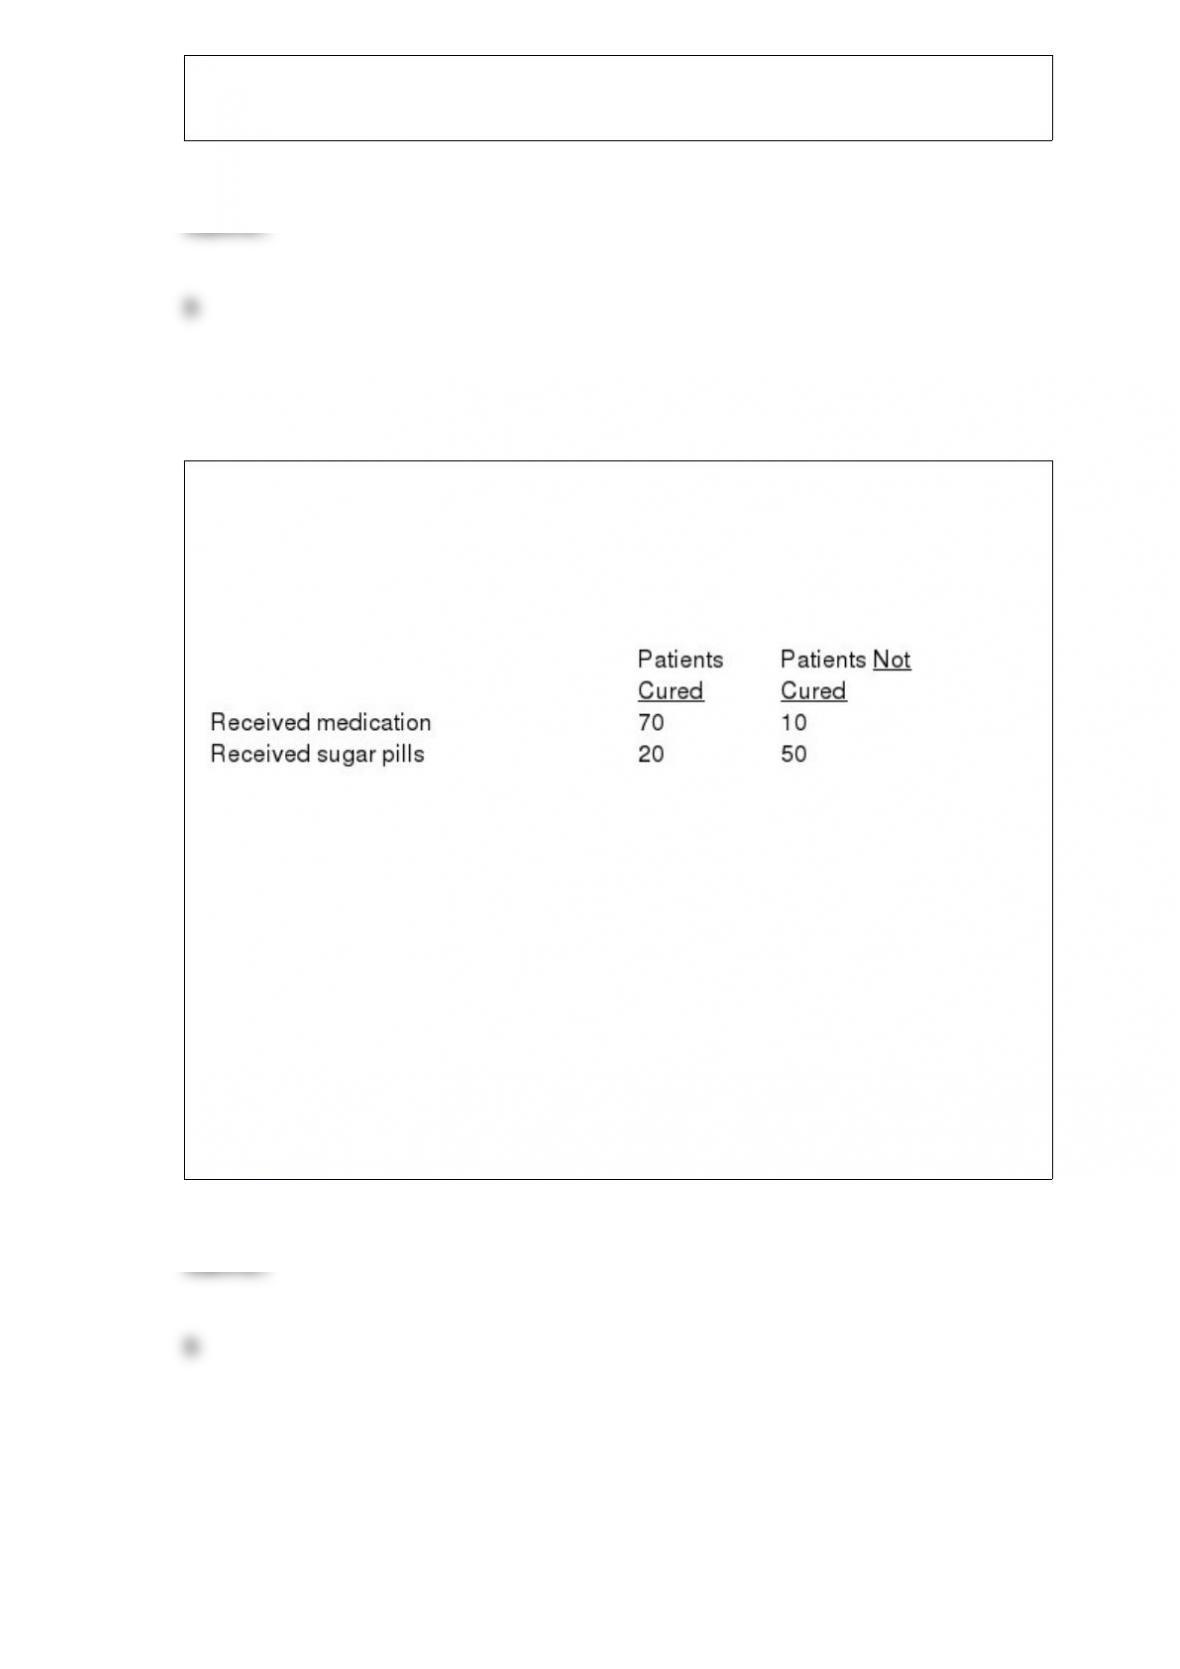
In order to determine whether or not a particular medication was effective in curing the
common cold, one group of patients was given the medication, while another group
received sugar pills. The results of the study are shown below.
We are interested in determining whether or not the medication was effective in curing
the common cold.
Refer to Exhibit 12-3. The number of degrees of freedom associated with this problem
is
a. 4
b. 149
c. 1
d. 3
Exhibit 14-1
A regression analysis resulted in the following information regarding a dependent
variable (y) and an independent variable (x).
Refer to Exhibit 14-1. The coefficient of determination equals
a. 0
b. -1
c. +1
d. -0.5
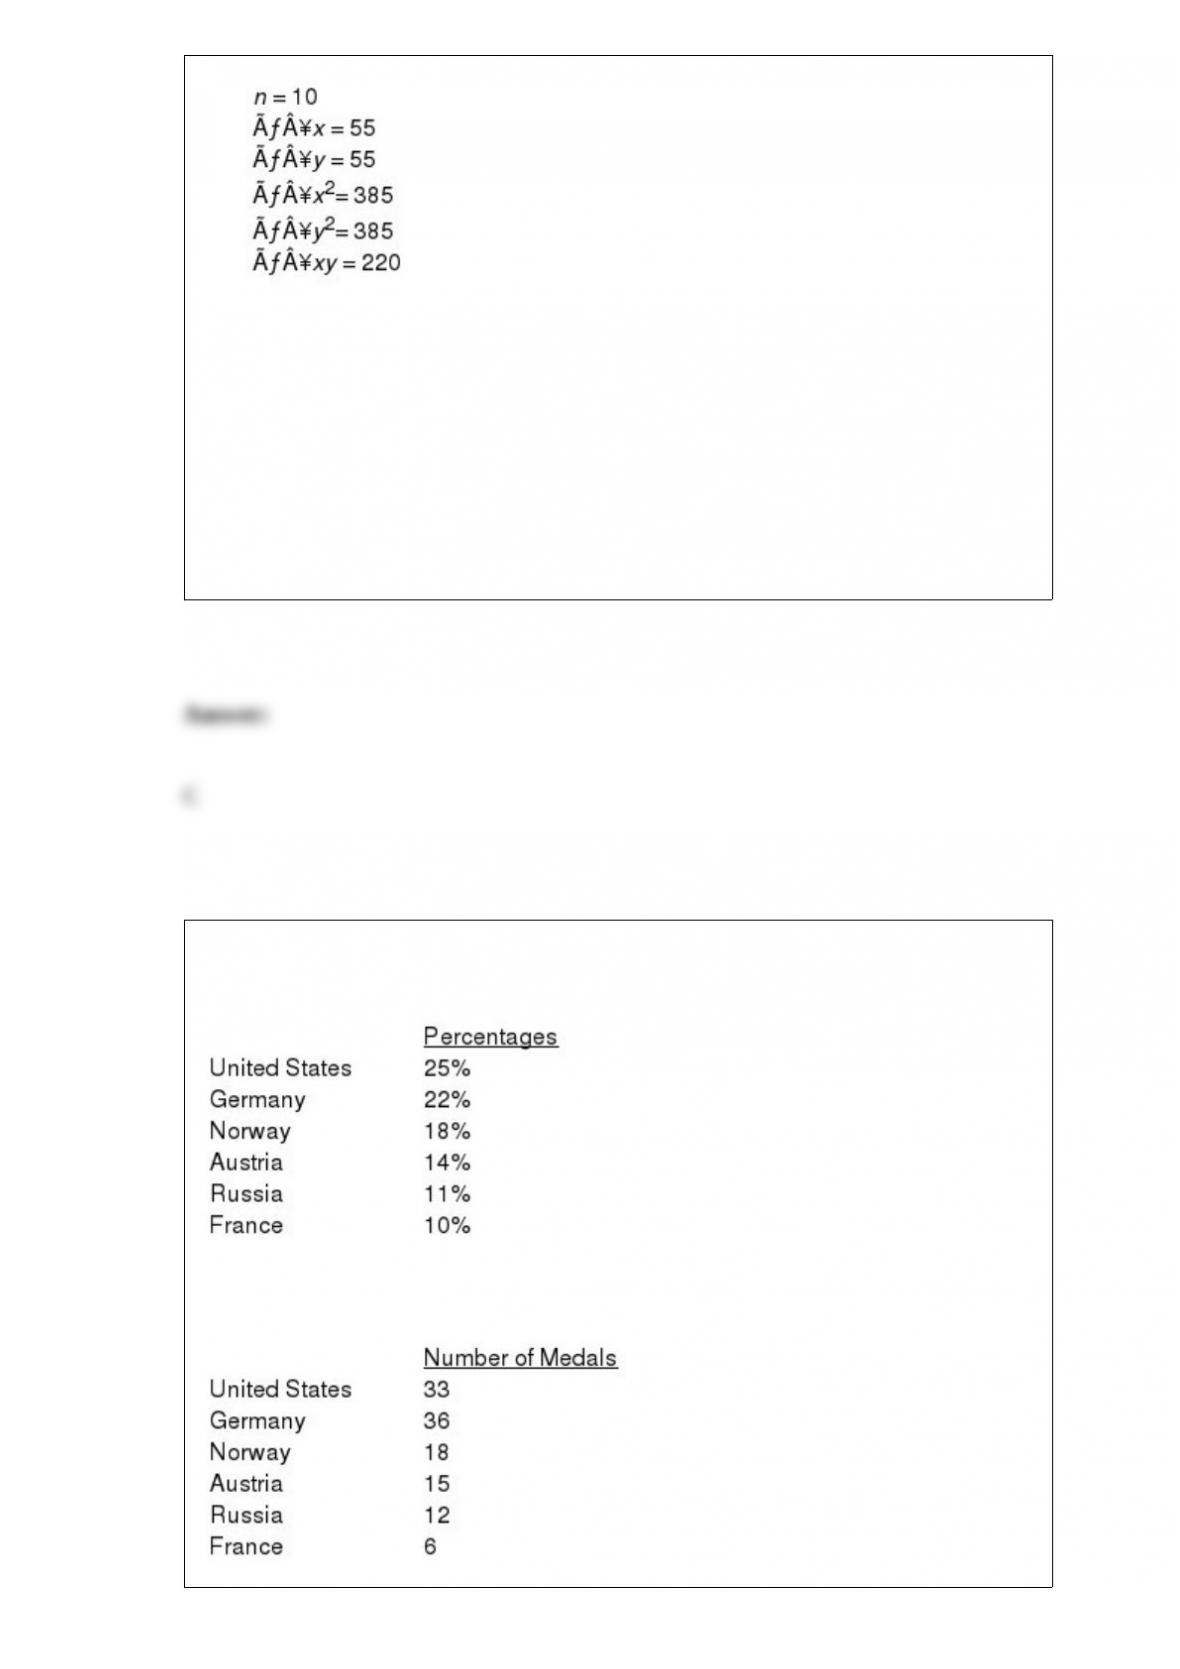
Before the start of the Winter Olympics, it was expected that the percentages of medals
awarded to the top contenders to be as follows.
Midway through the Olympics, of the 120 medals awarded, the following distribution
was observed.

We want to test to see if there is a significant difference between the expected and
actual awards given.
a. Compute the test statistic.
b. Using the p-value approach, test to see if there is a significant difference between the
expected and the actual values. Let = .05.
c. At 95% confidence, test for a significant difference using the critical value approach.
A regression was performed on a sample of 20 observations. Two independent variables
were included in the analysis, x and z. The relationship between x and z is z = x2. The
following estimated equation was obtained.
= 23.72 + 12.61x + 0.798z
The standard errors for the coefficients are Sb1 = 4.85 and Sb2 = 0.21
For this model, SSR = 520.2 and SSE = 340.6
a. Estimate the value of y when x = 5.
b. Compute the appropriate t ratios.
c. Test for the significance of the coefficients at the 5% level. Which variable(s) is (are)
significant?
d. Compute the coefficient of determination and the adjusted coefficient of
determination. Interpret the meaning of the coefficient of determination.
e. Test the significance of the relationship among the variables at the 5% level of
significance.

The sample mean is the point estimator of
a.
b.
c.
d.
Exhibit 21-2
A simple random sample of 43 elements has been selected from a population of size
800. The sample mean is 500, and the sample standard deviation is 60.
Refer to Exhibit 21-2. An approximate 95% confidence interval for the population total
is
a. 482 to 517
b. 385,759 to 414,241
c. 400,000 to 500,000
d. 350,000 to 450,000
Exhibit 12-3
In order to determine whether or not a particular medication was effective in curing the
common cold, one group of patients was given the medication, while another group
received sugar pills. The results of the study are shown below.
We are interested in determining whether or not the medication was effective in curing
the common cold.
Refer to Exhibit 12-3. The test statistic is
a. 10.08
b. 54.02
c. 1.96
d. 1.645