
A population has a mean of 53 and a standard deviation of 21. A sample of 49
observations will be taken. The probability that the sample mean will be greater than
57.95 is
a. 0
b. .0495
c. .4505
d. None of the alternative answers is correct.
A sequence of decisions and chance outcomes that provide the optimal solution to a
decision problem is called
a. a payoff table
b. the expected value approach
c. a decision strategy
d. a contingency plan
Exhibit 5-5
AMR is a computer-consulting firm. The number of new clients that they have obtained
each month has ranged from 0 to 6. The number of new clients has the probability
distribution that is shown below.
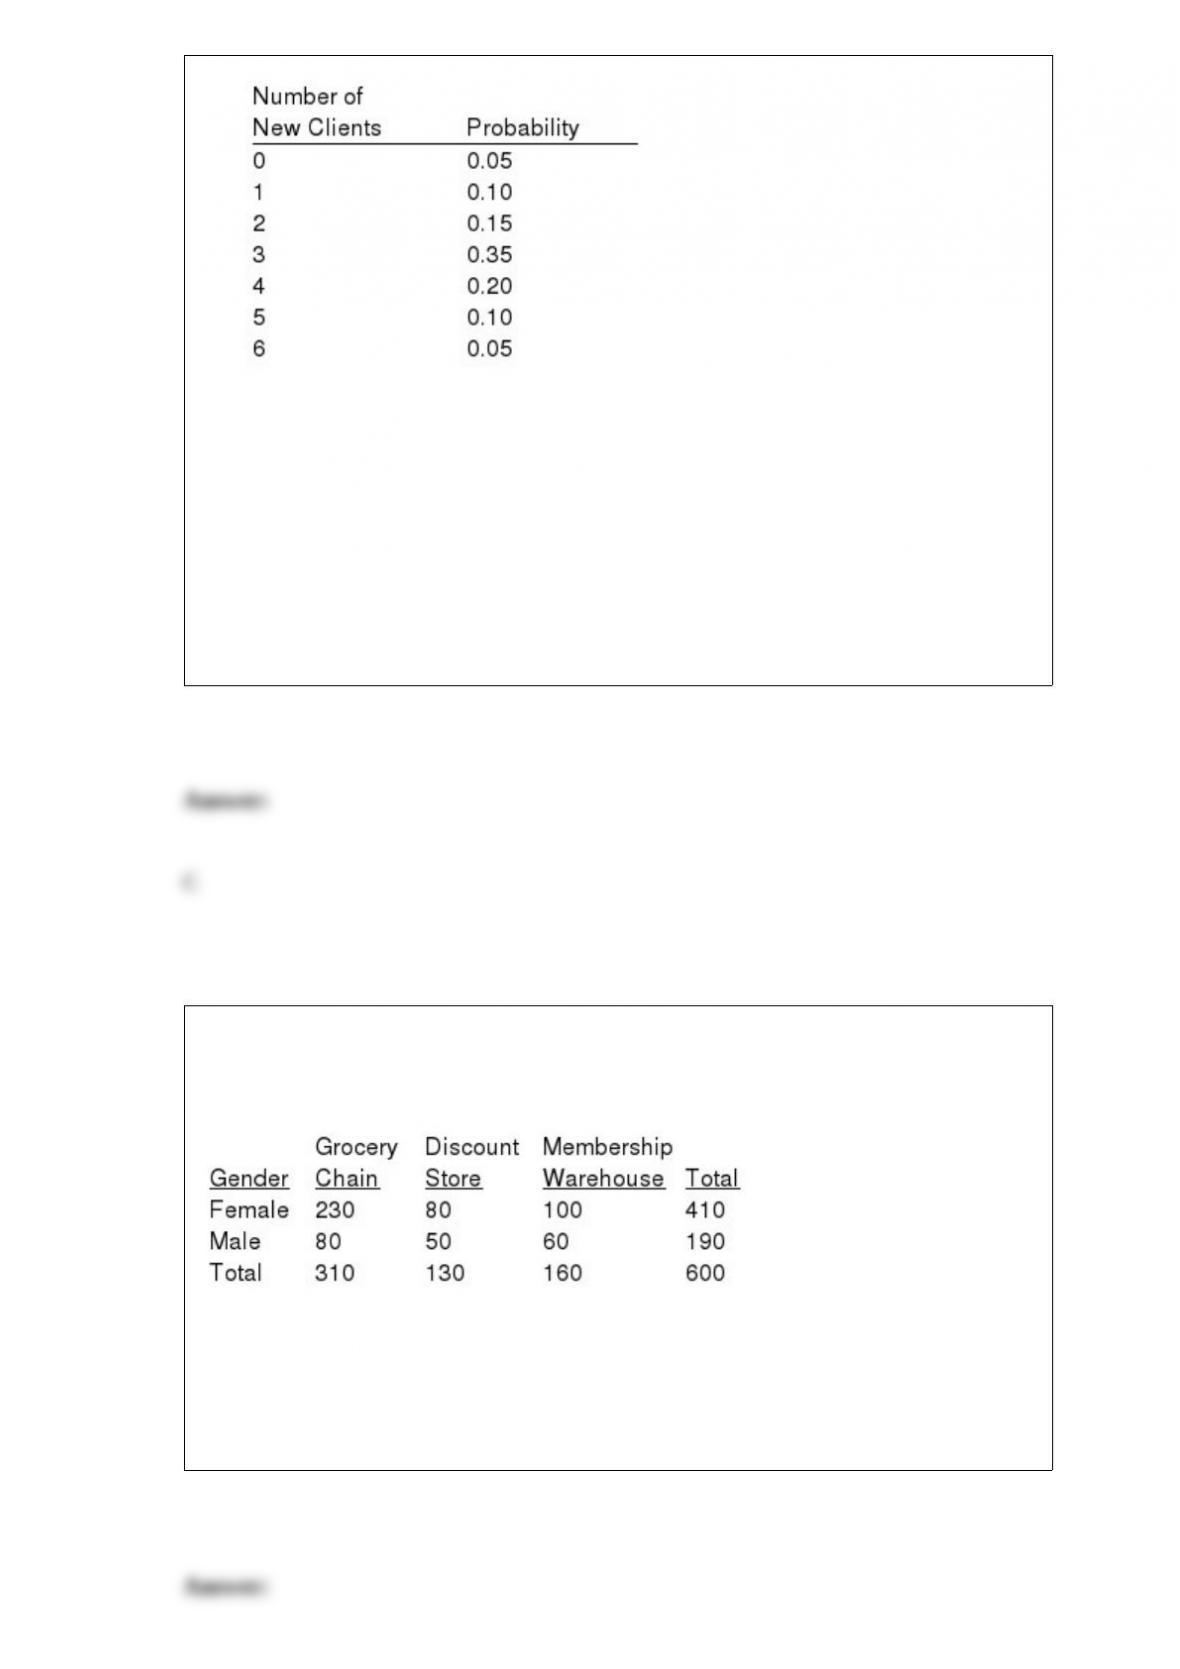
Refer to Exhibit 5-5. The expected number of new clients per month is
a. 6
b. 0
c. 3.05
d. 21
Shoppers were asked where they do their regular grocery shopping. The table below
shows the responses of the sampled shoppers. We are interested in determining if the
proportions of females in the three categories are different from each other.
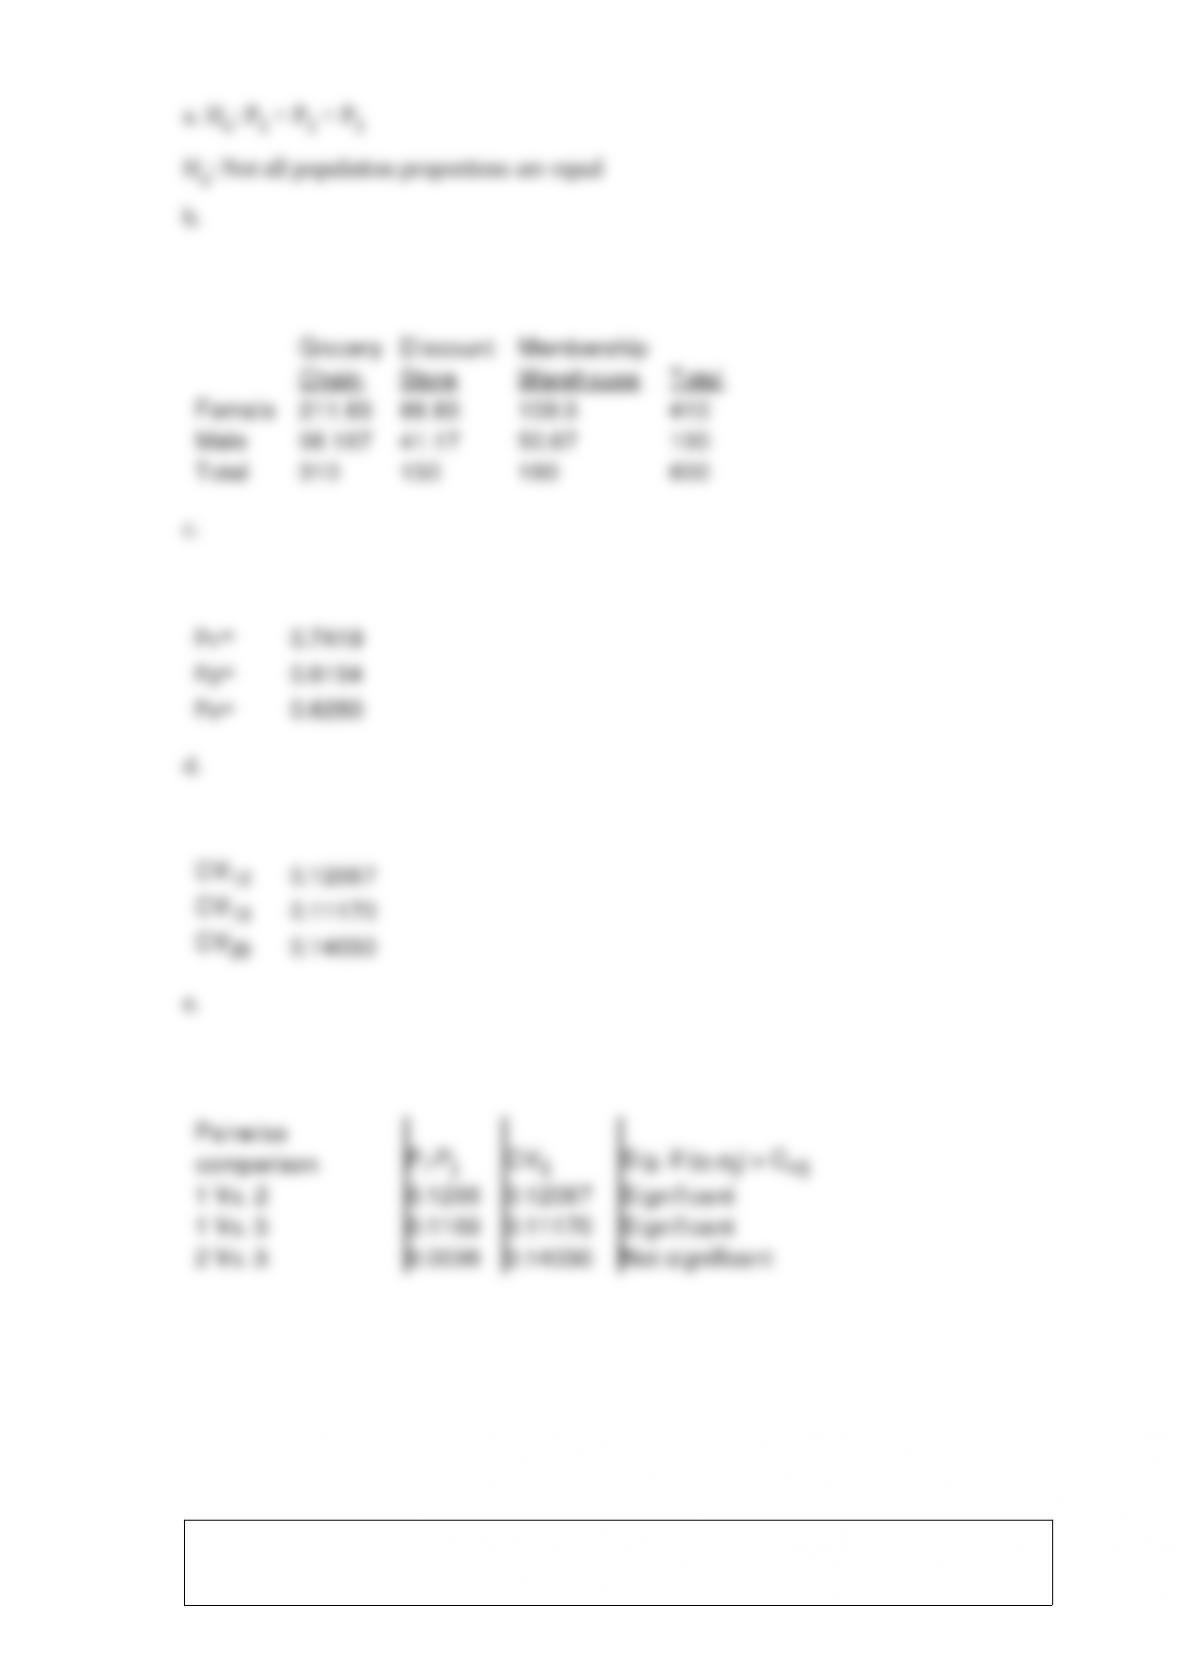
a. Provide the null and the alternative hypotheses.
b. Determine the expected frequencies.
c. Compute the sample proportions.
d. Compute the critical values (CVij).
e. Give your conclusions by providing numerical reasoning.
A graphical display of the relationship between two quantitative variables is
a. a pie chart

b. a histogram
c. a crosstabulation
d. a scatter diagram
A seasonal pattern
a. can occur within a day
b. can take more than a year to repeat itself
c. is a multi-year run of observations above and below the trend line
d. reflects a shift in the time series over time
A random sample of 31 charge sales showed a sample standard deviation of $50. A 90%
confidence interval estimate of the population standard deviation is
a. 1,715.10 to 4,055.68
b. 1,596.45 to 4,466.73
c. 39.96 to 66.83
d. 41.39 to 63.68
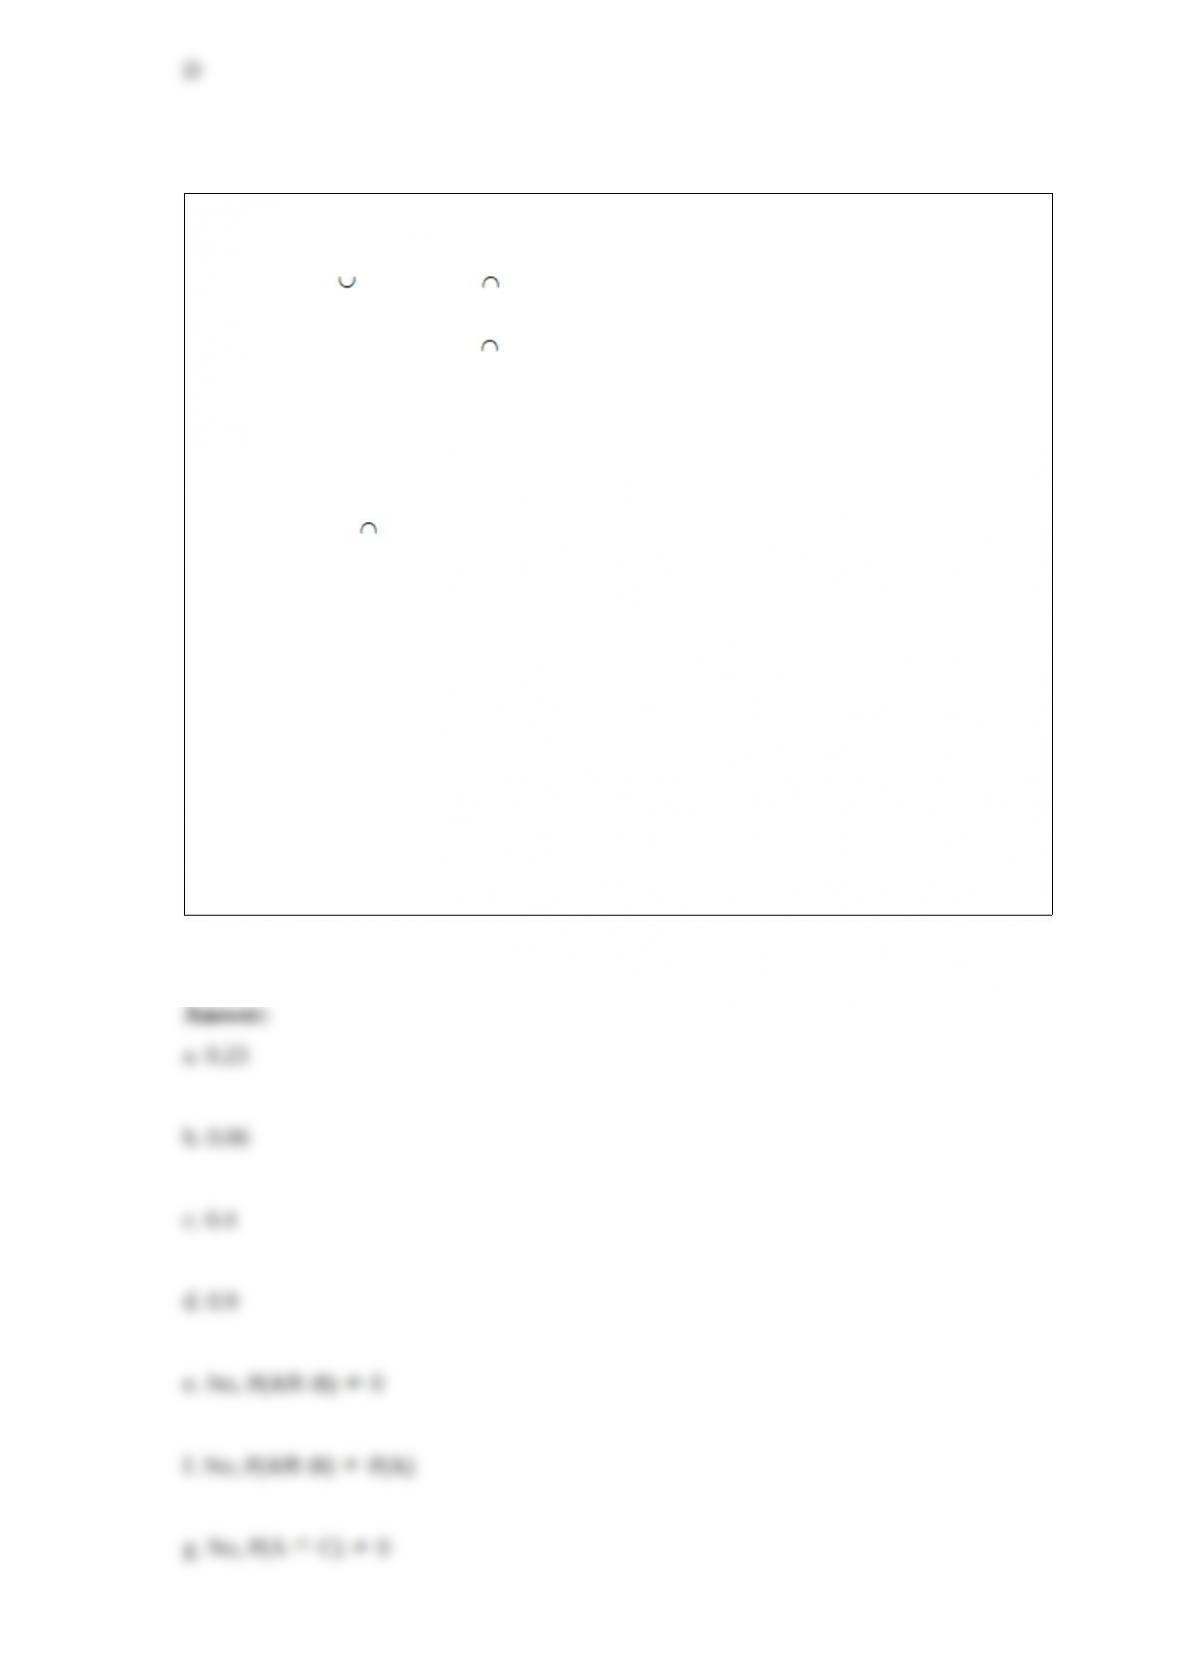
You are given the following information on Events A, B, C, and D.
P(A) .4 P(A D) .6 P(A C) .04
P(B) .2 P(AB) .3 P(A D) .03
P(C) .1
a. Compute P(D).
b. Compute P(A B).
c. Compute P(AC).
d. Compute the probability of the complement of C.
e. Are A and B mutually exclusive? Explain your answer.
f. Are A and B independent? Explain your answer.
g. Are A and C mutually exclusive? Explain your answer.
h. Are A and C independent? Explain your answer.

The correct relationship between SST, SSR, and SSE is given by
a. SSR = SST + SSE
b. SSR = SST – SSE
c. SSE = SSR – SST
d. None of these alternatives is correct.
A regression analysis between sales (in $1000) and price (in dollars) resulted in the
following equation
50,000 8x
The above equation implies that an
a. increase of $1 in price is associated with a decrease of $8 in sales
b. increase of $8 in price is associated with an increase of $8,000 in sales
c. increase of $1 in price is associated with a decrease of $42,000 in sales
d. increase of $1 in price is associated with a decrease of $8000 in sales

John parks cars at a hotel. On the average, 6.7 cars will arrive in an hour. Assume that a
driver’s decision on whether to let John park the car does not depend upon any other
person’s decision. Define the random variable x to be the number of cars arriving in any
hour period.
a. What is the appropriate probability distribution for x? Explain how x satisfies the
properties of the distribution.
b. Compute the probability that exactly 5 cars will arrive in the next hour.
c. Compute the probability that no more than 5 cars will arrive in the next hour.
Exhibit 6-1
Consider the continuous random variable x, which has a uniform distribution over the
interval from 20 to 28.
Refer to Exhibit 6-1. The mean of x is
a. 0.000
b. 0.125
c. 23
d. 24

Excel’s __________ function can be used to compute the sample variance.
a. MAX
b. MODE
c. VAR
d. STDEV
The producer of a certain medicine claims that their bottling equipment is very accurate
and that the standard deviation of all their filled bottles is 0.1 ounce or less. A sample of
20 bottles showed a standard deviation of 0.11. The test statistic to test the claim is
a. 400
b. 22.99
c. 4.85
d. 20
A method of assigning probabilities that assumes the experimental outcomes are equally
likely is referred to as the
a. objective method
b. classical method
c. subjective method
d. experimental method
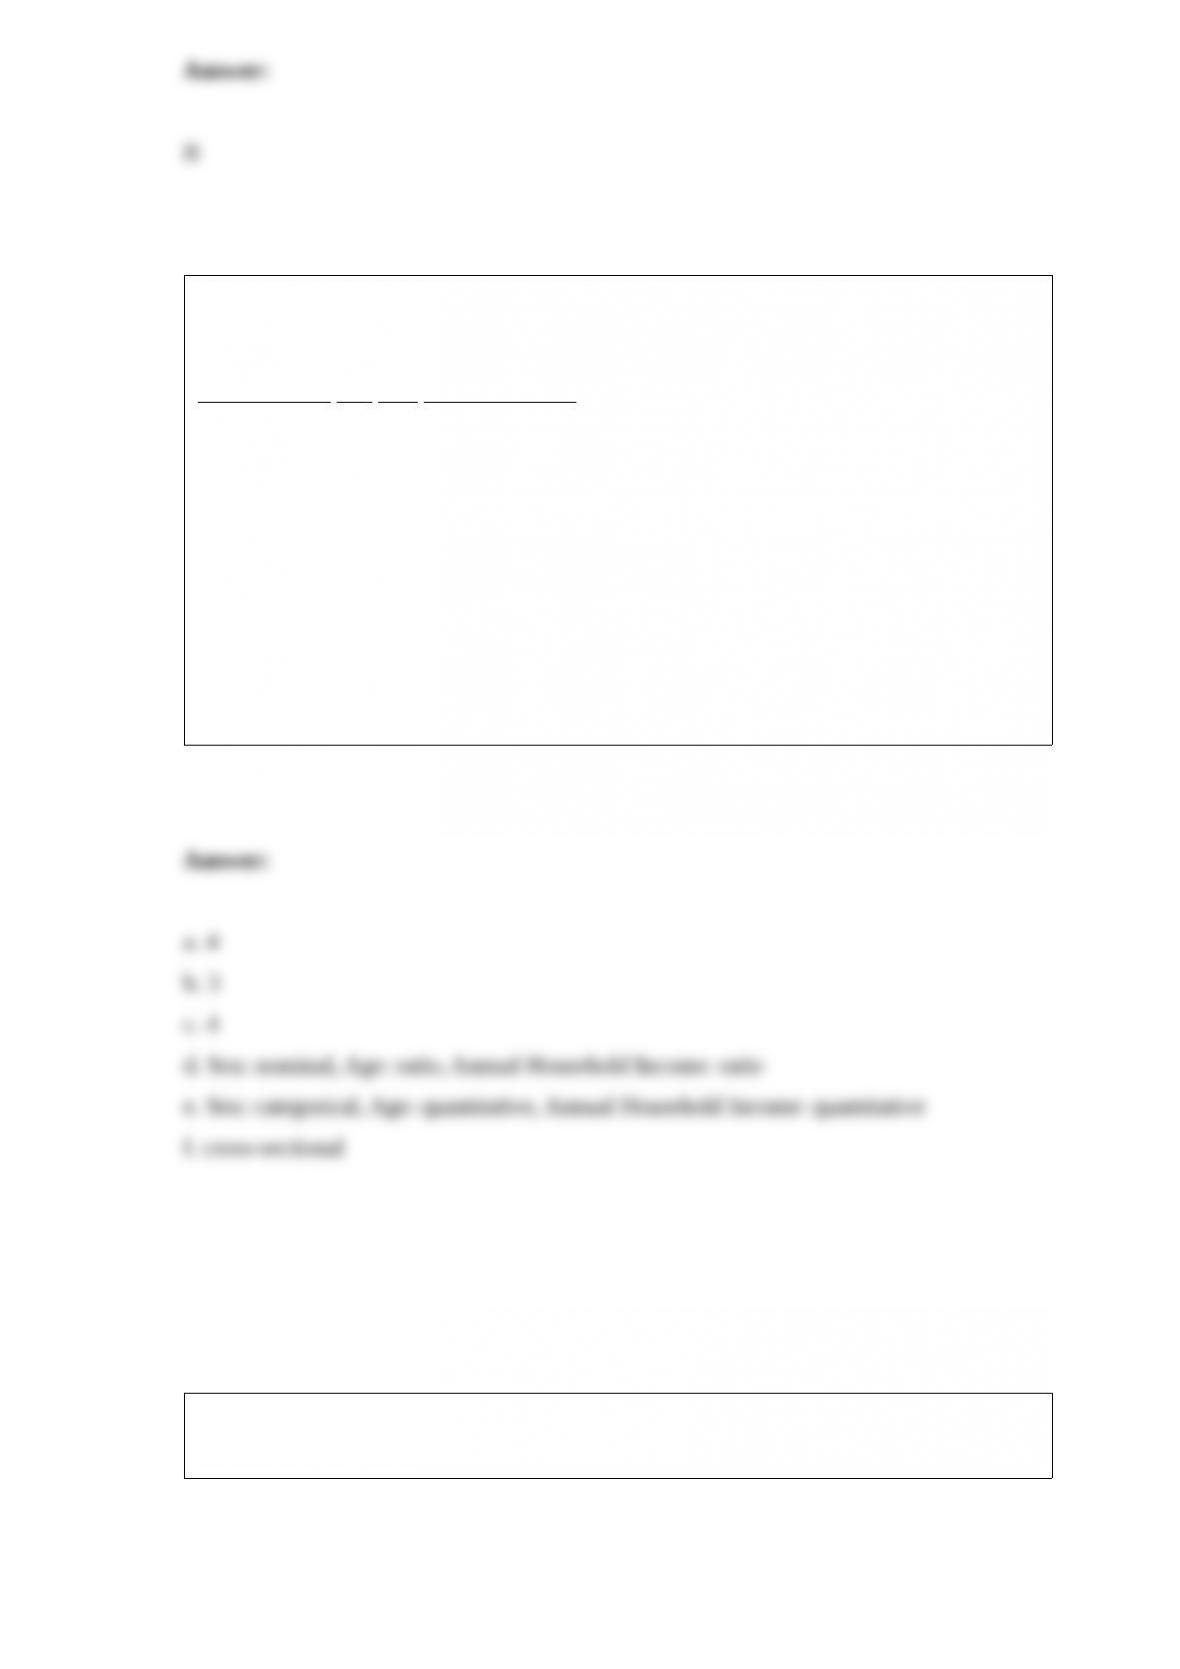
A magazine surveyed a sample of its subscribers. Some of the responses from the
survey are shown below.
Annual Household
Subscriber ID Sex Age Income ($1000)
0006 F 22 45
4798 M 21 53
2291 F 33 82
4988 M 38 30
a. How many elements are in the data set?
b. How many variables are in the data set?
c. How many observations are in the data set?
d. Name the scale of measurement for each of the variables.
e. Which of the above (Sex, Age, Annual Household Income) are categorical and which
are quantitative?
f. Are the data time series or cross-sectional?
Exhibit 13-6
Part of an ANOVA table is shown below.
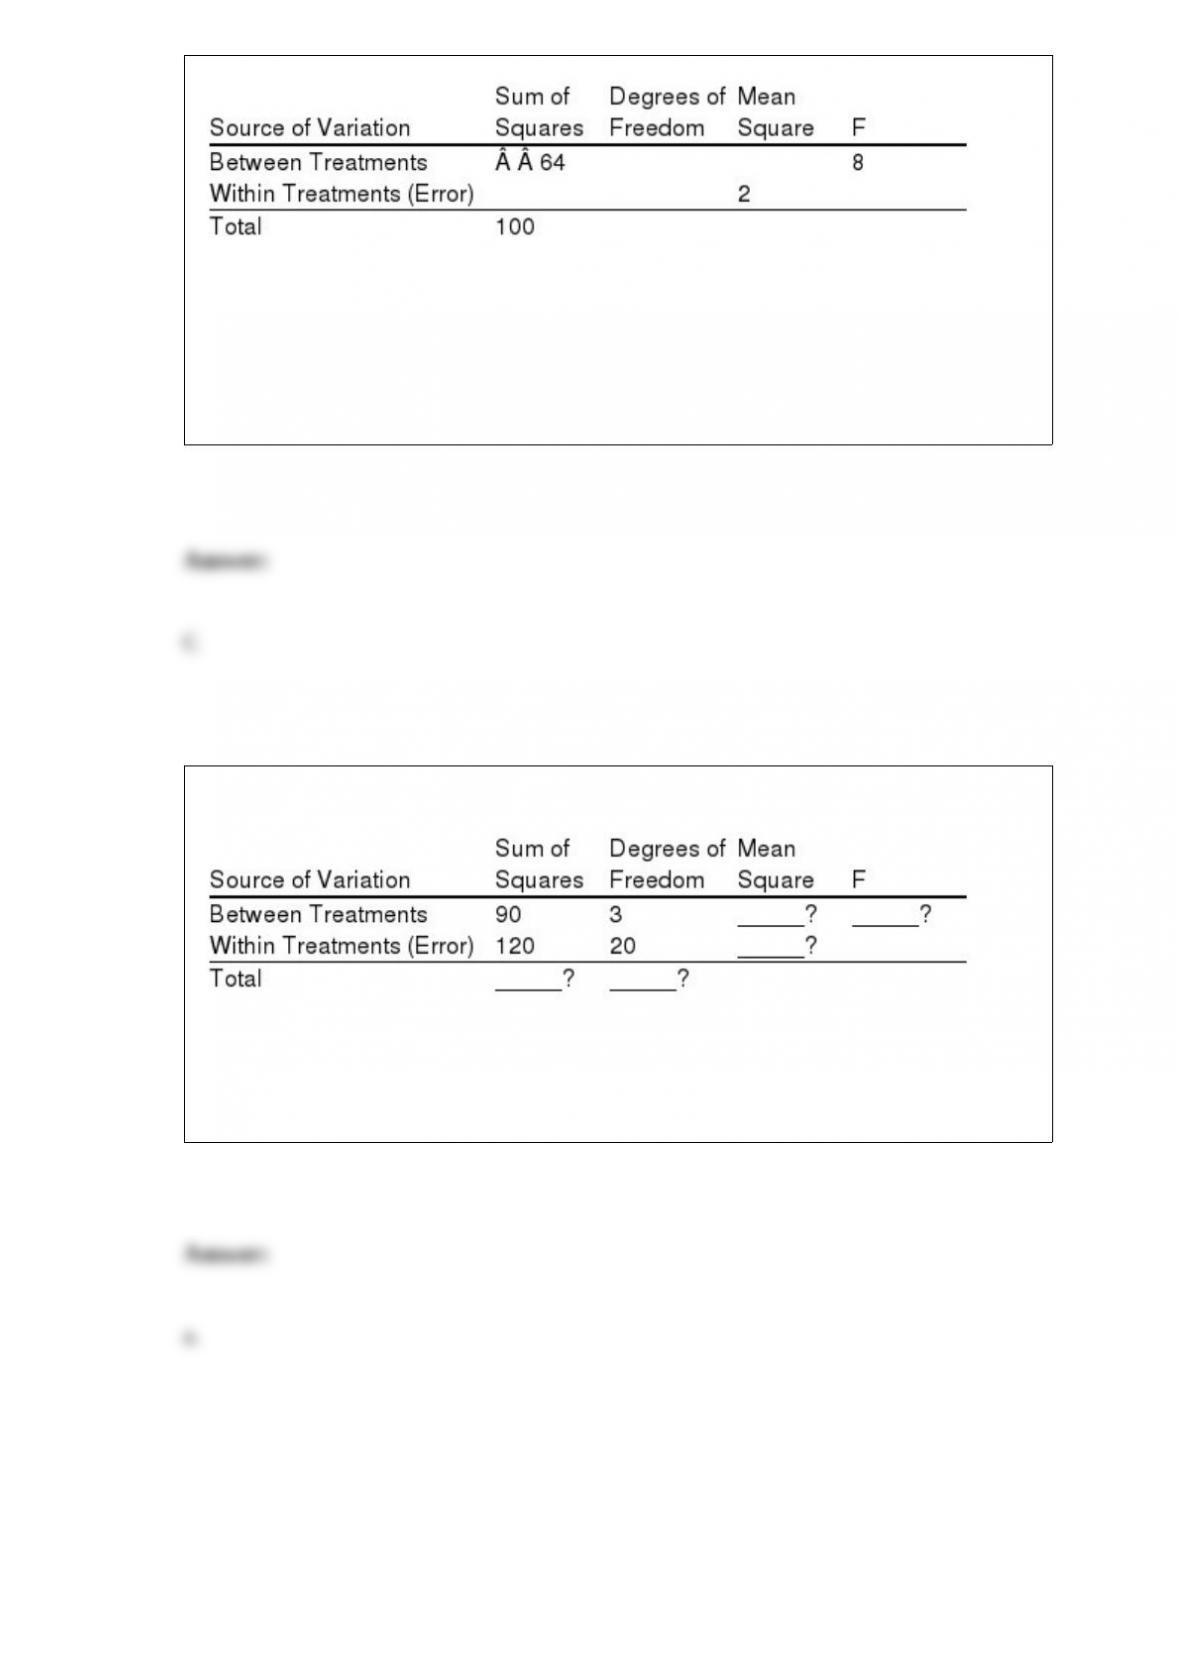
Refer to Exhibit 13-6. The number of degrees of freedom corresponding to between
treatments is
a. 18
b. 2
c. 4
d. 3
Part of an ANOVA table is shown below.
a. Compute the missing values and fill in the blanks in the above table. Use = .01 to
determine if there is any significant difference among the means.
b. How many groups have there been in this problem?
c. What has been the total number of observations?
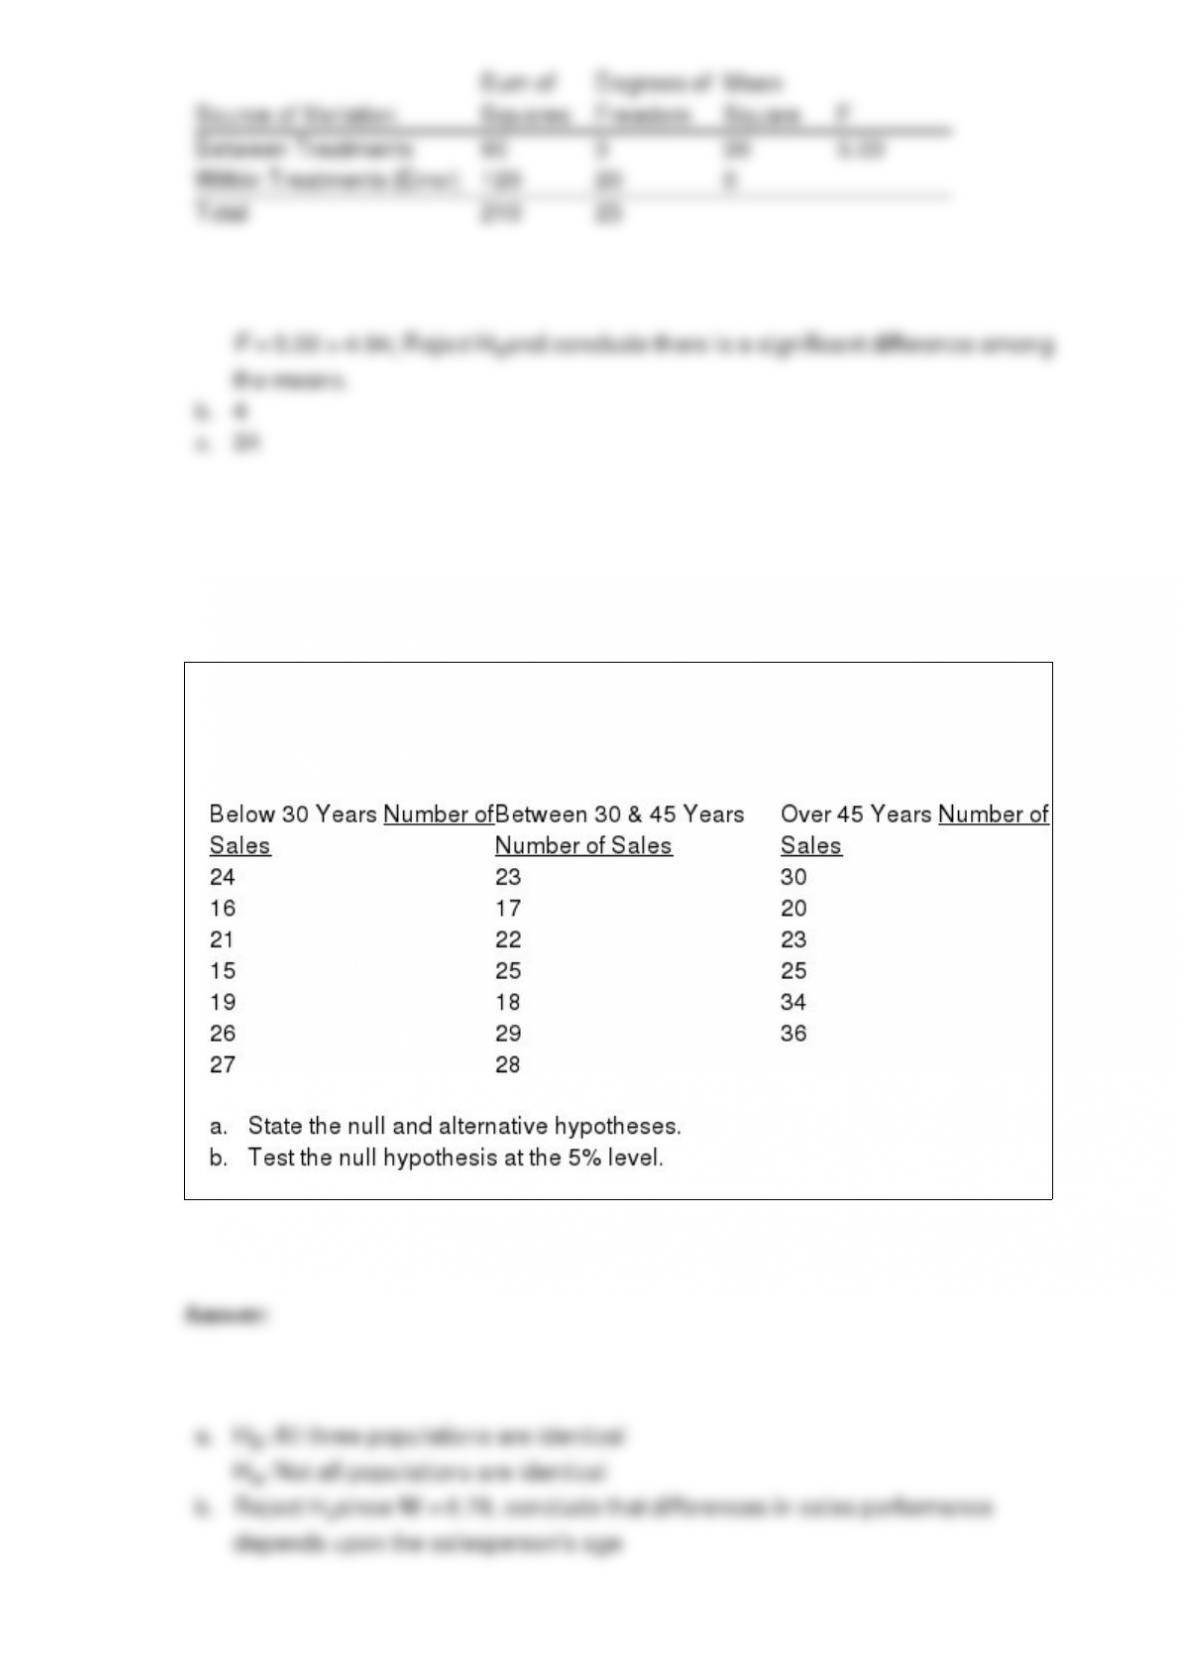
The manager of a company believes that differences in sales performance depend upon
the salesperson’s age. Independent samples of salespeople were taken and their weekly
sales record is reported below.