
A multiple regression model has
a. only one independent variable
b. more than one dependent variable
c. more than one independent variable
d. at least 2 dependent variables
When the conclusions based upon the aggregated crosstabulation can be completely
reversed if we look at the unaggregated data, the occurrence is known as
a. reverse correlation
b. inferential statistics
c. Simpson’s paradox
d. disaggregation
For data skewed to the left, the skewness is
a. between 0 and .5
b. less than 1
c. positive
d. negative
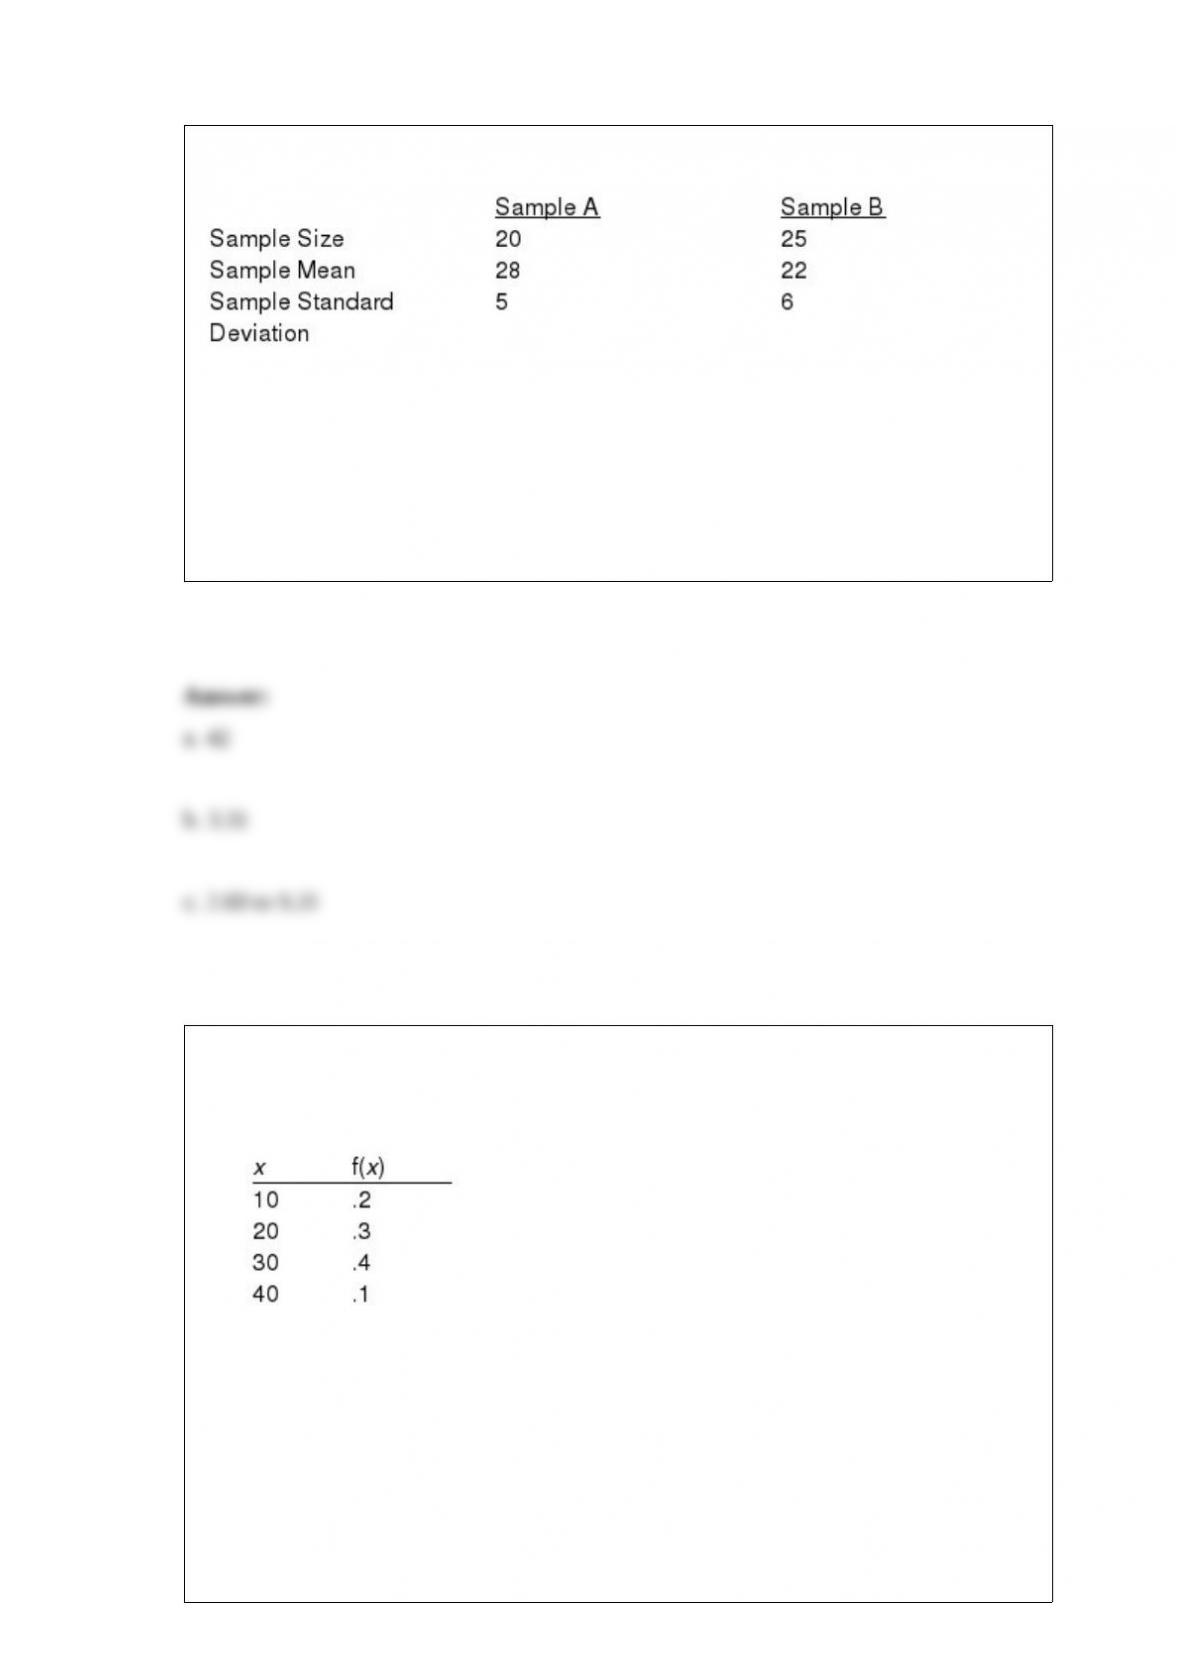
Consider the following results for two samples randomly taken from two populations.
a. Determine the degrees of freedom for the t distribution.
b. At 95% confidence, what is the margin of error?
c. Develop a 95% confidence interval for the difference between the two population
means.
Exhibit 5-6
Probability Distribution
Refer to Exhibit 5-6. The expected value of x equals
a. 24
b. 25
c. 30

d. 100
The sample result plotted on a p chart is the
a. proportion non-defective
b. passing (inspection) percentage
c. proportion defective
d. number of defectives
Exhibit 16-2
In a regression model involving 30 observations, the following estimated regression
equation was obtained.
= 170 + 34x1 – 3x2 + 8x3 + 58x4 + 3x5
For this model, SSR = 1,740 and SST = 2,000.
Refer to Exhibit 16-2. The degrees of freedom associated with SST are
a. 24
b. 6
c. 19
d. None of these alternatives is correct.
Since a sample is a subset of the population, a percentage that is calculated from the
sample data
a. is always smaller than the corresponding percentage from the population
b. is always larger than the corresponding percentage from the population
c. must be equal to the corresponding percentage from the population
d. can be larger, smaller, or equal to the corresponding percentage from the population
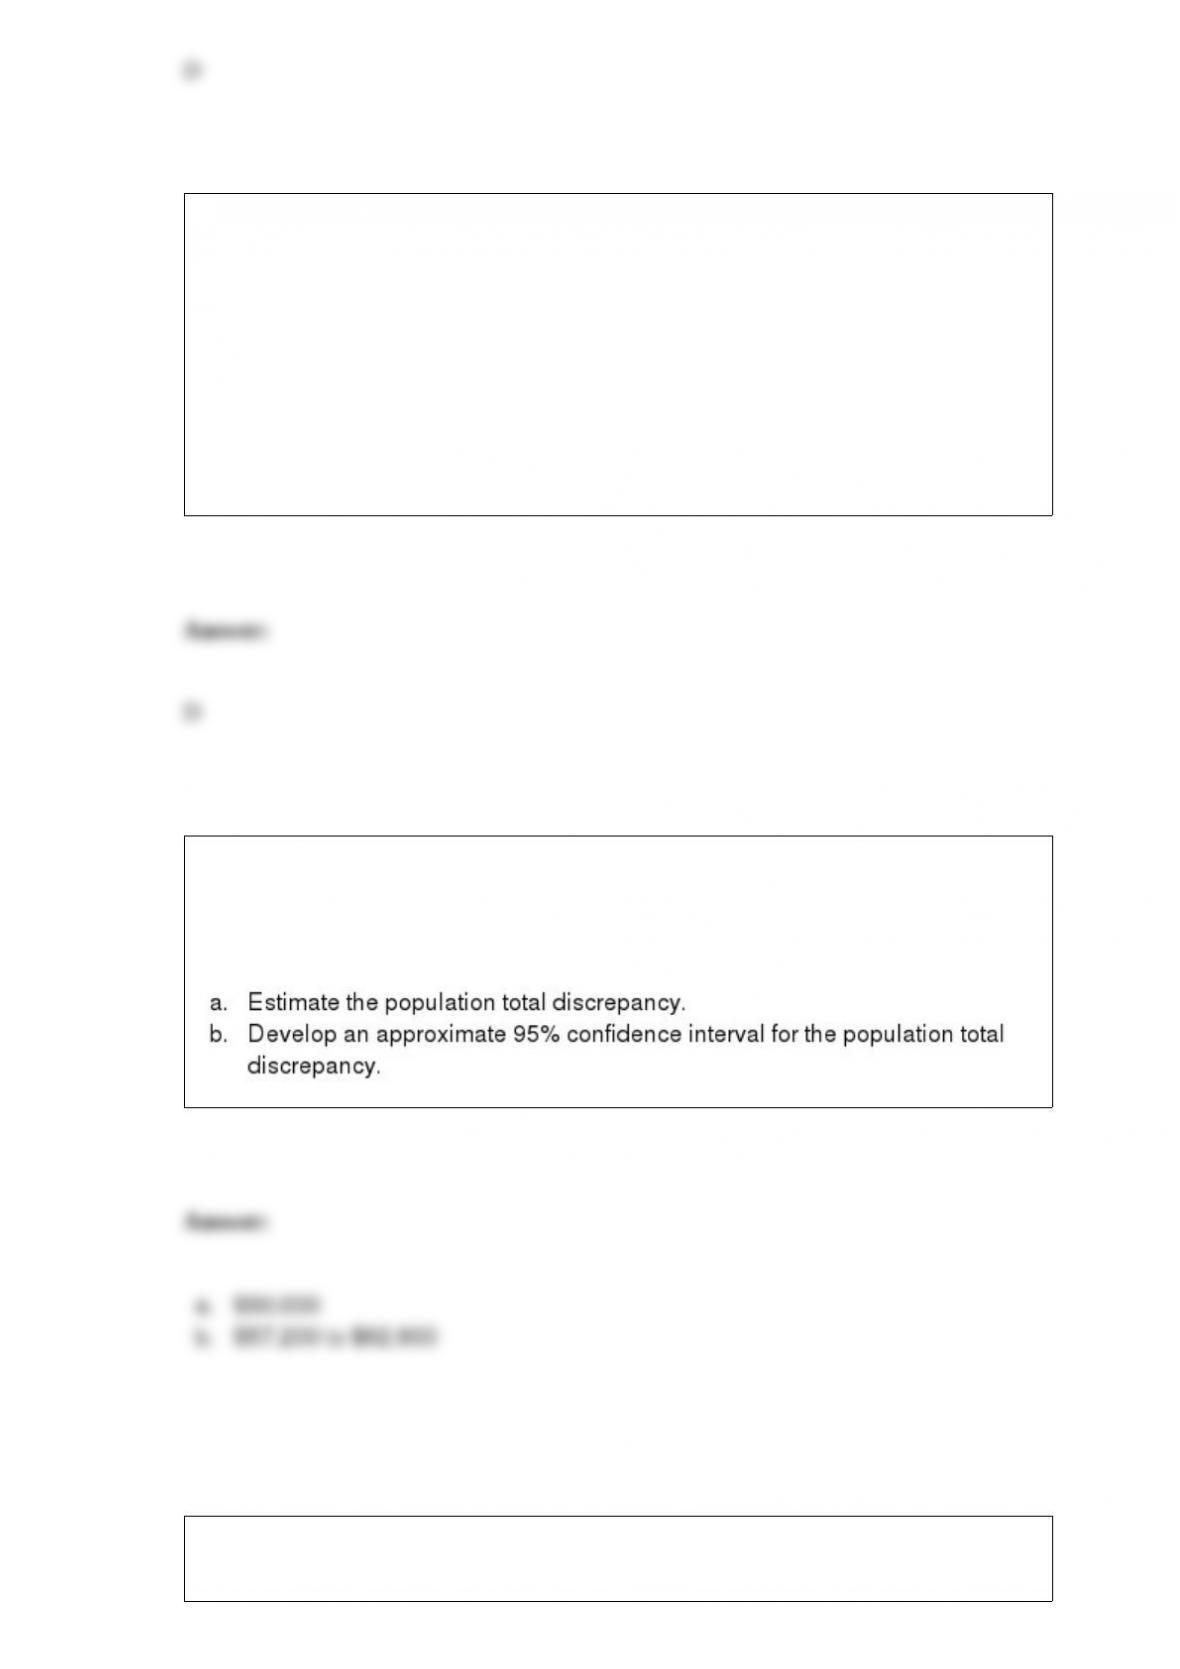
The accounting firm of Nancy Amari & Associates (NAA) was commissioned to audit a
population of 500 accounts. For this audit, NAA selected a simple random sample of 64
accounts. The sample showed an average discrepancy of $120 with a standard deviation
of $2
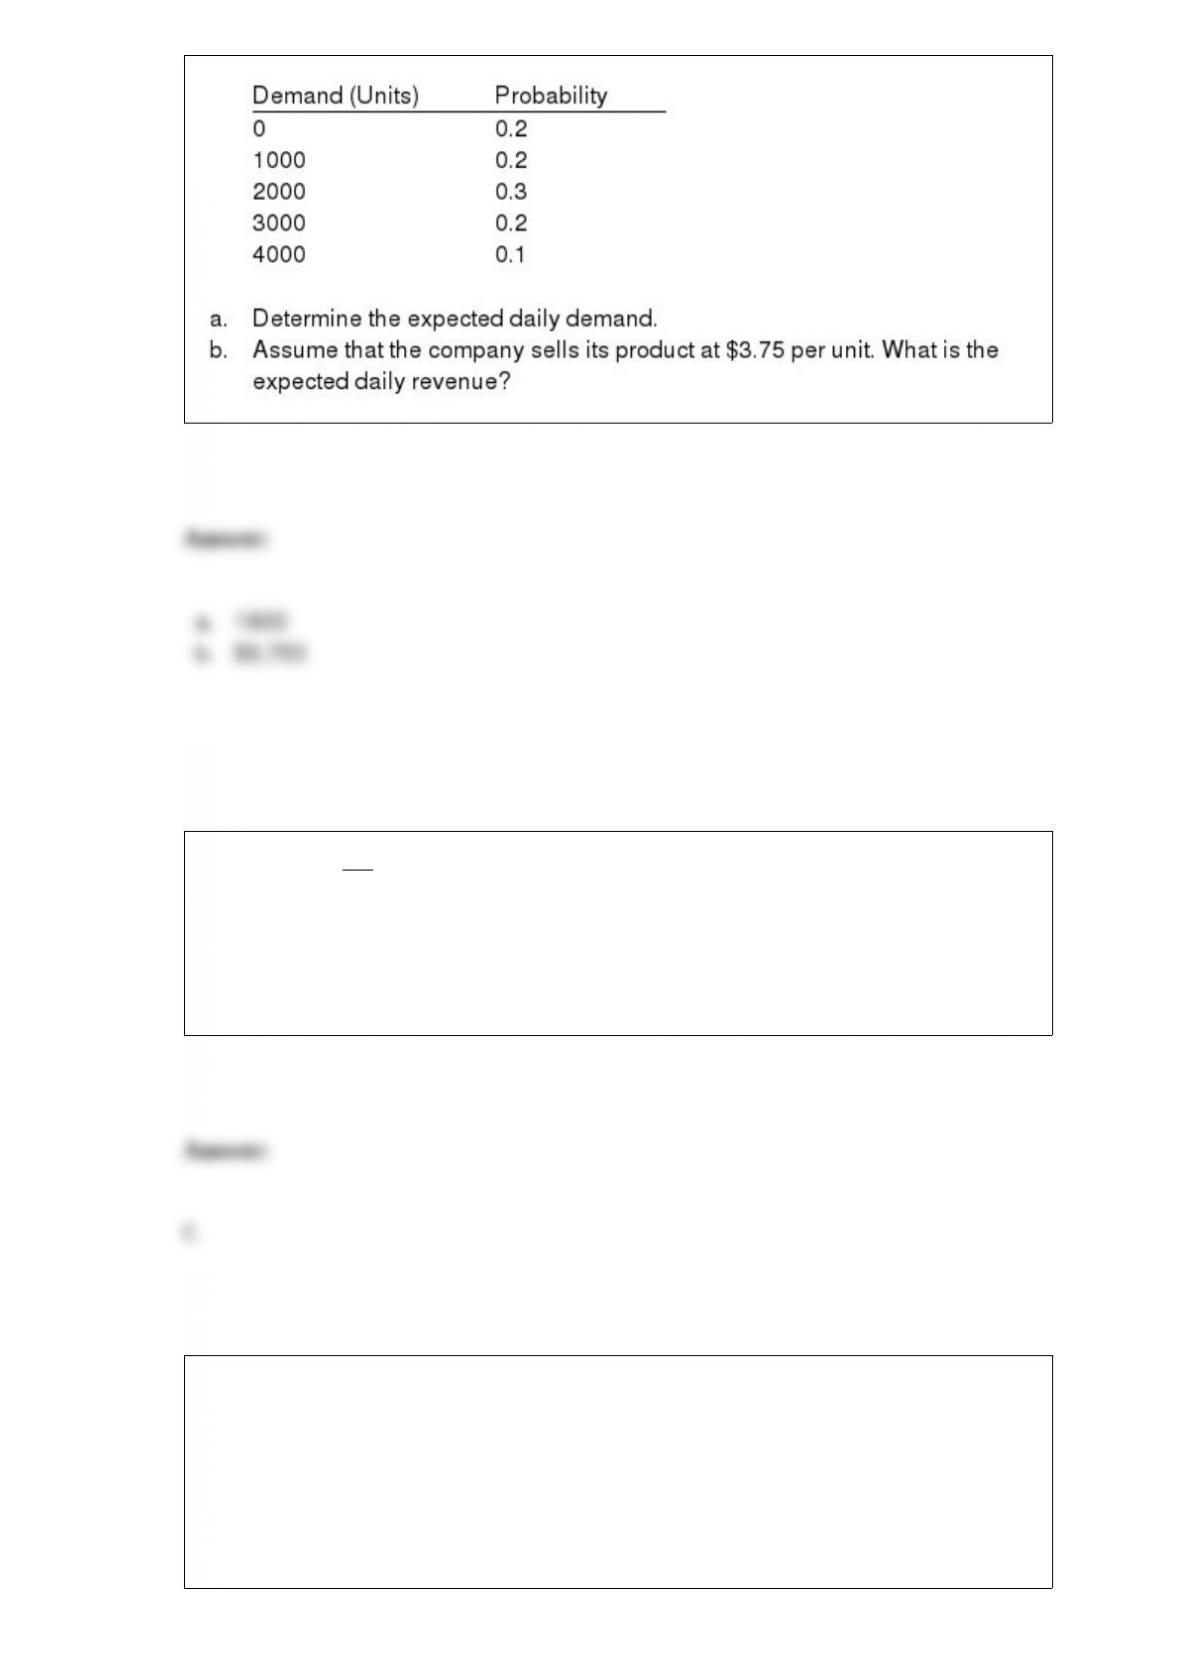
A company sells its products to wholesalers in batches of 1,000 units only. The daily
demand for its product and the respective probabilities are given below.
A histogram is not appropriate for displaying which of the following types of
information?
a. frequency
b. relative frequency
c. cumulative frequency
d. percent frequency
A nonparametric method for determining the differences between two populations
based on two matched samples where only preference data is required is the
a. Mann-Whitney-Wilcoxon test
b. Wilcoxon signed-rank test

c. sign test
d. Kruskal-Wallis Test
A corporation has 15,000 employees. Sixty-two percent of the employees are male.
Twenty-three percent of the employees earn more than $40,000 a year. Eighteen percent
of the employees are male and earn more than $40,000 a year.
a. If an employee is taken at random, what is the probability that the employee is male?
b. If an employee is taken at random, what is the probability that the employee earns
more than $40,000 a year?
c. If an employee is taken at random, what is the probability that the employee is male
and earns more than $40,000 a year?
d. If an employee is taken at random, what is the probability that the employee is male
or earns more than $40,000 a year or both?
e. The employee taken at random turns out to be male. Compute the probability that he
earns more than $40,000 a year.
f. Are being male and earning more than $40,000 a year independent?

A company has 600 employees. A random sample of 49 employees took a computer
literacy test. The sample resulted in a mean score of 75 with a standard deviation of 21.
In a residual plot against x that does not suggest we should challenge the assumptions of
our regression model, we would expect to see
a. a horizontal band of points centered near zero
b. a widening band of points
c. a band of points having a slope consistent with that of the regression equation
d. a parabolic band of points
Exhibit 8-3

A random sample of 81 automobiles traveling on a section of an interstate showed an
average speed of 60 mph. The distribution of speeds of all cars on this section of
highway is normally distributed, with a standard deviation of 13.5 mph.
Refer to Exhibit 8-3. The value to use for the standard error of the mean is
a. 13.5
b. 9
c. 2.26
d. 1.5
If P(A) 0.85, P(A B) 0.72, and P(A B) 0.66, then P(B)
a. 0.15
b. 0.53
c. 0.28
d. 0.15
The units that are selected for sampling constitute the
a. sample
b. population

c. frame
d. sampling unit
Which of the following is(are) point estimator(s)?
a.
b.
c. s
d. All of these answers are correct.
In regression analysis, the variable that is being predicted is the
a. dependent variable
b. independent variable
c. intervening variable
d. None of these answers is correct.

In multiple regression analysis, the word ‘œlinear’ in the term “general linear model”
refers to the fact that
a. 0, 1, . . . p, all have exponents of 0
b. 0, 1, . . . p, all have exponents of 1
c. 0, 1, . . . p, all have exponents of at least 1
d. 0, 1, . . . p, all have exponents of less than 1
Exhibit 16-1
In a regression analysis involving 25 observations, the following estimated regression
equation was developed.
= 10 – 18x1 + 3x2 + 14x3
Also, the following standard errors and the sum of squares were obtained.
Sb1 = 3 Sb2 = 6 Sb3 = 7
SST = 4,800 SSE = 1,296
Refer to Exhibit 16-1. The multiple coefficient of determination is
a. 0.27
b. 0.73
c. 0.50
d. 0.33