Accepting a good-quality lot would be a
a. Type I error
b. Type II error
c. correct decision
d. None of the other answers is correct.
The skewness measure for the exponential distributions is
a. 0
b. 1
c. 2
d. 3
A recent Time magazine reported the following information about a sample of workers
in Germany and the United States.
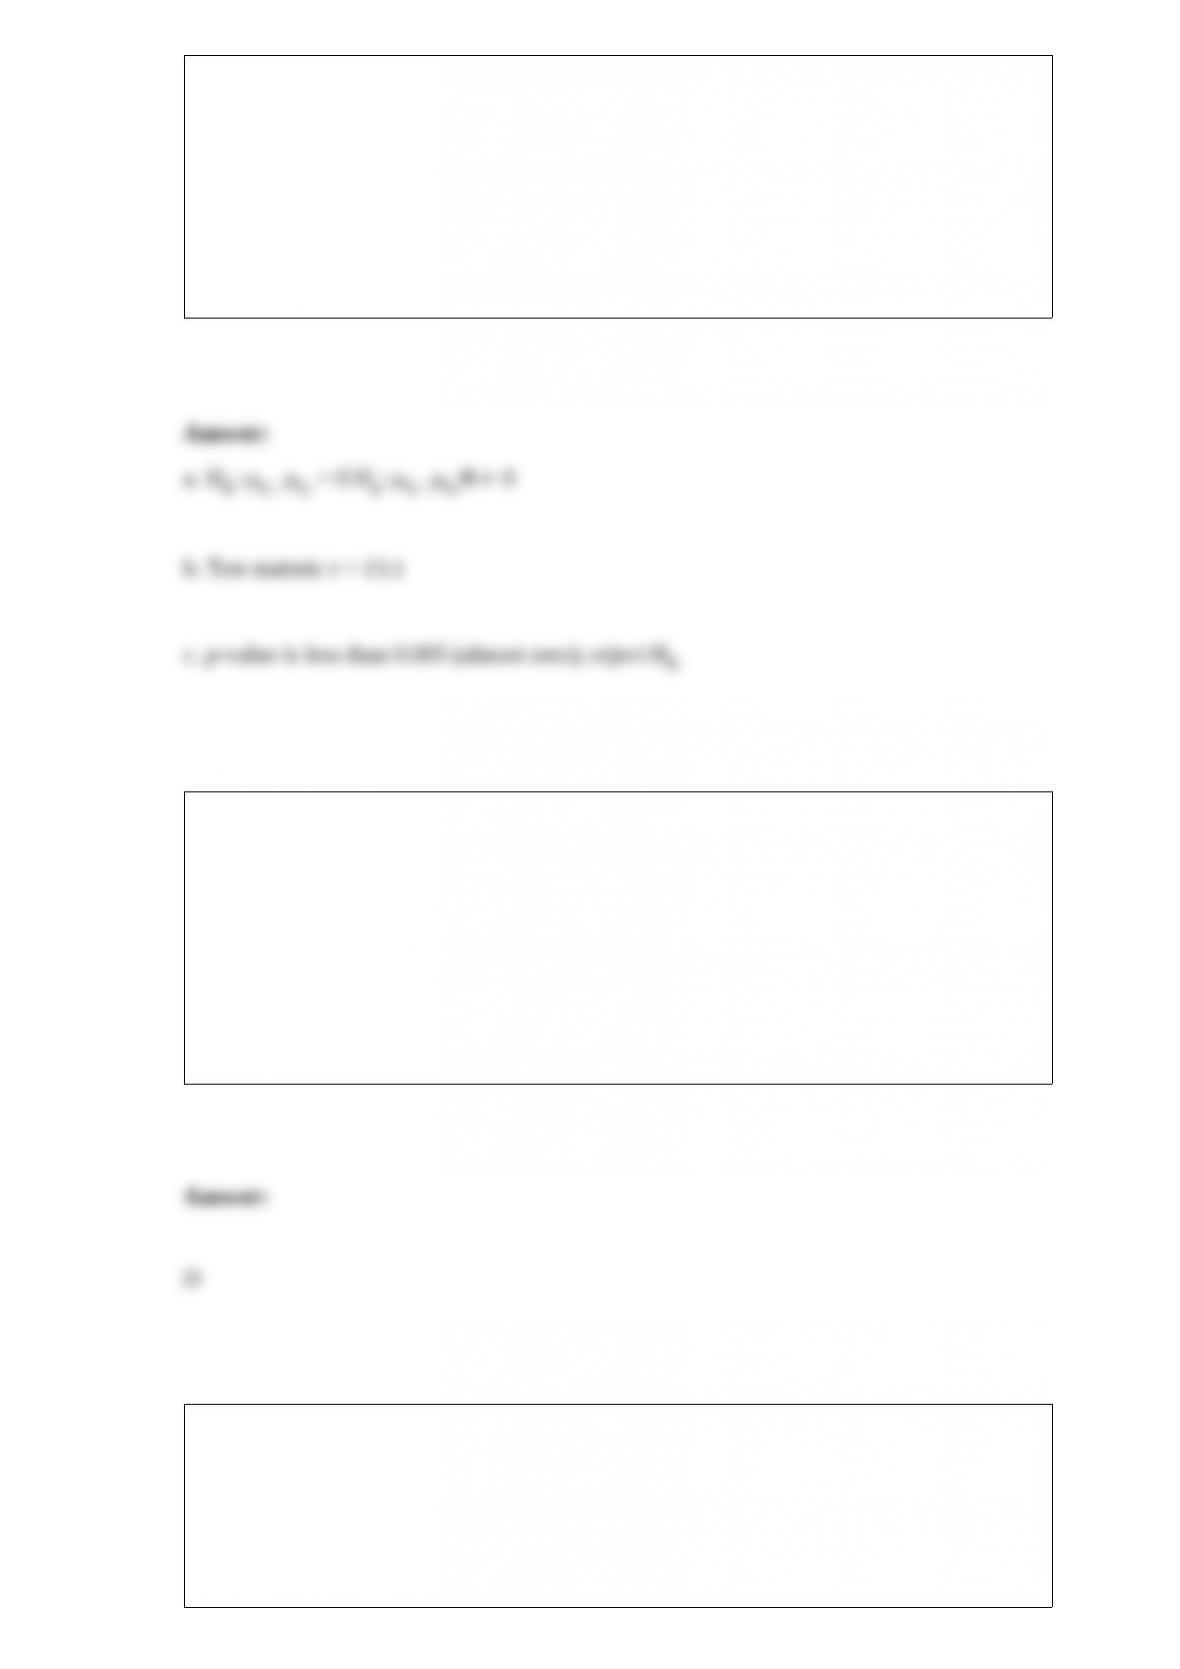
We want to determine whether or not there is a significant difference between the
average workweek in the United States and the average workweek in Germany.
a. State the null and the alternative hypotheses.
b. Compute the test statistic.
c. Compute the p-value. What is your conclusion?
The numerical value of the coefficient of determination
a. is always larger than the coefficient of correlation
b. is always smaller than the coefficient of correlation
c. is negative if the coefficient of determination is negative
d. can be larger or smaller than the coefficient of correlation
In order to test for the significance of a regression model involving 3 independent
variables and 47 observations, the numerator and denominator degrees of freedom
(respectively) for the critical value of F are
a. 47 and 3

b. 3 and 47
c. 2 and 43
d. 3 and 43
When the data are labels or names used to identify an attribute of the elements, the
variable has which scale of measurement?
a. nominal
b. ordinal
c. interval
d. ratio
In a binomial experiment consisting of five trials, the number of different values that x
(the number of successes) can assume is
a. 2
b. 5
c. 6
d. 10
The control limits for a p chart are how many standard deviations above and below the
proportion defective?
a. one
b. two
c. three
d. four
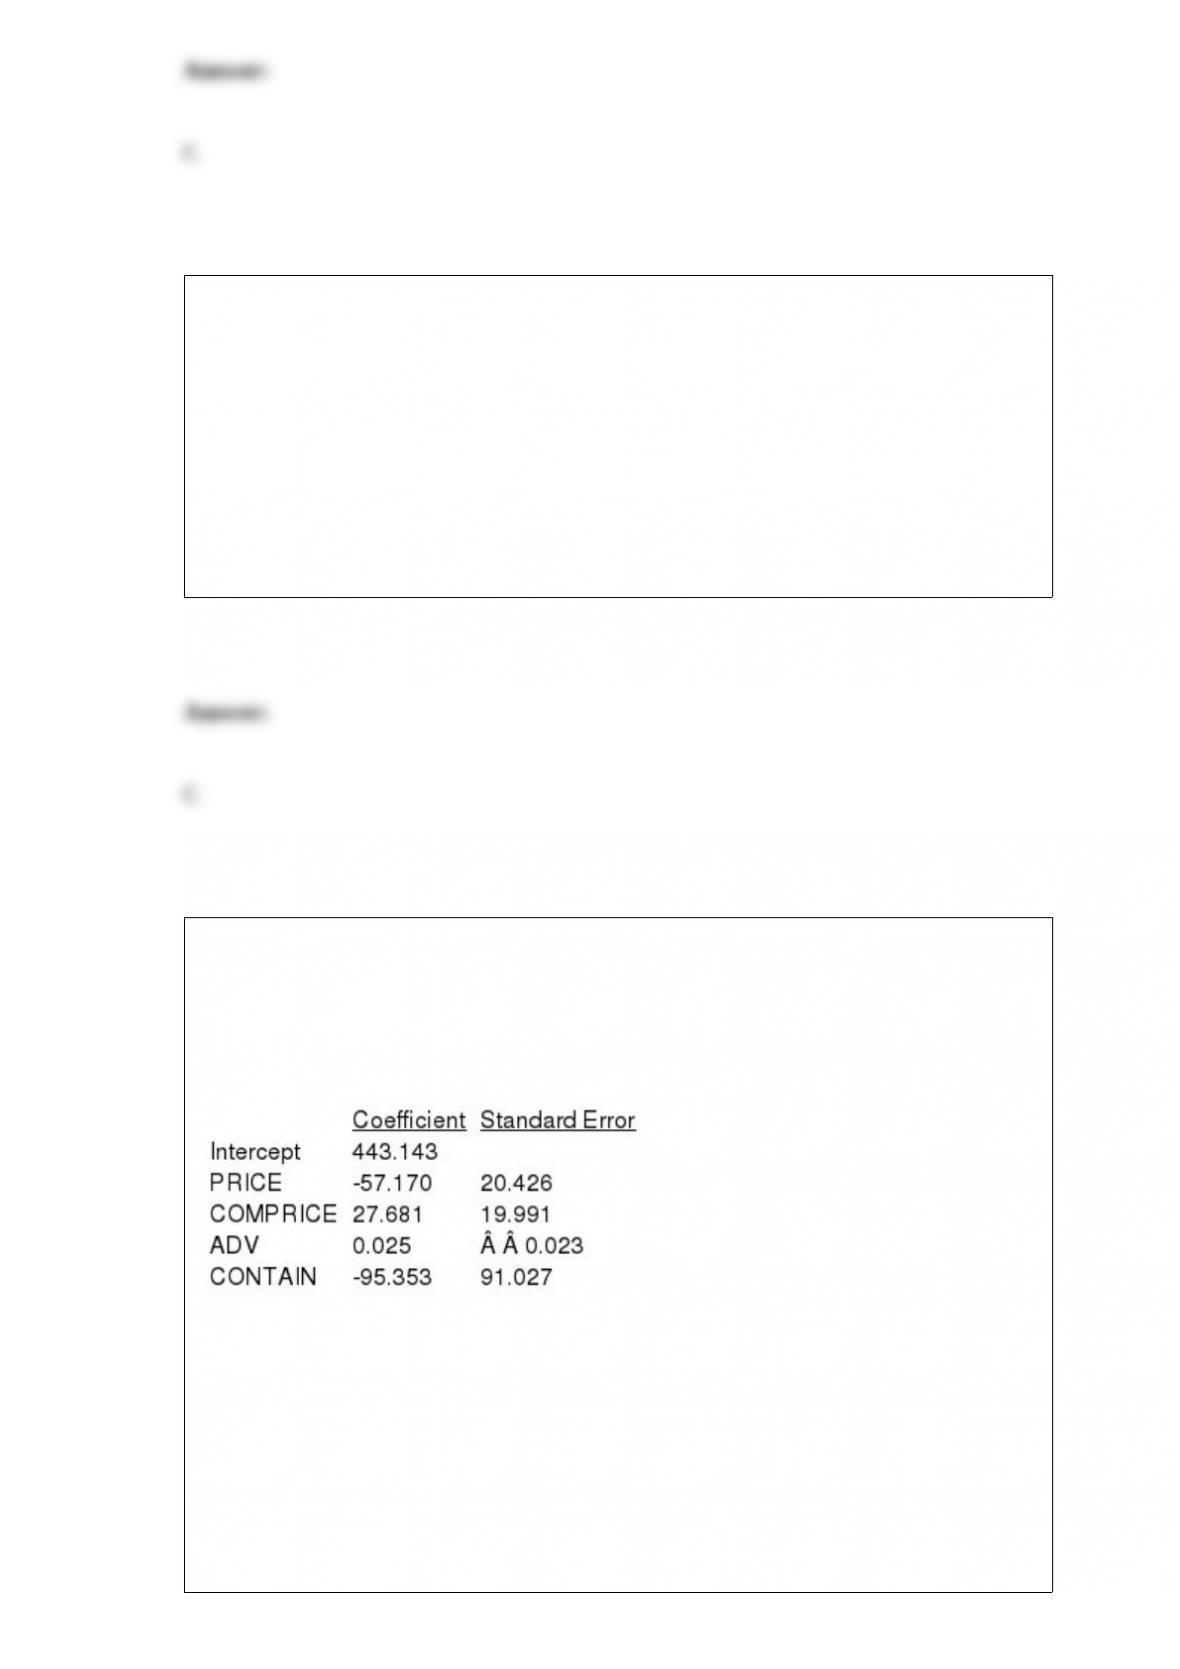
The Natural Drink Company has developed a regression model relating its sales (y in
$10,000s) with four independent variables. The four independent variables are price per
unit (PRICE, in dollars), competitor’s price (COMPRICE, in dollars), advertising (ADV,
in $1,000s) and type of container used (CONTAIN; 1 = Cans and 0 = Bottles). Part of
the regression results is shown below. (Assume n = 25)
a. If the manufacturer uses can containers, his price is $1.25, advertising $200,000, and
his competitor’s price is $1.50, what is your estimate of his sales? Give your answer in
dollars.
b. Test to see if there is a significant relationship between sales and unit price. Let =
0.05.
c. Test to see if there is a significant relationship between sales and advertising. Let =
0.05.
d. Is the type of container a significant variable? Let = 0.05.
e. Test to see if there is a significant relationship between sales and competitor’s price.
Let = 0.05.
95.4% of the values of a normal random variable are within approximately how many
standard deviations of its mean?
a. +/- 1.7
b. +/- 2
c. +/- 2.5
d. +/- 3
The measure of dispersion that is influenced most by extreme values is
a. the variance
b. the standard deviation
c. the range
d. the interquartile range
In a two-tailed hypothesis test, the null hypothesis should be rejected if the p-value is
a. less than or equal to
b. less than or equal to 2
c. greater than or equal to
d. greater than or equal to 2
Which of the following variables use the ratio scale of measurement?
a. name of stock exchange
b. time
c. SAT scores
d. Social Security number
The sum of the relative frequencies in any relative frequency distribution always equals
a. the number of observations
b. 1.00
c. 100
d. the number of variables
Tammy is a general contractor and has submitted two bids for two projects (A and B).
The probability of getting project A is 0.65. The probability of getting project B is 0.77.
The probability of getting at least one of the projects is 0.90.
a. What is the probability that she will get both projects?
b. Are the events of getting the two projects mutually exclusive? Explain, using
probabilities.
c. Are the two events independent? Explain, using probabilities.
If P(A) 0.62, P(B) 0.47, and P(A ˆ B) 0.88; then P(A ‡ B)
a. 0.2914
b. 1.9700

c. 0.6700
d. 0.2100
The bottler of a certain soft drink claims their equipment to be accurate and that the
variance of all filled bottles is 0.05 or less. The null hypothesis in a test to confirm the
claim would be written as
a. Ho: 2 0.05
b. Ho: 2 > 0.05
c. Ho: 2 < 0.05
d. Ho: 2 0.05
When a regression model was developed relating sales (y) of a company to its product’s
price (x1), the SSE was determined to be 495. A second regression model relating sales
(y) to product’s price (x1) and competitor’s product price (x2) resulted in an SSE of 396.
At = 0.05, determine if the competitor’s product’s price contributed significantly to
the model. The sample size for both models was 33.
A sample of 16 students from a large university is taken. The average age in the sample
was 22 years with a standard deviation of 6 years. Construct a 95% confidence interval
for the average age of the population. Assume the population of student ages is
normally distributed.
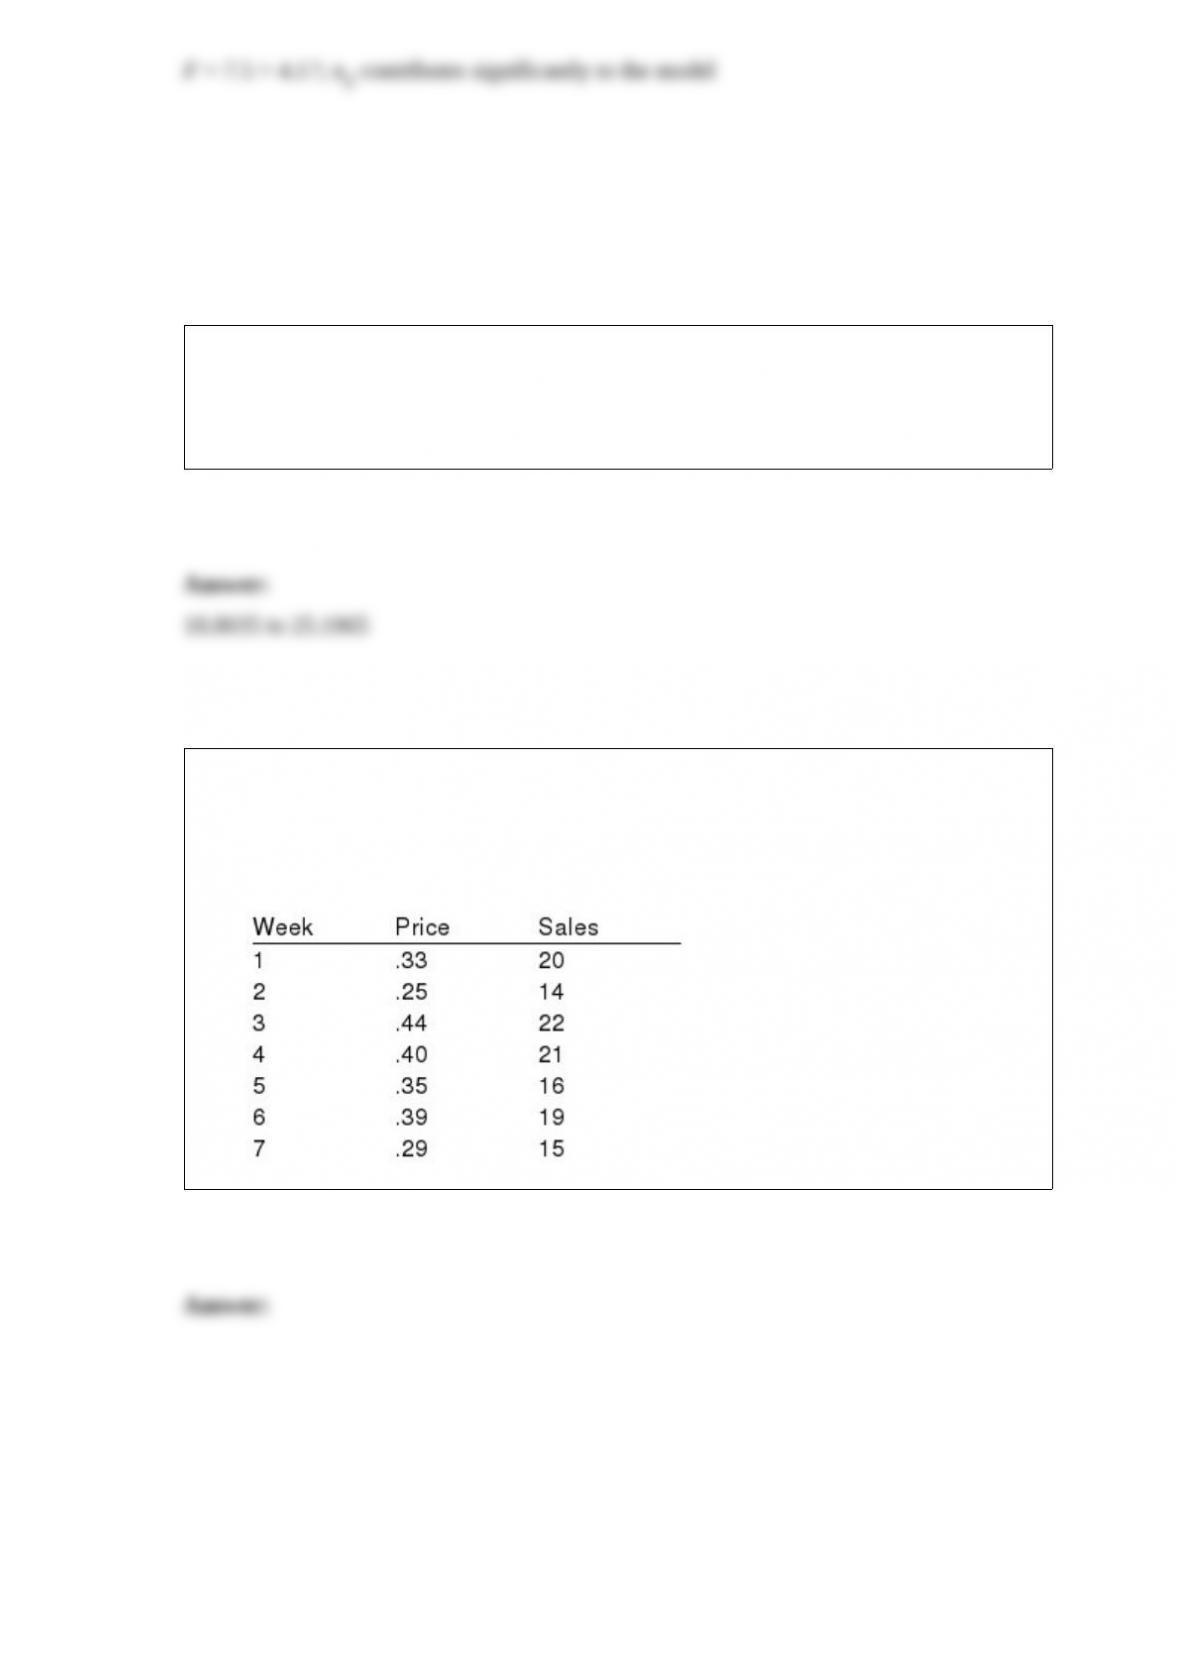
A company has recorded data on the weekly sales for its product (y) and the unit price
of the competitor’s product (x). The data resulting from a random sample of 7 weeks
follows. Use Excel to develop a scatter diagram and to compute the least squares
estimated regression equation and the coefficient of determination.
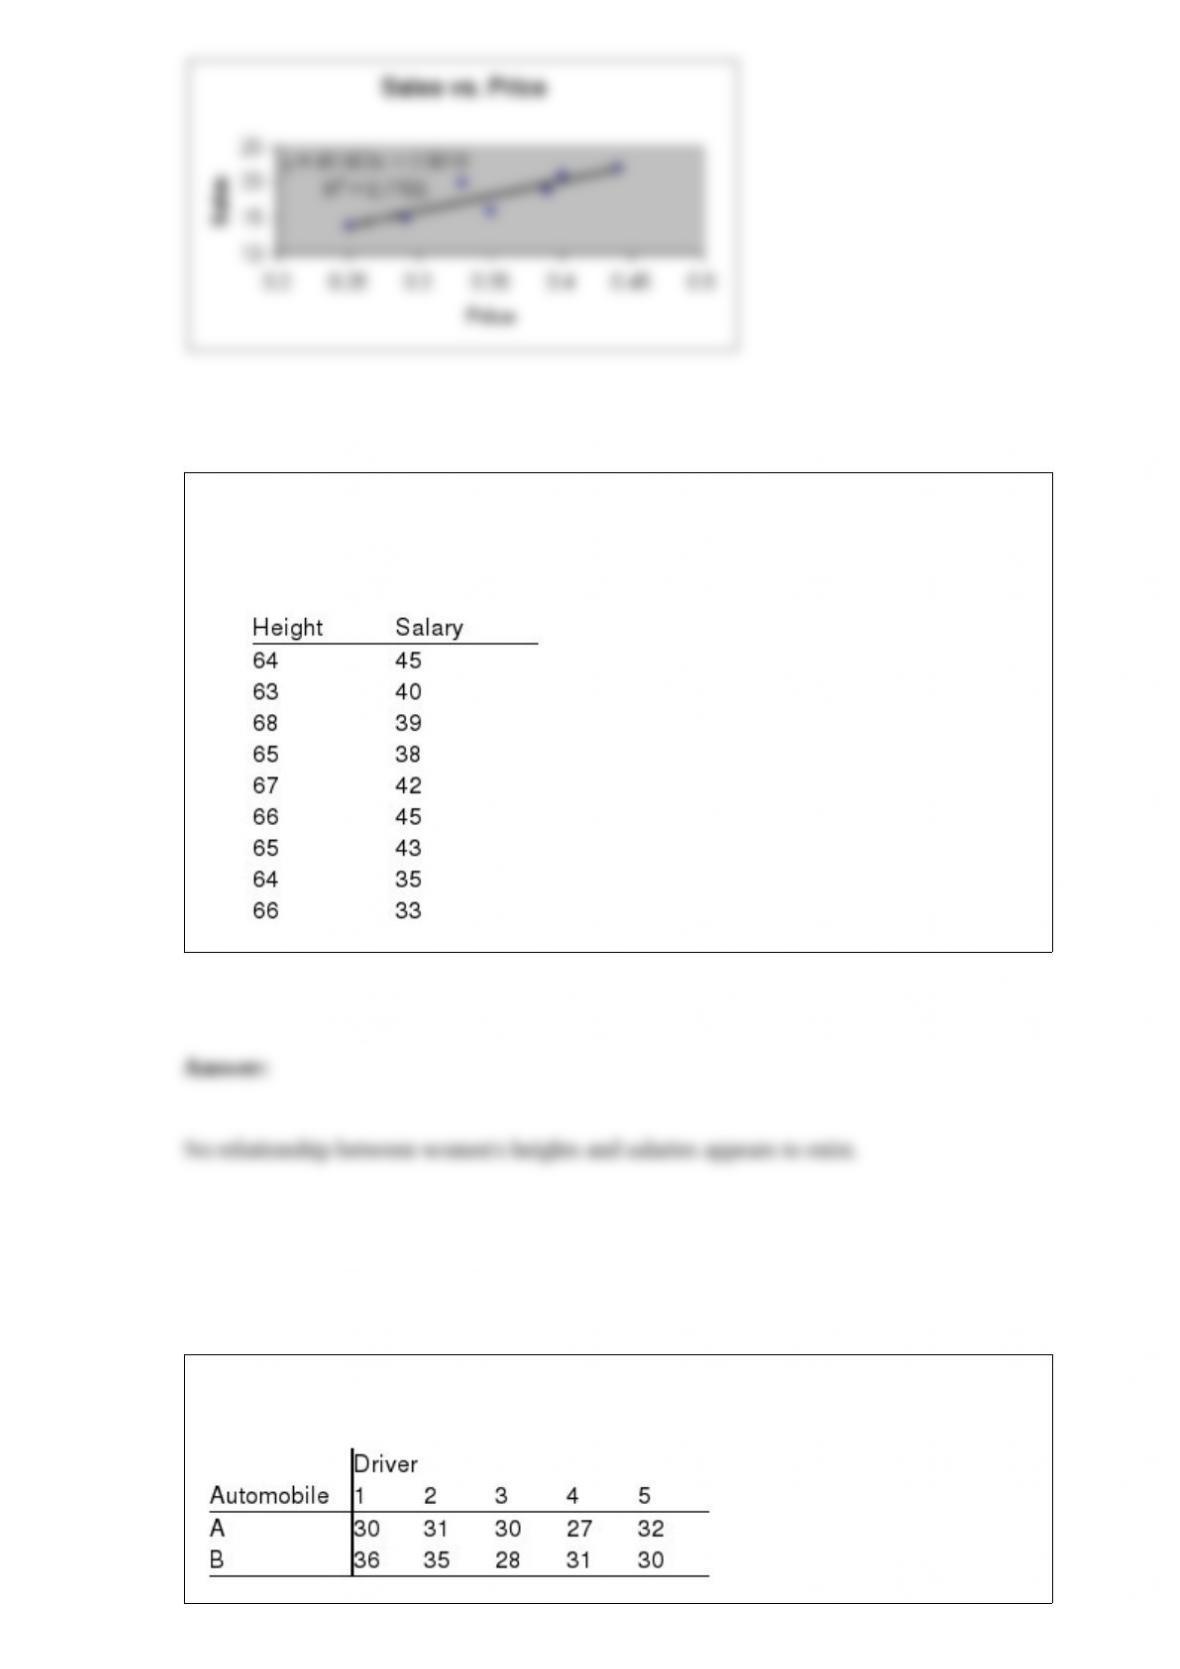
For the following observations, plot a scatter diagram and indicate what kind of
relationship (if any) exists between women’s height (inches) and annual starting salary
($1000).
Five drivers were selected to test drive 2 makes of automobiles. The following table
shows the number of miles per gallon for each driver driving each car.
Consider the makes of automobiles as treatments and the drivers as blocks, test to see if
there is any difference in the miles/gallon of the two makes of automobiles. Let = .05.
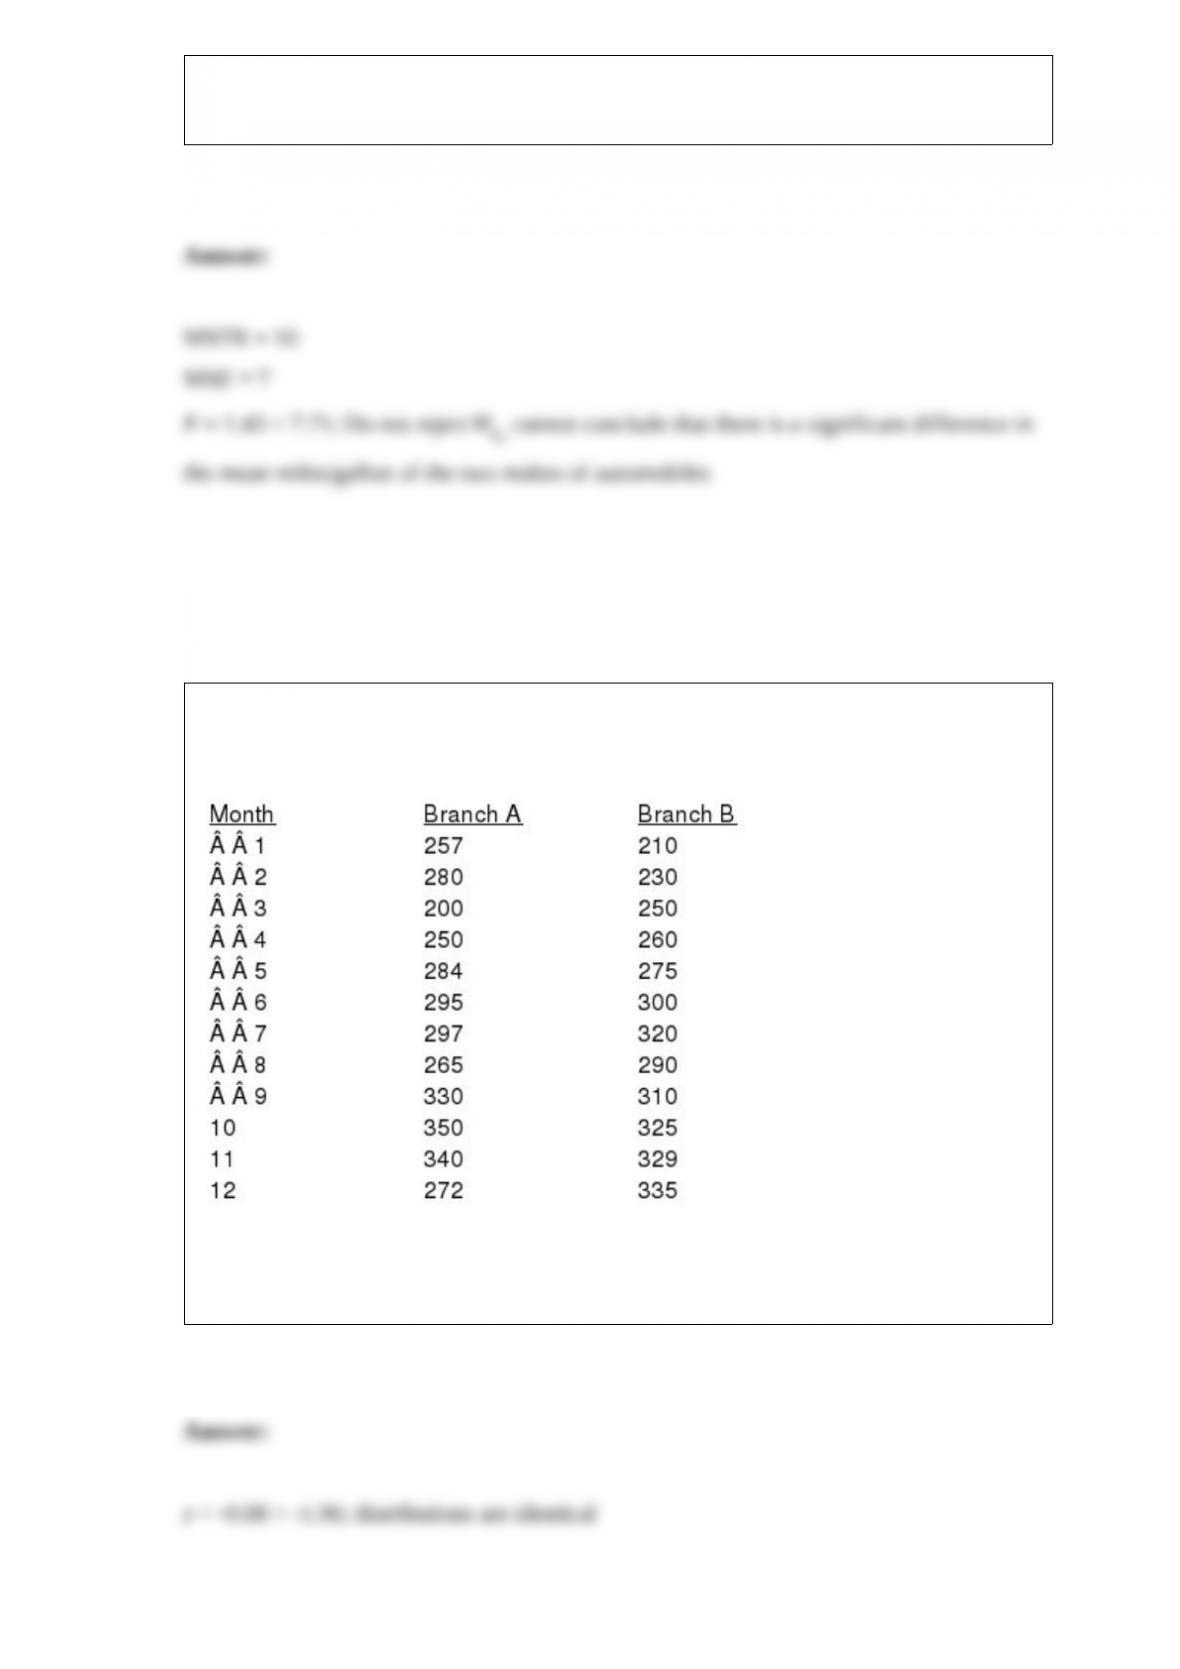
The sales records of two branches of a department store over the last 12 months are
shown below. (Sales figures are in thousands of dollars.)
Use = 0.05 and test to determine if there is a significant difference in the populations
of the sales of the two branches.
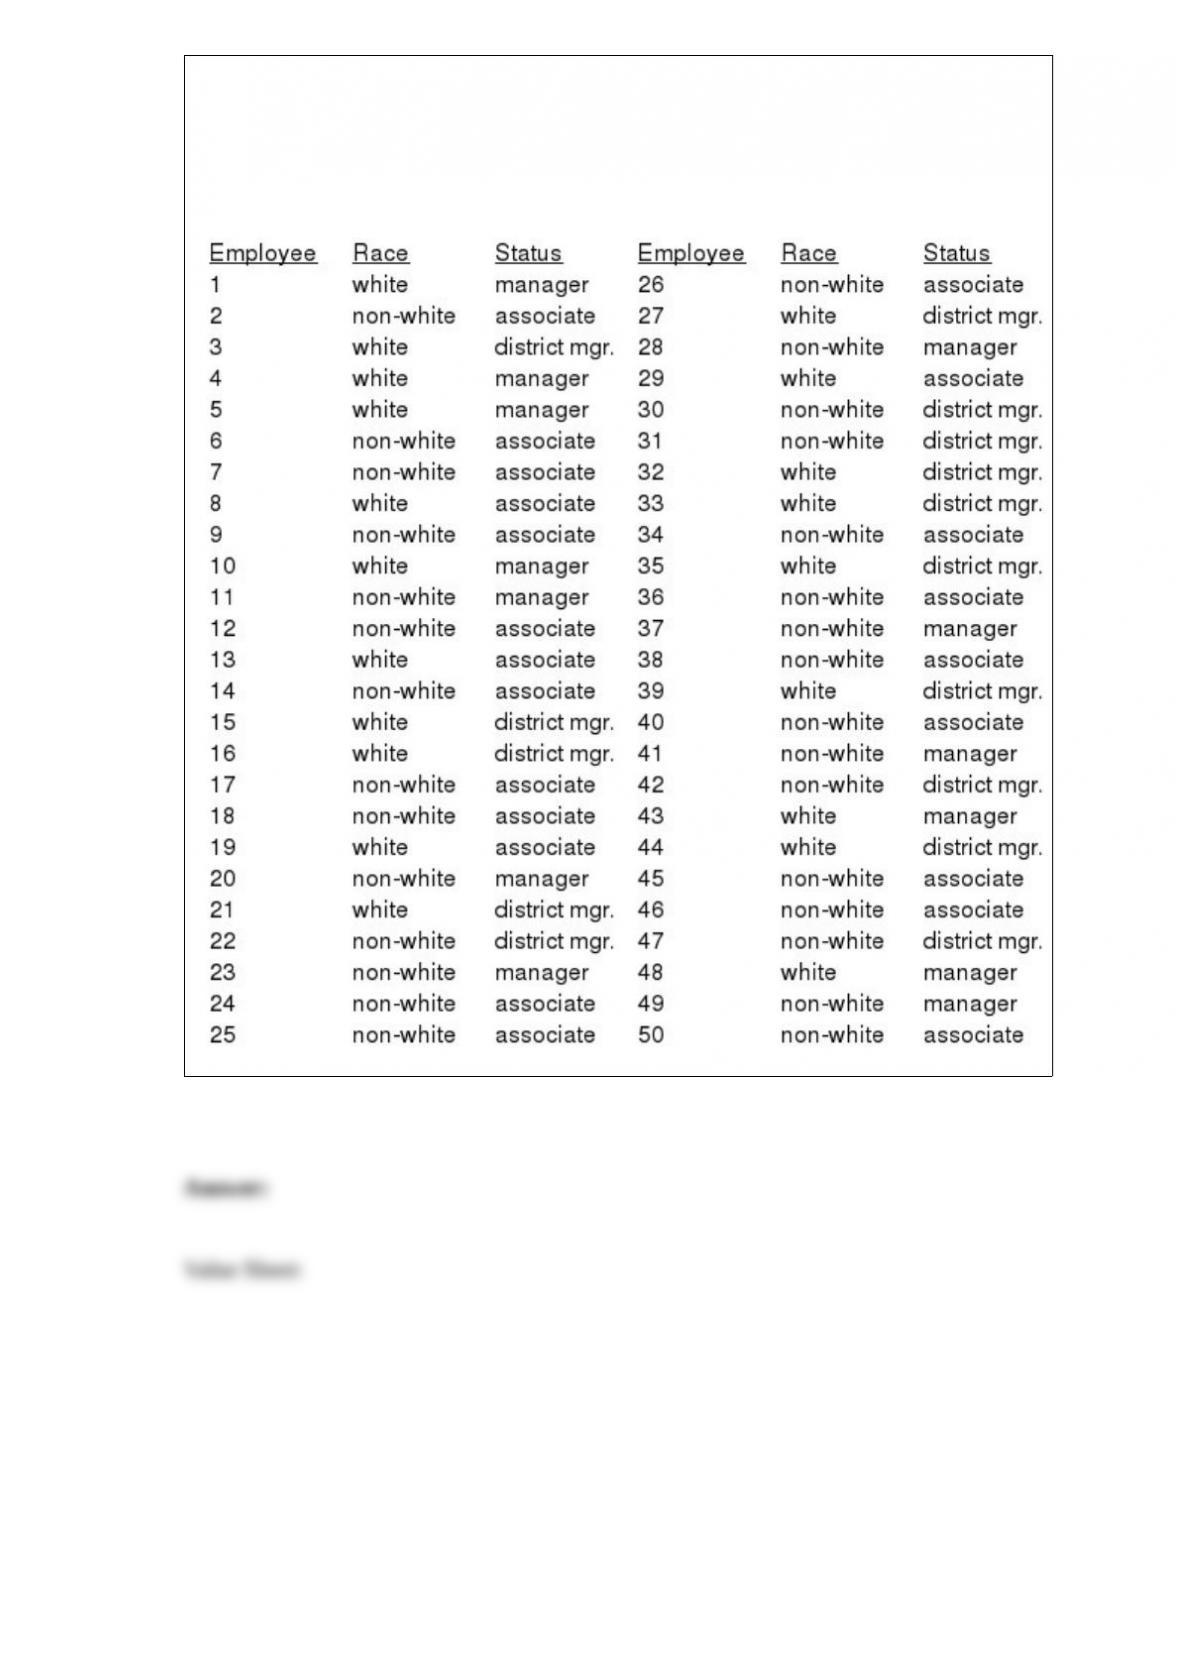
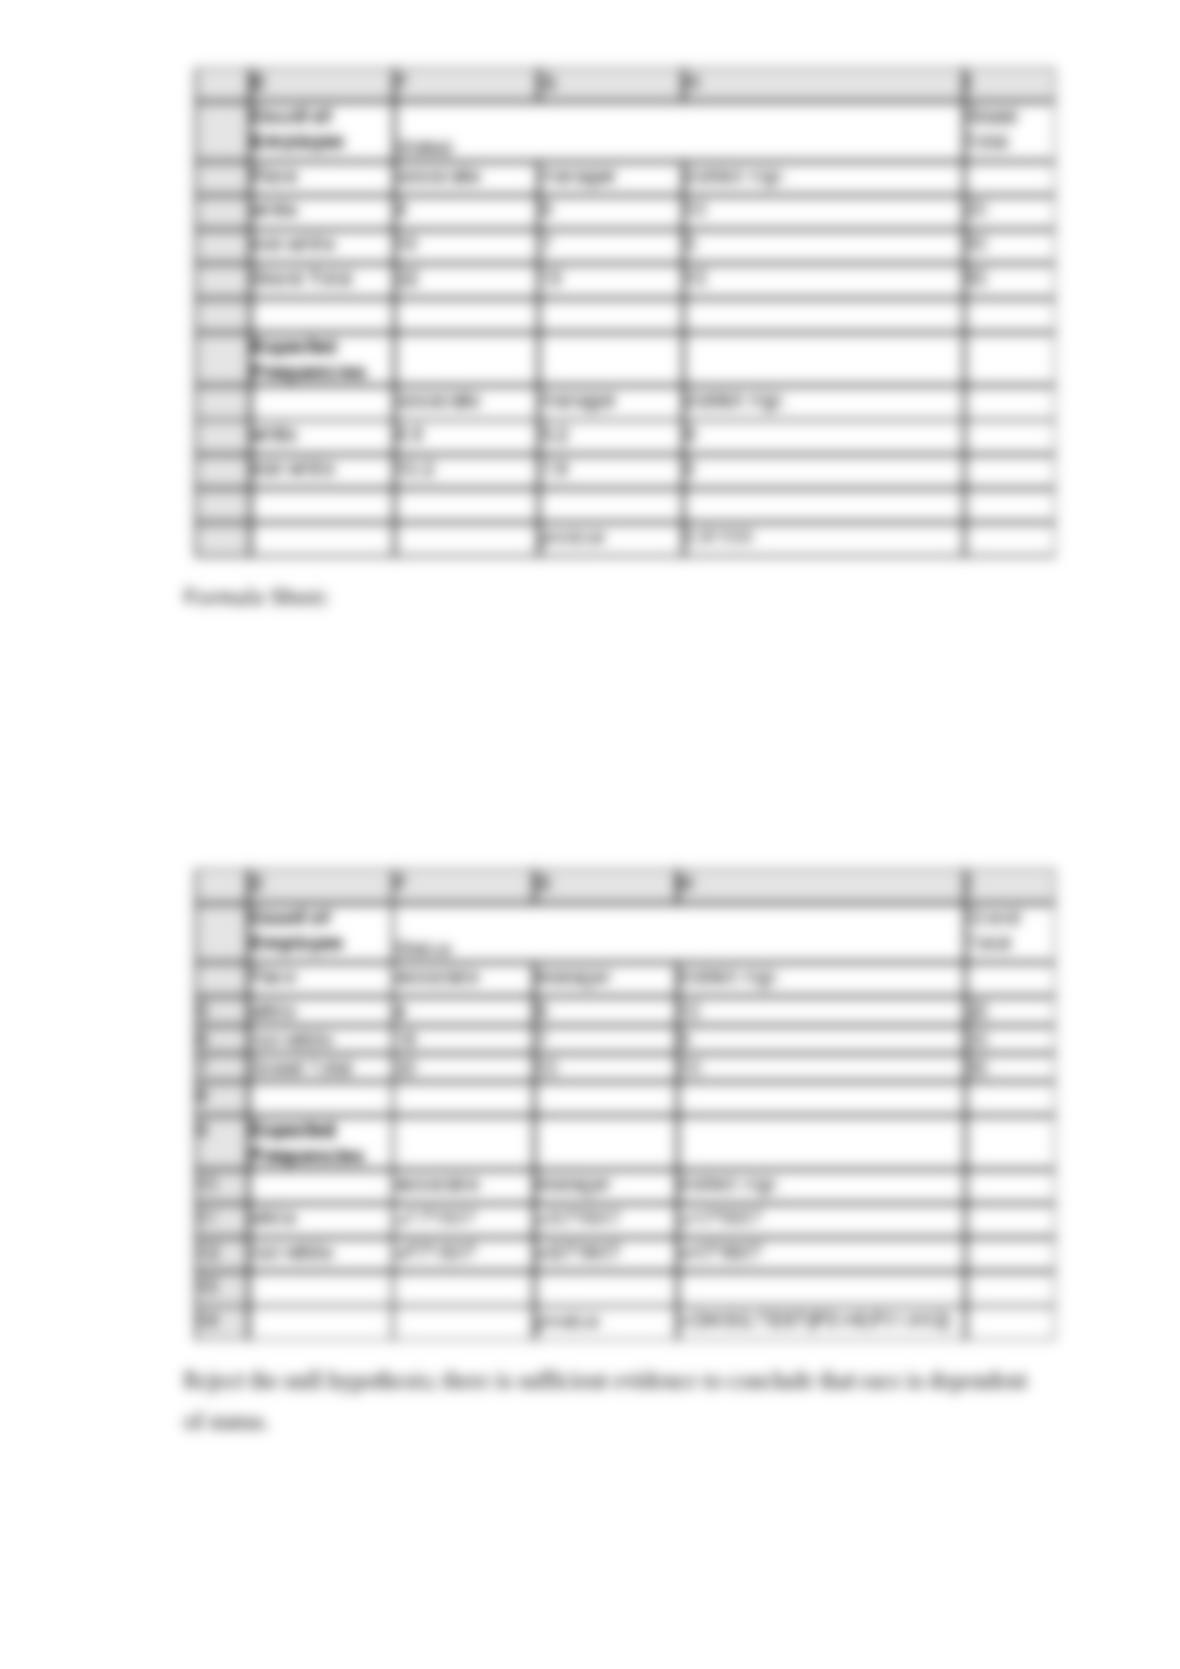
A study of wage discrimination at a local store compared employees’ race and their
status. Partial results of the study follow. Use Excel and test at = .05 to determine if
race is independent of status.
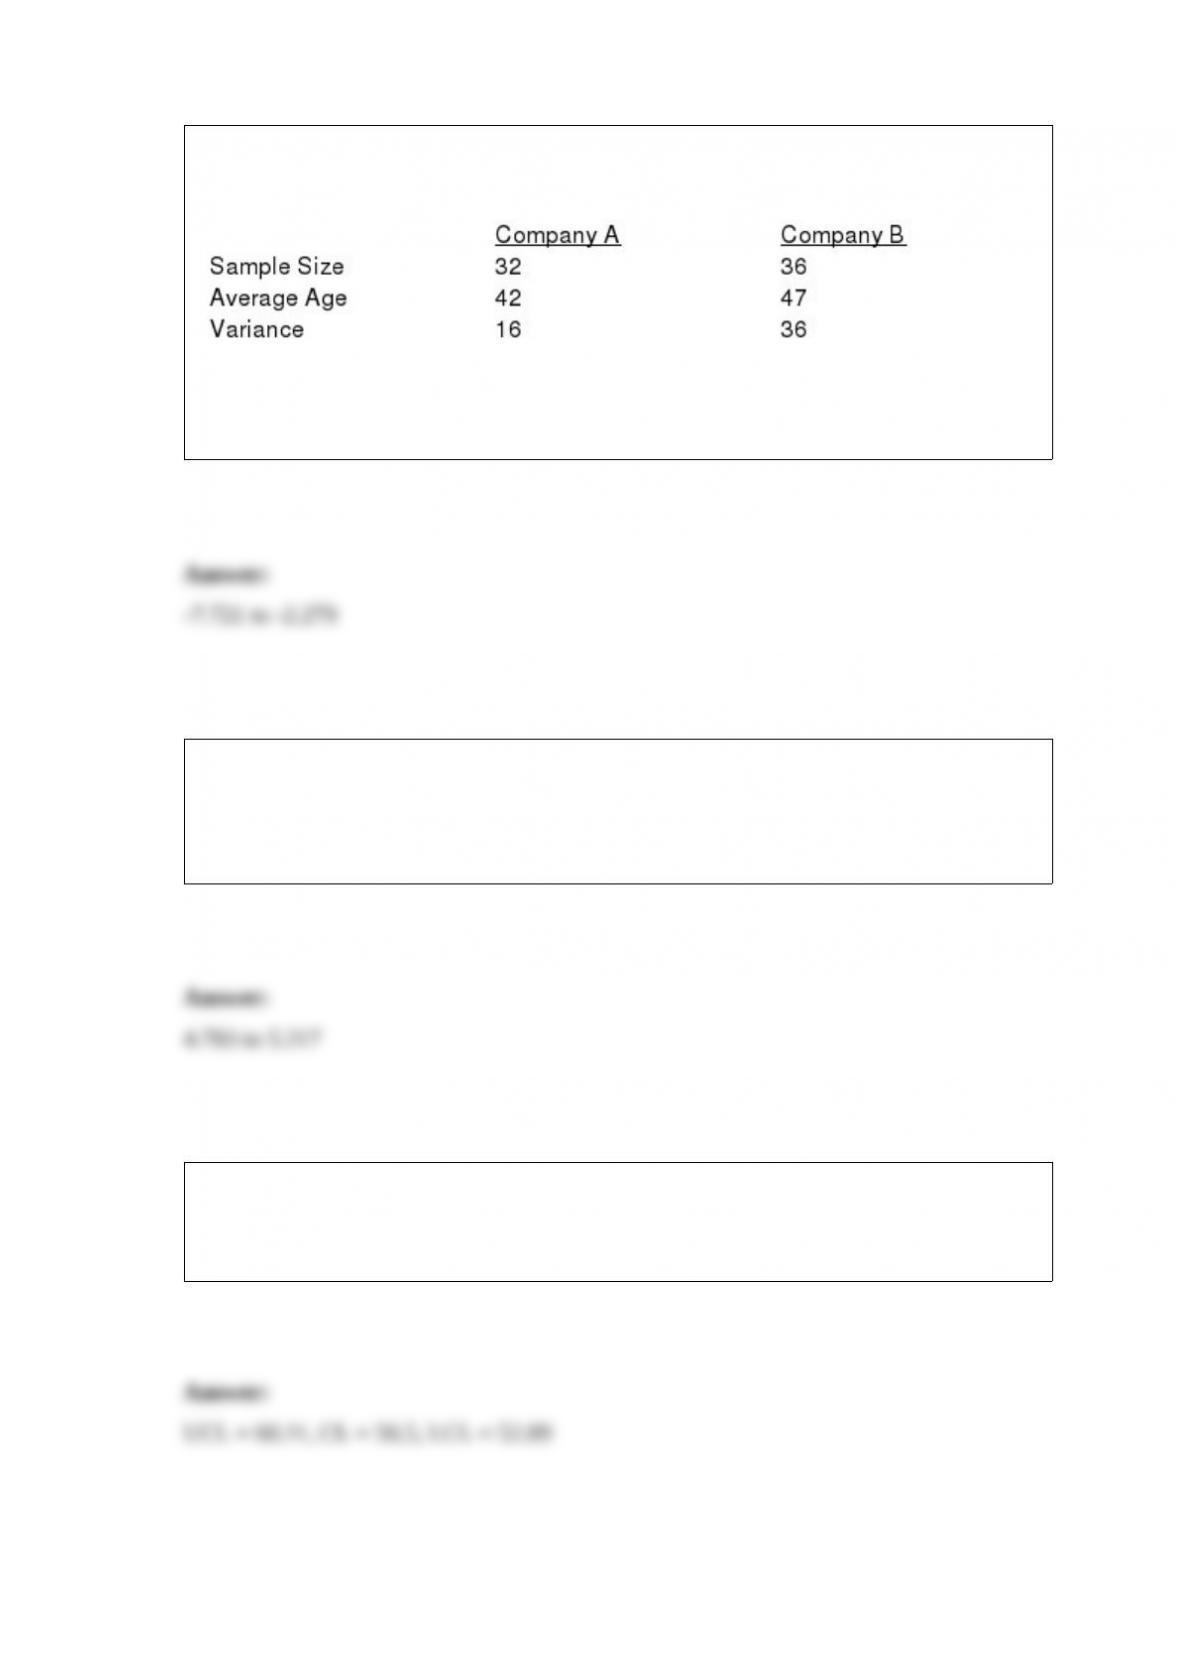
Samples of employees of Companies A and B provided the following information
regarding the ages of employees.
Develop a 97% confidence interval for the difference between the average ages of the
employees of the two companies.
Computer Services, Inc. wants to determine a confidence interval for the average CPU
time of their teleprocessing transactions. A sample of 196 transactions yielded a mean
of 5 seconds. The population standard deviation is 1.4 seconds. Determine a 97%
confidence interval for the average CPU time.
A process that is in control has a mean of
= 56.5 and a standard deviation of
= 3.4.
What should the control limits be for a sample mean chart if samples of size 8 are
taken?