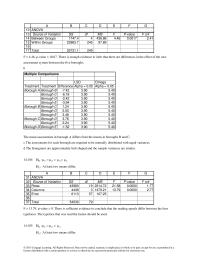
Archives
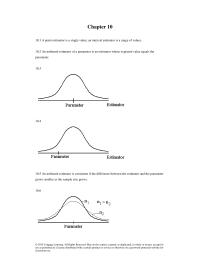
Chapter 10 If there are two unbiased estimators of a parameter
© 2015 Cengage Learning. All Rights Reserved. May not be copied, scanned, or duplicated, in whole or in part, except for use as permitted in a license distributed with a certain product or service or otherwise on a password-protected website […]
Chapter 11 Risky investment is not more successful
Chapter 11 11.1 0 H : The drug is not safe and effective 1 H : The drug is safe and effective 11.2 0 H : I will complete the Ph.D. 1 H : I will not be able to […]
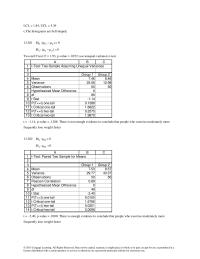
Chapter 11 Type Error Occurs When Conclude That The
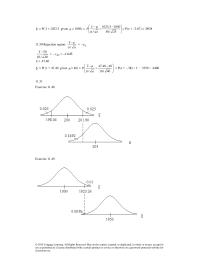
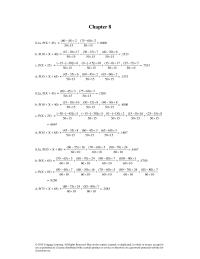
= P( x < 1023.3 given = 1050) = − − 25/50 10503.1023 /n x P = P(z < –2.67) = .0038 11.50 Rejection region: n/ x − […]
Chapter 12 proportion of Americans who support the Democrats
12.83 a n/)p ˆ 1(p ˆ zp ˆ2/ − = .50 1.96 400/)50.1(50.− = .50 .0490 b n/)p ˆ 1(p ˆ zp ˆ2/ − = .33 1.96 400/)33.1(33.− = .33 .0461 c n/)p ˆ […]
Chapter 12 There Enough Evidence Infer That The Mean
Chapter 12 12.3 a n/stx 2/ = 510 2.064(125/ 25 ) = 510 51.60; LCL = 458.40, UCL = 561.60 b n/stx 2/ = 510 2.009(125/ 50 ) = 510 35.51; LCL = 474.49, […]
Chapter 12 there is enough evidence to infer that postal workers
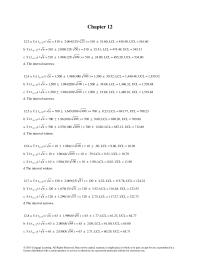
12.155 LCL = .0765, UCL = .1271 12.156 LCL = 26.44, UCL = 27.55 12.157 a LCL = 6.84, UCL = 6.98 b The histogram is bell shaped. c :H0 = 7 :H1 < 7 © 2015 Cengage Learning. All […]
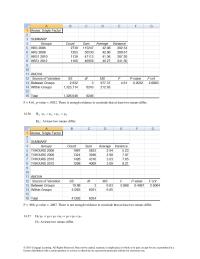
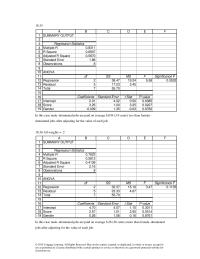
Chapter 13 Assuming Equal Variances Mean Variance Observations
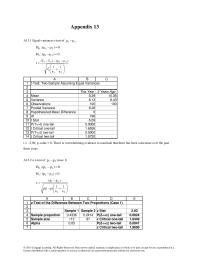
Appendix 13 A13.1 Equal-variances t-test of 21 − 0)(:H 210 =− 0)(:H 211 − + −−− = 21 2 p 2121 n 1 n 1 s )()xx( t 1 2 6 7 8 […]
Chapter 13 Experimental data could have been derived by selecting
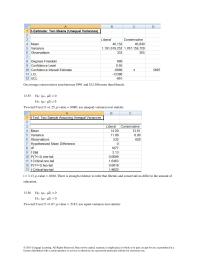
On average conservatives earn between $991 and $12,386 more than liberals. 13.55 H0: (μ1– μ2) = 0 H1: (μ1– μ2) ≠ 0 Two-tail F test: F =1.25, p-value = .0080; use unequal-variances test statistic t = 3.13, p-value = .0018. […]
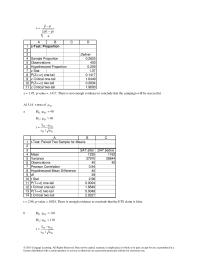
Chapter 13 Proportion Sample Proportion Observations Hypothesized Proportion
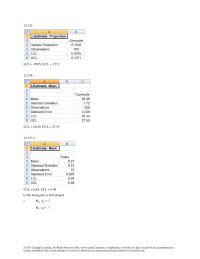
n )p1(p pp ˆ z− − = 6 7 8 9 10 11 Hypothesized Proportion 0.259 z Stat 1.07 P(Z<=z) one-tail 0.1417 z Critical one-tail 1.6449 P(Z<=z) two-tail 0.2834 z Critical two-tail 1.9600 z = 1.07, p-value = .1417. There […]
Chapter 13 The histogram of the differences is bell shaped
D1 :H 0 Rejection region: 684.1ttt 39,05., = = − = − =40/63.30 075.19 n/s x t DD D D 4.08, p-value = .0001. There is enough evidence to conclude that companies that advertise in the Yellow Pages have […]
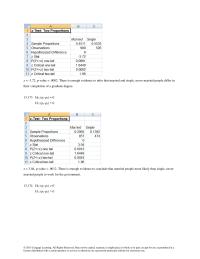
Chapter 13 There is enough evidence to infer that married
z = -3.72, p-value = .0002. There is enough evidence to infer that married and single, never married people differ in their completion of a graduate degree. 13.173 H0: (p1-p2) = 0 H1: (p1-p2) > 0 z = 3.04, p-value […]
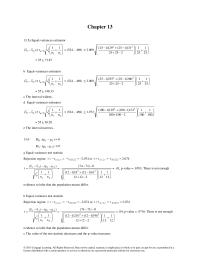
Chapter 13 use equal-variances test statistic Rejection region
Chapter 13 13.5a Equal-variances estimator +− 21 2 p2/21 n 1 n 1 st)xx( = (524 – 469) 2.009 + […]
Chapter 13 Variance Observations Hypothesized Mean Difference
© 2015 Cengage Learning. All Rights Reserved. May not be copied, scanned, or duplicated, in whole or in part, except for use as permitted in a license distributed with a certain product or service or otherwise on a password-protected website […]
Chapter 14 Conclusion The following pairs of means differ.
F = 4.61, p-value = .0032. There is enough evidence to conclude that at least two means differ. 14.36 43210 :H === :H1 At least two means differ. F = .968, p-value = .4067. There is not enough evidence to […]
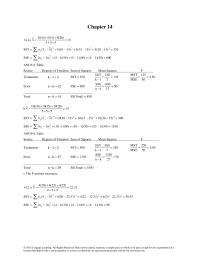
Chapter 14 Degrees of Freedom Sum of Squares
Chapter 14 14.1a 555 )20(5)15(5)10(5 x++ ++ = = 15 SST = =− 2 jj )xx(n 5(10 – 15) 2 + 5(15 – 15) 2 + 5(20 – 15) 2 = 250 SSE = =− 2 jj s)1n( (5 –1)(50) […]
Chapter 14 There is no evidence to infer that sales
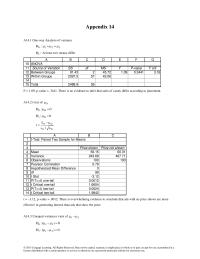
Appendix 14 A14.1 One-way Analysis of variance :H0 321 == :H1 At least two means differ 10 13 14 15 Within Groups 2397.5 57 42.06 Total 2488.9 59 F = 1.09, p-value = .3441. There is no evidence to infer […]
Chapter 14 There Sufficient Evidence Infer That There Are
F = 4.46, p-value = .0017. There is enough evidence to infer that there are differences in the effect of the new assessment system between the five boroughs. 14 15 16 17 Between Groups 1747.4 4 436.86 4.46 0.0017 2.41 […]
Chapter 14 There is sufficient evidence to indicate that there
14.76 == 210 :H 3 4 = :H1 At least two means differ. Rejection region: 1bkn,1k, FF +−−− 12,3,01. F= = 5.95 k = 4, b = 5, Grand mean = 8.3 SS(Total) = == − b […]
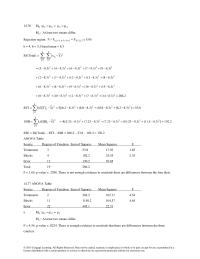
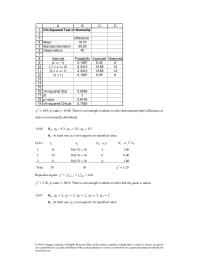
Chapter 15 Americans differ from Americans who work
15.47 2 = 10.04, p-value = .0066. There is sufficient evidence to infer that the three political persuasions differ. 15.48 2 = 25.90, p-value = 0. There is enough evidence of a difference between foreign-born and American-born residents […]
Chapter 15 Program Are Different Terms Their
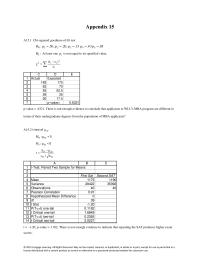
Appendix 15 A15.1 Chi-squared goodness-of-fit test :H0 50.p1= , 20.p2= , 15.p3= 10.p4= 05.p5= :H1 At least one i p is not equal to its specified value. − = i 2 ii 2 e )ef( 3 4 5 6 7 […]
Chapter 15 The two variables (shift and day) are independent
2 = .055, p-value = .8140. There is not enough evidence to infer that matched pairs difference of sales is not normally distributed. 10 11 12 13 14 15 16 17 18 19 (-1 < z <= 0) 0.3413 […]
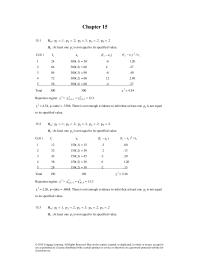
Chapter 15 There Enough Evidence Infer That The Two
Chapter 15 15.1 :H0 = 1 p .1, = 2 p .2, = 3 p .3, = 4 p .2, = 5 p .2 :H1 At least one i p is not equal to its specified value. Cell i i […]
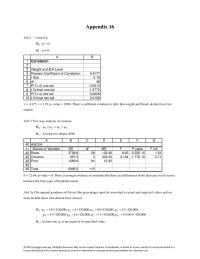
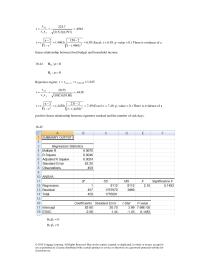
Chapter 16 Correlation Weight And Ba Level Pearson Coefficient
Appendix 16 A16.1 t-test of ρ 0:H0= 0:H1 4 5 6 7 8 9 10 Pearson Coefficient of Correlation 0.4177 t Stat 3.19 df 48 P(T<=t) one tail 0.0013 t Critical one tail 1.6772 P(T<=t) two tail 0.0026 t Critical […]
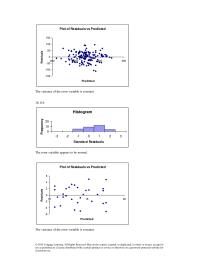
Chapter 16 Homework The error variable appears to be normal.
The variance of the error variable is constant. -150 -100 -50 0 200 250 300 350 Predicted Residuals 16.116 The error variable appears to be normal. 0 10 -3 -2 -1 0 1 2 3 Standard Residuals Frequency The variance […]
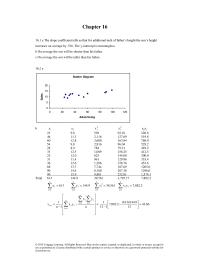
Chapter 16 Linear relationship between food budget and household
4961. )797,1)(2.115( 7.225 ss s r yx xy === 95.6 )4961(.1 2150 )4961(. r1 2n rt 22 = − − = − − = (Excel: t = 6.95, p–value = 0.) There is evidence of a linear relationship between food […]
Chapter 16 On average the son will be taller than his father
Chapter 16 16.1 a The slope coefficient tells us that for additional inch of father’s height the son’s height increases on average by .516. The y-intercept is meaningless. b On average the son will be shorter than his father. c […]
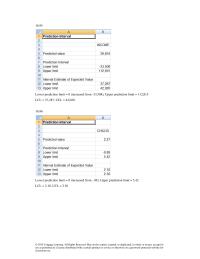
Chapter 16 service or otherwise on a password-protected website for
16.95 Lower prediction limit = 0 (increased from -33,508), Upper prediction limit = 112,815 LCL = 37,287, UCL = 42,020 16.96 Lower prediction limit = 0 (increased from -.89), Upper prediction limit = 5.42 LCL = 2.18, UCL = 2.36 […]
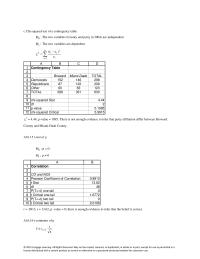
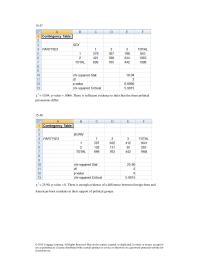
Chapter 16 Contingency Table Broward Democrats Republicans
c Chi-squared test of a contingency table :H0 The two variables (County and party in 2004) are independent :H1 The two variables are dependent = − = 6 1i i 2 ii 2 e )ef( 4 5 6 7 […]
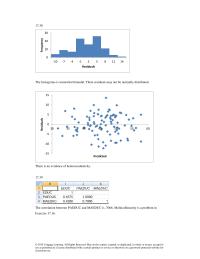
Chapter 17 no union members with respect to the question about
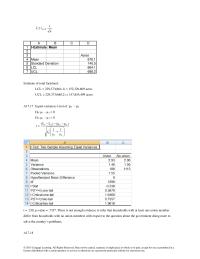
n s tx 2/ 4 5 6 7 Mean 676.1 Standard Deviation 140.5 LCL 664.1 UCL 688.2 Estimate of total farmland: LCL = 229,373(664.1) = 152,326,609 acres UCL = 229,373(688.2) = 157,854,499 acres 1 2 3 A B C […]
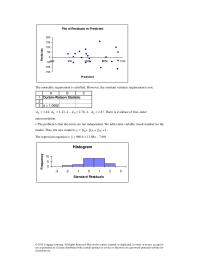
Chapter 17 Predicted The Error Approximately Normally Distributed With
The normality requirement is satisfied. However, the constant variance requirement is not. L d = 1.24, U d = 1.43, 4 – U d = 2.76, 4 – L d = 2.57. There is evidence of first–order 2 3 d […]
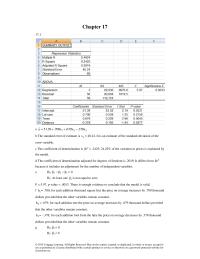
Chapter 17 The coefficient of determination adjusted for degrees
Chapter 17 17.1 a 321 x378.x679.x700.39.51y ˆ−++= b The standard error of estimate is s = 40.24. It is an estimate of the standard deviation of the error variable. c The coefficient of determination is 2 R = .2425; […]
Chapter 17 There is enough evidence to conclude that garlic
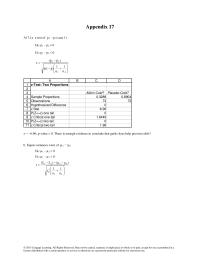
Appendix 17 A17.1a z-test of p1 – p2 (case 1) H0: p1 – p2 = 0 H1: p1 – p2 < 0 +− − = 21 21 n 1 n 1 )p ˆ […]
Chapter 17 There residuals may not be normally distributed
17.38 0 10 -10 -7 -4 -1 2 5 8 11 14 Frequency Residuals The histograms is somewhat bimodal. There residuals may not be normally distributed. There is no evidence of heteroscedasticity. -15 -10 -5 0 30 35 40 45 […]
Chapter 17 which we interpret to mean that for each additional thousand
Work experience: t = 3.00, p-value = .0036 Both the GMAT and work experience are linearly related to MBA GPA 7.15 b. H0: β1 = β2 = β3 = β4 = β5 = β6 = 0 H1: At least one […]
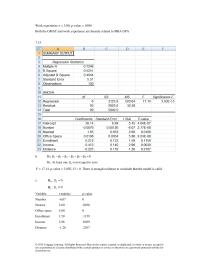
Chapter 18 After removing the effect of age, education
18.24a b. b4 = 1505.6; after removing the effect of age, education, and weekly hours of work people who work for themselves earn on average $1505.60 less than people who work for someone else. c. H0:β4 = 0 H1:β4 > […]
Chapter 18 Homework Square 08051 Adjusted Square 07947 Standard Error
Chapter 18 18.1 a b 18.2 a © 2015 Cengage Learning. All Rights Reserved. May not be copied, scanned, or duplicated, in whole or in part, except for use as permitted in a license distributed with a certain product or […]
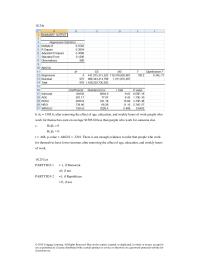
Chapter 18 In this case male–dominated jobs are paid
18.35 In this case male–dominated jobs are paid on average $.039 (3.9 cents) less than female– dominated jobs after adjusting for the value of each job. 15 16 17 18 19 Coefficients Standard Error t Stat P-value Intercept 2.01 4.02 […]
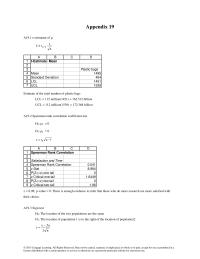
Chapter 19 Spearman rank correlation coefficient test
Appendix 19 A19.1 t-estimator of µ n s tx 2/ 4 5 6 7 Mean 1495 Standard Deviation 404 LCL 1451 UCL 1539 Estimate of the total number of plastic bags LCL = 112 million(1451) = 162.512 billion UCL […]
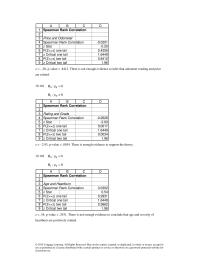
Chapter 19 Spearman Rank Correlation Price And Odometer Spearman
z = –.20, p-value = .8412. There is not enough evidence to infer that odometer reading and price are related. 3 4 5 6 7 8 9 Price and Odometer Spearman Rank Correlation -0.0201 z Stat -0.20 P(Z<=z) one tail […]
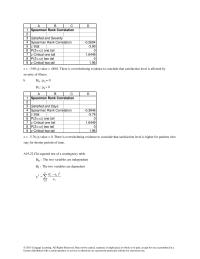
Chapter 19 Spearman Rank Correlation Satisfied And Severity Spearman
5 6 7 8 9 z Stat -3.90 P(Z<=z) one tail 0 z Critical one tail 1.6449 P(Z<=z) two tail 0 z Critical two tail 1.96 z = –3.90; p-value = .0001. There is overwhelming evidence to conclude that satisfaction […]
Chapter 19 The location of population 1 is different fro
19.49 :H0 The two population locations are the same :H1 The location of population 1 is to the left of the location of population 2 Rejection region: 33.2zzz 01.−=−=− 410 4 )140(40 4 )1n(n )T(E = + = + […]
Chapter 19 The two population locations are the same
H = 14.87, p-value = .0213. There is enough evidence to infer that there are differences in the perceptions of speed of service between the days of the week. 7 8 9 10 11 12 13 14 15 Wednesday 3834.5 […]
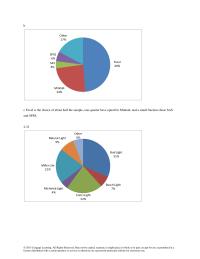
Chapter 2 Excel is the choice of about half the sample
b c Excel is the choice of about half the sample, one-quarter have opted for Minitab, and a small fraction chose SAS and SPSS. Minitab 24% 2.33 Busch Light 7% Coors Light 22% Michelob Light 4% Miller Lite 21% Excel […]
Chapter 2 The bar chart provides the frequencies and the pie
Chapter 2 2.1 Nominal: Occupation, undergraduate major. Ordinal: Rating of university professor, Taste test ratings. Interval: age, income 2.2 a Interval b Interval c Nominal d Ordinal 2.3 a Interval b Nominal c Ordinal d Interval e Interval 2.4 a […]
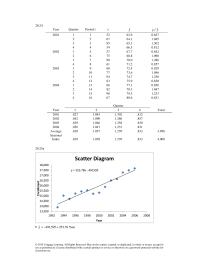
Chapter 20 Regression line Average Seasonal Index
20.24 Year Quarter Period t y y ˆ yy ˆ / 2001 1 1 52 62.9 0.827 2 2 67 64.1 1.045 3 3 85 65.3 1.302 4 4 54 66.5 0.812 2002 1 5 57 67.7 0.842 2 6 […]
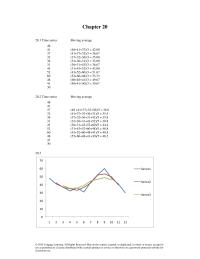
Chapter 20 There appears to be a gradual upward trend
Chapter 20 20.1 Time series Moving average 48 41 (48+41+37)/3 = 42.00 37 (41+37+32)/3 = 36.67 32 (37+32+36)/3 = 35.00 36 (32+36+31)/3 = 33.00 31 (36+31+43)/3 = 36.67 43 (31+43+52)/3 = 42.00 52 (43+52+60)/3 = 51.67 60 (52+60+48)/3 = 53.33 […]
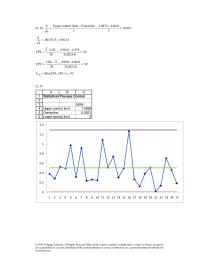
Chapter 21 centerline were taken when the process was out of control
21.36 00107. 3 9841.49873.4 3 CenterlinelimitcontrolUpper n S= − = − = 00214.S;00107. 4 S== 95. )00214(.3 978.49841.4 S3 LSLx CPL = − = − = 92. )00214(.3 9841.4990.4 S3 xUSL CPU = − = − = )CPU,CPL(MinCpk = = […]
Chapter 21 Chance variation represents the variation in student
Chapter 21 21.1Chance variation is caused by a number of randomly occurring events that are part of the production process and that in general cannot be eliminated without changing the process. 21.3 Special variation is caused by specific events or […]
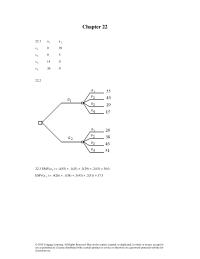
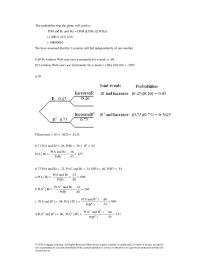
Chapter 22 EMV decision build a medium size plant
Chapter 22 22.1 a 1 a 2 s 1 0 29 s 2 0 5 s 3 14 0 s 4 36 0 22.2 22.3 EMV(a 1 ) = .4(55) + .1(43) + .3(29) + .2(15) = 38.0 EMV(a 2 […]
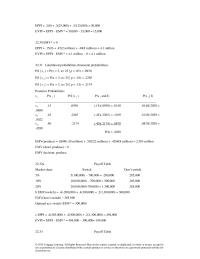
Chapter 22 neither person supports format change
EPPI = .2(0) + .5(25,000) + .3(125,000) = 50,000 EVPI = EPPI – EMV* = 50,000 – 35,000 = 15,000 22.30 EMV* = 0 EPPI = .15(0) + .45(2 million) + .40(8 million) = 4.1 million EVPI = EPPI – […]
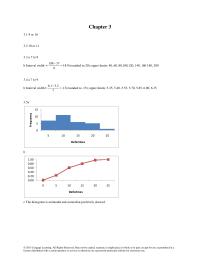
Chapter 3 The histogram is unimodal and somewhat positively
Chapter 3 3.1 9 or 10 3.2 10 or 11 3.3 a 7 to 9 b Interval width 9.18 8 37188 = − (rounded to 20); upper limits: 40, 60, 80,100,120, 140, 160 180, 200 3.4 a 7 to […]
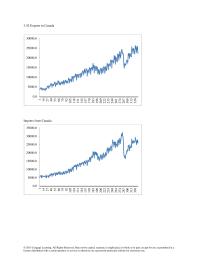
Chapter 3 There is a strong positive linear relationship
3.42 Exports to Canada 0.0 5000.0 10000.0 15000.0 1 14 27 40 53 66 79 92 105 118 131 144 157 170 183 196 209 222 235 248 261 274 287 300 313 326 Imports from Canada 20000.0 25000.0 30000.0 […]
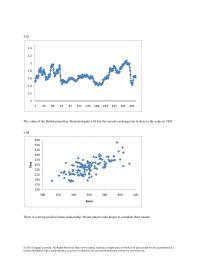
Chapter 3 This Plan Should Permit Many
3.87 The value of the British pound has fluctuated quite a bit but the current exchange rate is close to the value in 1987. 1 1.2 1.4 1.6 1.8 1 25 49 73 97 121 145 169 193 217 241 […]
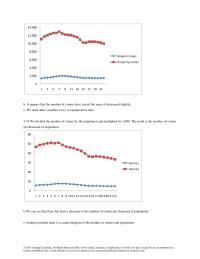
Chapter 3 We need other variables to try to explain
b. It appears that the number of crimes have stayed the same of decreased slightly. c. We need other variables to try to explain these data. 0 2,000 4,000 6,000 1 3 5 7 9 11 13 15 17 19 […]
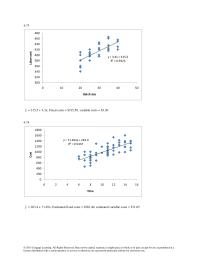
Chapter 4 away attendance increases on average by 4746 for each win
4.73 y ˆ = 315.5 + 3.3x; Fixed costs = $315.50, variable costs = $3.30 R² = 0.5925 300 320 340 360 010 20 30 40 50 Labor cost Batch size 4.74 y ˆ = 263.4 + 71.65x; Estimated fixed […]
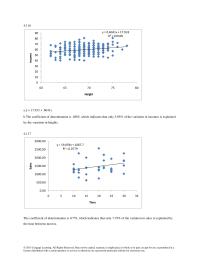
Chapter 4 From the least squares line we can more precisely
4.116 a y ˆ = 17.933 + .6041x 0 10 20 30 60 65 70 75 80 Height b The coefficient of determination is .0505, which indicates that only 5.05% of the variation in incomes is explained by the variation […]
Chapter 4 The mean number of days to submit grades
Chapter 4 4.1 a 12 54081333060 441040 152552 n x xi+++++++++++ == = 12 489 = 40.75 Ordered data: 0, 5, 15, 25, 30, 33, 40, 44, 52, 60, 81, 104; Median = (33 + 40)/2 = 36.5 Mode […]
Chapter 5 No Because The Sampled Population Consists The
lung cancer. b The study is observational. Experimental data would require the statistics practitioner to randomly assign some people to smoke and others not to smoke. because of the need to hire well-trained interviewers and possibly pay travel-related costs if […]
Chapter 6 If all the teams in major league baseball
Chapter 6 6.1 a Relative frequency approach b If the conditions today repeat themselves an infinite number of days rain will fall on 10% of the next days. 6.2 a Subjective approach b If all the teams in major league […]
Chapter 6 wireless Web user uses it primarily for e-mail
The probability that the plane will crash is P(M and B1 and B2) = [P(M)][ P(B1)][ P(B2)] = (.0001) (.01) (.01) = .00000001 We have assumed that the 3 systems will fail independently of one another. 6.69 P( wireless Web […]
Chapter 7 Expected number of runs without bunting
7.80a Mean = .0289, standard deviation = .1282 b Mean = .0261, standard deviation = .1406 © 2015 Cengage Learning. All Rights Reserved. May not be copied, scanned, or duplicated, in whole or in part, except for use as permitted […]
Chapter 7 it is finite because students cannot earn an
Chapter 7 7.1 a 0, 1, 2, … b Yes, we can identify the first value (0), the second (1), and so on. c It is finite, because the number of cars is finite. d The variable is discrete because […]
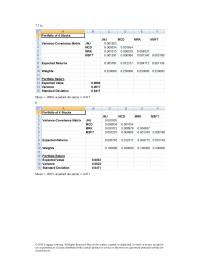
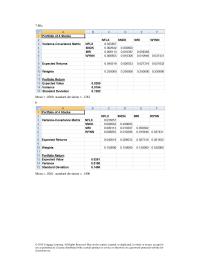
Chapter 7 Portfolio 3 has the smallest standard deviation
7.71a Mean = .0060, standard deviation = .0417 b Mean = .0053, standard deviation = .0471 © 2015 Cengage Learning. All Rights Reserved. May not be copied, scanned, or duplicated, in whole or in part, except for use as permitted […]
Chapter 8 we calculate probabilities by determining the area
Chapter 8 8.1a. P(X > 45) 1550 2)6075( 1550 2)4560( − + − = .0800 b. P(10 < X < 40) 1550 1550 1550 c. P(X < 25) 1550 7)1525( 1550 17)015( 1550 10])15[0( […]
Chapter 9 because the sample mean is approximately normally
Chapter 9 9.1a. 1/6 b. 1/6 9.2 a )1X(P = =P(1,1)= 1/36 b )6X(P = 9.3a P( X = 1) = (1/6) 5 = .0001286 b P( X = 6) = (1/6) 5 = .0001286 9.4 The variance of X […]
Management Chapter 1 A resort employs 3,500 managers and staff
ANS: T PTS: 1 DIF: Easy OBJ: SFME.KELL.15.01.01 NAT: BUSPROG.SFME.KELL.15.03 STA: DISC.SFME.KELL.15.01 KEY: Bloom’s: Knowledge ANS: F PTS: 1 DIF: Easy OBJ: SFME.KELL.15.01.01 NAT: BUSPROG.SFME.KELL.15.03 STA: DISC.SFME.KELL.15.01 KEY: Bloom’s: Knowledge ANS: F PTS: 1 DIF: Easy OBJ: SFME.KELL.15.01.01 NAT: BUSPROG.SFME.KELL.15.03 […]
Management Chapter 10 Developing Interval Estimate For Population Mean
CHAPTER 10: INTRODUCTION TO ESTIMATION TRUE/FALSE 1. An unbiased estimator is said to be consistent if the difference between the estimator and the parameter grows smaller as the sample size grows larger. ANS: T PTS: 1 DIF: Easy OBJ: SFME.KELL.15.10.01 […]
Management Chapter 10 In the formula for a confidence interval for
ANS: C PTS: 1 DIF: Moderate OBJ: SFME.KELL.15.10.02 NAT: BUSPROG.SFME.KELL.15.03 STA: DISC.SFME.KELL.15.05 KEY: Bloom’s: Comprehension 48. In the formula , the / 2 refers to: a. the probability that the sample mean will not equal the population mean. b. […]
Management Chapter 11 H0 The Test Marginally Statistically Significant there Evidence
a. p-value = b. p-value < c. p-value > d. − < p-value < ANS: B PTS: 1 DIF: Easy OBJ: SFME.KELL.15.11.02 NAT: BUSPROG.SFME.KELL.15.03 STA: DISC.SFME.KELL.15.06 KEY: Bloom’s: Comprehension 53. If the p value is […]
Management Chapter 11 Type Error However This Increases The Chance of
CHAPTER 11: INTRODUCTION TO HYPOTHESIS TESTING TRUE/FALSE 1. A null hypothesis is a statement about the value of a population parameter. ANS: T PTS: 1 DIF: Easy OBJ: SFME.KELL.15.11.01 NAT: BUSPROG.SFME.KELL.15.03 STA: DISC.SFME.KELL.15.06 KEY: Bloom’s: Comprehension 2. An alternative or […]
Management Chapter 12 Drug Narrative Want Test Their Claim And
T PTS: 1 DIF: Easy OBJ: SFME.KELL.15.12.03 NAT: BUSPROG.SFME.KELL.15.03 STA: DISC.SFME.KELL.15.06 KEY: Bloom’s: Comprehension 53. If we have some idea about the value of sample proportion , we use that value in determining the sample size needed to estimate the […]
Management Chapter 12 In forming a 95% confidence interval for a population
CHAPTER 12: INFERENCE ABOUT A POPULATION TRUE/FALSE 1. In order to determine the p-value associated with hypothesis testing about the population mean , it is necessary to know the value of the test statistic. ANS: T PTS: 1 DIF: […]
Management Chapter 13 Tune Ups Past Months new Car Owner sold Cars
CHAPTER 13: INFERENCE ABOUT COMPARING TWO POPULATIONS TRUE/FALSE 1. Independent samples are those for which the selection process for one is not related to the selection process for the other. ANS: T PTS: 1 DIF: Easy OBJ: SFME.KELL.15.13.01 NAT: BUSPROG.SFME.KELL.15.03 […]
Management Chapter 13 The Pooled Proportion Estimate
46. In testing for the equality of two population variances, when the populations are normally distributed, the 5% level of significance has been used. To determine the rejection region, it will be necessary to refer to the F table corresponding […]
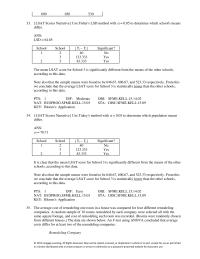
Management Chapter 14 Clear That The Mean Lsat
690 650 530 33. {LSAT Scores Narrative} Use Fisher’s LSD method with = 0.05 to determine which school’s means differ. ANS: LSD = 64.65 School School | i − j | Significant? 1 2 40 No 3 123.333 Yes […]
Management Chapter 14 In one-way ANOVA, the test statistic is defined as
CHAPTER 14: ANALYSIS OF VARIANCE TRUE/FALSE 1. The F-test used in one-way ANOVA is an extension of the t-test of 1 − 2. ANS: T PTS: 1 DIF: Easy OBJ: SFME.KELL.15.14.01 NAT: BUSPROG.SFME.KELL.15.03 STA: DISC.SFME.KELL.15.09 KEY: Bloom’s: Comprehension […]
Management Chapter 15 Cannot Reject The Null Hypothesis The Actual
CHAPTER 15: CHI-SQUARED TESTS TRUE/FALSE 1. A chi-squared distribution is symmetric. ANS: F PTS: 1 DIF: Easy OBJ: SFME.KELL.15.15.01 NAT: BUSPROG.SFME.KELL.15.03 STA: DISC.SFME.KELL.15.06 KEY: Bloom’s: Knowledge 2. A chi-squared test is used to describe a population of nominal data. ANS: […]
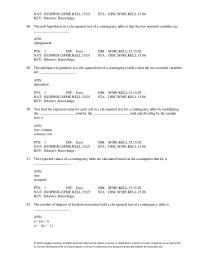
Management Chapter 15 Want Conduct Onetail Test Population Proportion
NAT: BUSPROG.SFME.KELL.15.03 STA: DISC.SFME.KELL.15.06 KEY: Bloom’s: Knowledge 48. The null hypothesis in a chi-squared test of a contingency table is that the two nominal variables are ____________________. ANS: independent PTS: 1 DIF: Easy OBJ: SFME.KELL.15.15.02 NAT: BUSPROG.SFME.KELL.15.03 STA: DISC.SFME.KELL.15.06 KEY: […]
Management Chapter 15 Which of the following tests is appropriate for nominal
b. The number of degrees of freedom in a test of a contingency table with r rows and c columns is (r − 1)(c − 1). c. The number of degrees of freedom in a goodness-of-fit test with k categories […]
Management Chapter 16 Consider The Following Data Values Variables
n−2 PTS: 1 DIF: Easy OBJ: SFME.KELL.15.16.03; SFME.KELL.15.16.04 NAT: BUSPROG.SFME.KELL.15.03 STA: DISC.SFME.KELL.15.07 KEY: Bloom’s: Knowledge 119. The coefficient of ____________________ measures the amount of variation in the dependent variable that is explained by the variation in the independent variable. ANS: […]
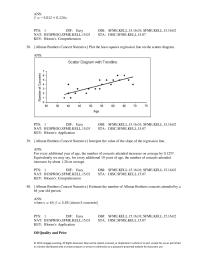
Management Chapter 16 The regression line has been fitted to
ANS: PTS: 1 DIF: Easy OBJ: SFME.KELL.15.16.01; SFME.KELL.15.16.02 NAT: BUSPROG.SFME.KELL.15.03 STA: DISC.SFME.KELL.15.07 KEY: Bloom’s: Comprehension 38. {Allman Brothers Concert Narrative} Plot the least squares regression line on the scatter diagram. ANS: PTS: 1 DIF: Easy OBJ: SFME.KELL.15.16.01; SFME.KELL.15.16.02 NAT: BUSPROG.SFME.KELL.15.03 […]
Management Chapter 16 These Data Are Shown Below average Daily Sunshine skin
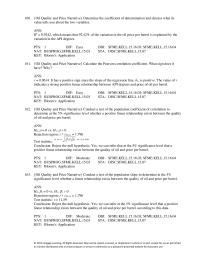
160. {Oil Quality and Price Narrative} Determine the coefficient of determination and discuss what its value tells you about the two variables. ANS: R2 = 0.9242, which means that 92.42% of the variation in the oil price per barrel is […]
Management Chapter 16 Winnings Amp Education Narrative Plot The Residuals
ANS: F PTS: 1 DIF: Easy OBJ: SFME.KELL.15.16.06 NAT: BUSPROG.SFME.KELL.15.03 STA: DISC.SFME.KELL.15.07 KEY: Bloom’s: Knowledge ANS: T PTS: 1 DIF: Easy OBJ: SFME.KELL.15.16.06 NAT: BUSPROG.SFME.KELL.15.03 STA: DISC.SFME.KELL.15.07 KEY: Bloom’s: Knowledge ANS: F PTS: 1 DIF: Easy OBJ: SFME.KELL.15.16.06 NAT: BUSPROG.SFME.KELL.15.03 […]
Management Chapter 16 This implies that an increase of $1 in advertising
CHAPTER 16A: SIMPLE LINEAR REGRESSION AND CORRELATION TRUE/FALSE 1. An inverse relationship between an independent variable x and a dependent variably y means that as x increases, y decreases, and vice versa. ANS: T PTS: 1 DIF: Easy OBJ: SFME.KELL.15.16.01; […]
Management Chapter 17 In a multiple regression analysis involving 50 observations
CHAPTER 17: MULTIPLE REGRESSION TRUE/FALSE 1. In multiple regression analysis, the adjusted coefficient of determination is adjusted for the number of independent variables and the sample size. ANS: T PTS: 1 DIF: Easy OBJ: SFME.KELL.15.17.02 NAT: BUSPROG.SFME.KELL.15.03 STA: DISC.SFME.KELL.15.07 KEY: […]
Management Chapter 17 When an additional explanatory variable is
KEY: Bloom’s: Application 19. {Student’s Final Grade Narrative} Interpret the coefficient b1. ANS: b1 = −3.18. This tells us that for each additional lecture skipped, the student’s final grade on average decreases by 3.18 points for the students in this […]
Management Chapter 18 Gpa Their First Three Years Range From
ANS: F PTS: 1 DIF: Easy OBJ: SFME.KELL.15.18.02; SFME.KELL.15.18.03 NAT: BUSPROG.SFME.KELL.15.03 STA: DISC.SFME.KELL.15.07 KEY: Bloom’s: Knowledge 34. In regression analysis, a nominal independent variable such as color, with three different categories such as red, white, and blue, is best represented […]
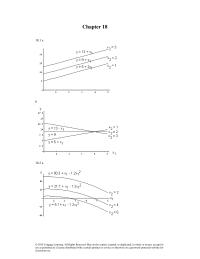
Management Chapter 18 In a first-order model with two predictors x1 and x2
CHAPTER 18: MODEL BUILDING TRUE/FALSE 1. Regression analysis allows the statistics practitioner to use mathematical models to realistically describe relationships between the dependent variable and independent variables. ANS: T PTS: 1 DIF: Easy OBJ: SFME.KELL.15.18.01 NAT: BUSPROG.SFME.KELL.15.03 STA: DISC.SFME.KELL.15.07 KEY: […]
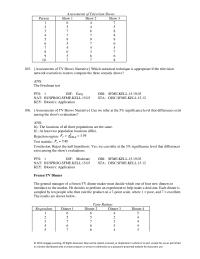
Management Chapter 19 Can we conclude at the 5% significance level that
Assessments of Television Shows Person Show 1 Show 2 Show 3 1 6 4 7 2 5 4 5 3 7 6 8 4 7 7 8 5 9 9 9 6 5 7 6 7 4 4 5 8 […]
Management Chapter 19 The nonparametric counterpart of the randomized block
c. at least two population locations are the same. d. at least two population locations differ. ANS: D PTS: 1 DIF: Easy OBJ: SFME.KELL.15.19.03 NAT: BUSPROG.SFME.KELL.15.03 STA: DISC.SFME.KELL.15.12 KEY: Bloom’s: Knowledge 62. The Kruskal-Wallis test is a nonparametric alternative to: […]
Management Chapter 19 The Sign Test Statistic Has What Kind
CHAPTER 19: NONPARAMETRIC STATISTICS TRUE/FALSE 1. The Wilcoxon rank sum test is used to compare two populations when the samples are independent and the data are either ordinal or interval but not normally distributed. ANS: T PTS: 1 DIF: Easy […]
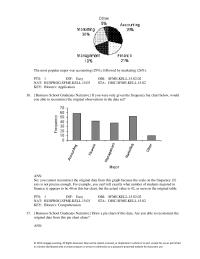
Management Chapter 2 A pie chart is a graphical representation
The most popular major was accounting (29%), followed by marketing (26%). PTS: 1 DIF: Easy OBJ: SFME.KELL.15.02.02 NAT: BUSPROG.SFME.KELL.15.03 STA: DISC.SFME.KELL.15.02 KEY: Bloom’s: Application 36. {Business School Graduates Narrative} If you were only given the frequency bar chart below, would […]
Management Chapter 2 Your age is an interval variable
CHAPTER 2: GRAPHICAL DESCRIPTIVE TECHNIQUES I TRUE/FALSE 1. Your age group (1-9; 10-19; 20-29; 30-39; etc.) is an interval variable. ANS: F PTS: 1 DIF: Easy OBJ: SFME.KELL.15.02.01 NAT: BUSPROG.SFME.KELL.15.03 STA: DISC.SFME.KELL.15.02 KEY: Bloom’s: Comprehension 2. Your gender is a […]
Management Chapter 20 And Are respectively The Trend
CHAPTER 20: TIME-SERIES ANALYSIS AND FORECASTING TRUE/FALSE 1. The purpose of using the moving average is to take away the short-term seasonal and random variation, leaving behind a combined trend and cyclical movement. ANS: T PTS: 1 DIF: Easy OBJ: […]
Management Chapter 20 The quadratic model would appear to be the best model
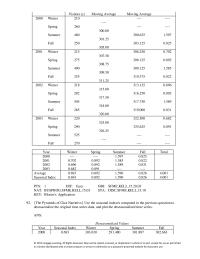
Visitors (y) Moving Average Moving Average 2000 Winter 210 —- —- —- Spring 260 —- —- 300.00 Summer 480 300.625 1.597 301.25 Fall 250 303.125 0.825 305.00 2001 Winter 215 306.250 0.702 307.50 Spring 275 308.125 0.892 308.75 Summer 490 […]
Management Chapter 20 What can you conclude from your time-series smoothing?
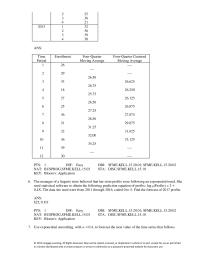
2 25 3 36 4 21 2013 1 32 2 36 3 39 4 30 ANS: Time Enrollment Four-Quarter Four-Quarter Centered Period Moving Average Moving Average 1 26 —- —- 2 29 —- 26.50 3 33 26.625 26.75 4 18 […]
Management Chapter 20 What do the seasonal indexes tell us?
58. To measure the seasonal variation, we compute seasonal ____________________, which gauge the degree to which the seasons differ from one another. ANS: indexes PTS: 1 DIF: Easy OBJ: SFME.KELL.15.20.03 NAT: BUSPROG.SFME.KELL.15.03 STA: DISC.SFME.KELL.15.10 KEY: Bloom’s: Knowledge 59. One application […]
Management Chapter 21 If a control chart finds the standard deviation in the
S; R R; S PTS: 1 DIF: Easy OBJ: SFME.KELL.15.21.03 NAT: BUSPROG.SFME.KELL.15.03 STA: DISC.SFME.KELL.15.11 KEY: Bloom’s: Knowledge 41. When estimating the population standard deviation, you typically use the sample standard deviations. However, for a variety of reasons, statistical process control […]
Management Chapter 21 In statistical process control, a Type II error occurs if
CHAPTER 21: STATISTICAL PROCESS CONTROL TRUE/FALSE 1. Chance variation in general cannot be eliminated without changing the process. ANS: T PTS: 1 DIF: Easy OBJ: SFME.KELL.15.21.01 NAT: BUSPROG.SFME.KELL.15.03 STA: DISC.SFME.KELL.15.11 KEY: Bloom’s: Knowledge 2. Chance variation was built into the […]
Management Chapter 22 A surgeon is involved in a $3 million malpractice suit
CHAPTER 22: DECISION ANALYSIS TRUE/FALSE 1. We can use the payoff table to calculate the expected monetary value (EMV) and the expected opportunity loss (EOL) of each act (alternative). ANS: F PTS: 1 DIF: Easy OBJ: SFME.KELL.15.22.01 NAT: BUSPROG.SFME.KELL.15.03 STA: […]
Management Chapter 22 The amounts in the payoff table shown below
35. We calculate the expected payoff with perfect information (EPPI) by multiplying the probability of each state of nature by the smallest payoff associated with that state of nature, and then summing the products. ANS: F PTS: 1 DIF: Easy […]
Management Chapter 23 Type Error Way Knowing Without More Information
ANS: T PTS: 1 DIF: Easy OBJ: SFME.KELL.15.23.01 NAT: BUSPROG.SFME.KELL.15.03 STA: DISC.SFME.KELL.15.01 KEY: Bloom’s: Knowledge ANS: T PTS: 1 DIF: Easy OBJ: SFME.KELL.15.23.01 NAT: BUSPROG.SFME.KELL.15.03 STA: DISC.SFME.KELL.15.01 KEY: Bloom’s: Knowledge ANS: F PTS: 1 DIF: Easy OBJ: SFME.KELL.15.23.01 NAT: BUSPROG.SFME.KELL.15.03 […]
Management Chapter 3 The Number Digits The Left The Decimal
CHAPTER 3: GRAPHICAL DESCRIPTIVE TECHNIQUES II TRUE/FALSE 1. The intervals (classes) in a histogram do not overlap. ANS: T PTS: 1 DIF: Easy OBJ: SFME.KELL.15.03.01 NAT: BUSPROG.SFME.KELL.15.03 STA: DISC.SFME.KELL.15.02 KEY: Bloom’s: Knowledge 2. The intervals (classes) in a histogram are […]
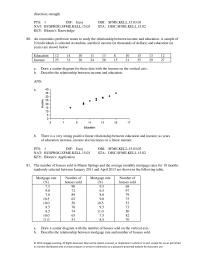
Management Chapter 3 There is a strong negative linear relationship
direction; strength PTS: 1 DIF: Easy OBJ: SFME.KELL.15.03.03 NAT: BUSPROG.SFME.KELL.15.03 STA: DISC.SFME.KELL.15.02 KEY: Bloom’s: Knowledge 80. An economics professor wants to study the relationship between income and education. A sample of 10 individuals is selected at random, and their income […]
Management Chapter 3 A pie chart is a graphical representation
< 5 11 < 10 18 < 15 24 < 20 33 < 25 45 Fill in the frequencies for each class in the above table. ANS: 11; 7; 6; 9; 12 PTS: 1 DIF: Easy OBJ: SFME.KELL.15.03.01 NAT: BUSPROG.SFME.KELL.15.03 […]
Management Chapter 4 During the second year, however, the investment suffers
ANS: F PTS: 1 DIF: Easy OBJ: SFME.KELL.15.04.07; SFME.KELL.15.04.08 NAT: BUSPROG.SFME.KELL.15.03 STA: DISC.SFME.KELL.15.02 KEY: Bloom’s: Comprehension ANS: T PTS: 1 DIF: Easy OBJ: SFME.KELL.15.04.07; SFME.KELL.15.04.08 NAT: BUSPROG.SFME.KELL.15.03 STA: DISC.SFME.KELL.15.02 KEY: Bloom’s: Comprehension © 2015 Cengage Learning. All Rights Reserved. May […]
Management Chapter 4 In a negatively skewed distribution, the mean is
CHAPTER 4A: NUMERICAL DESCRIPTIVE TECHNIQUES TRUE/FALSE 1. The mean is affected by extreme values but the median is not. ANS: T PTS: 1 DIF: Easy OBJ: SFME.KELL.15.04.01 NAT: BUSPROG.SFME.KELL.15.03 STA: DISC.SFME.KELL.15.02 KEY: Bloom’s: Knowledge 2. The mean is a measure […]
Management Chapter 4 Is the distribution of the number of computers symmetric
ANS: T PTS: 1 DIF: Easy OBJ: SFME.KELL.15.04.04 NAT: BUSPROG.SFME.KELL.15.03 STA: DISC.SFME.KELL.15.02 KEY: Bloom’s: Application ANS: T PTS: 1 DIF: Easy OBJ: SFME.KELL.15.04.04 NAT: BUSPROG.SFME.KELL.15.03 STA: DISC.SFME.KELL.15.02 KEY: Bloom’s: Knowledge ANS: F PTS: 1 DIF: Easy OBJ: SFME.KELL.15.04.04 NAT: BUSPROG.SFME.KELL.15.03 […]
Management Chapter 4 The average score for a class of 30 students was 75
b. The distance from the smallest observation to Q1 is the same as the distance from Q3 to the largest observation. c. The distance from the smallest observation to Q2 is the same as the distance from Q2 to the […]
Management Chapter 4 Volunteers Narrative Compute The Range The Data
ANS: C PTS: 1 DIF: Easy OBJ: SFME.KELL.15.04.02 NAT: BUSPROG.SFME.KELL.15.03 STA: DISC.SFME.KELL.15.02 KEY: Bloom’s: Knowledge 65. Which of the following types of data has no measure of variability? a. Interval data. b. Nominal data. c. Bimodal data. d. None of […]
Management Chapter 5 A question on a survey that was not answered is an example
ANS: F PTS: 1 DIF: Easy OBJ: SFME.KELL.15.05.01 NAT: BUSPROG.SFME.KELL.15.03 STA: DISC.SFME.KELL.15.01 KEY: Bloom’s: Comprehension ANS: F PTS: 1 DIF: Easy OBJ: SFME.KELL.15.05.01 NAT: BUSPROG.SFME.KELL.15.03 STA: DISC.SFME.KELL.15.01 KEY: Bloom’s: Comprehension ANS: F PTS: 1 DIF: Easy OBJ: SFME.KELL.15.05.01 NAT: BUSPROG.SFME.KELL.15.03 […]
Management Chapter 6 A sample space of an experiment consists of the
ANS: .657 PTS: 1 DIF: Easy OBJ: SFME.KELL.15.06.02 NAT: BUSPROG.SFME.KELL.15.03 STA: DISC.SFME.KELL.15.03 KEY: Bloom’s: Application 63. {Business Majors Narrative} What is the chance that exactly one majors in accounting? ANS: .441 PTS: 1 DIF: Easy OBJ: SFME.KELL.15.06.02 NAT: BUSPROG.SFME.KELL.15.03 STA: […]
Management Chapter 6 If the two events are mutually exclusive and
132. Suppose P(A) = 0.50, P(B) = 0.40, and P(B|A) = 0.30. a. Find P(A and B). b. Find P(A or B). c. Find P(A|B). ANS: a. 0.15 b. 0.75 c. 0.375 PTS: 1 DIF: Easy OBJ: SFME.KELL.15.06.03 NAT: BUSPROG.SFME.KELL.15.03 […]
Management Chapter 6 The collection of all the possible outcomes of a random
CHAPTER 6: PROBABILITY TRUE/FALSE 1. The relative frequency approach to probability uses long term relative frequencies, often based on past data. ANS: T PTS: 1 DIF: Easy OBJ: SFME.KELL.15.06.01 NAT: BUSPROG.SFME.KELL.15.03 STA: DISC.SFME.KELL.15.03 KEY: Bloom’s: Comprehension 2. Predicting the outcome […]
Management Chapter 7 A lab at the DeBakey Institute orders 150 rats a
ANS: PTS: 1 DIF: Moderate OBJ: SFME.KELL.15.07.02 NAT: BUSPROG.SFME.KELL.15.03 STA: DISC.SFME.KELL.15.04 KEY: Bloom’s: Application 63. {Number of Birds Narrative} Compute the mean and variance of Y. ANS: PTS: 1 DIF: Moderate OBJ: SFME.KELL.15.07.02 NAT: BUSPROG.SFME.KELL.15.03 STA: DISC.SFME.KELL.15.04 KEY: Bloom’s: Application […]
Management Chapter 7 variable is discrete or continuous, and specify the possible
130. {Elizabeth’s Portfolio Narrative} Compute the standard deviation of the returns on the portfolio assuming that the coefficient of correlation is 0.5. ANS: When = 0.5; V(Rp) = 0.03781. Therefore, the standard deviation of the portfolio’s return is 0.194 […]
Management Chapter 7 What is the probability distribution of Y?
ANS: T PTS: 1 DIF: Easy OBJ: SFME.KELL.15.07.05 NAT: BUSPROG.SFME.KELL.15.03 STA: DISC.SFME.KELL.15.04 KEY: Bloom’s: Knowledge ANS: T PTS: 1 DIF: Easy OBJ: SFME.KELL.15.07.05 NAT: BUSPROG.SFME.KELL.15.03 STA: DISC.SFME.KELL.15.04 KEY: Bloom’s: Comprehension ANS: T PTS: 1 DIF: Easy OBJ: SFME.KELL.15.07.05 NAT: BUSPROG.SFME.KELL.15.03 […]
Management Chapter 7 where E refers to the expected value
CHAPTER 7A: RANDOM VARIABLES AND DISCRETE PROBABILITY DISTRIBUTIONS TRUE/FALSE 1. The time required to drive from New York to New Mexico is a discrete random variable. ANS: F PTS: 1 DIF: Easy OBJ: SFME.KELL.15.07.01 NAT: BUSPROG.SFME.KELL.15.03 STA: DISC.SFME.KELL.15.04 KEY: Bloom’s: […]
Management Chapter 8 A continuous random variable is one that can assume an uncountable
CHAPTER 8: CONTINUOUS PROBABILITY DISTRIBUTIONS TRUE/FALSE 1. Since there is an infinite number of values a continuous random variable can assume, the probability of each individual value is virtually 0. ANS: T PTS: 1 DIF: Easy OBJ: SFME.KELL.15.08.01 NAT: BUSPROG.SFME.KELL.15.03 […]
Management Chapter 8 The Mean Exponential Distribution Then
a. 0.9082 b. 0.9962 c. 0.6568 PTS: 1 DIF: Easy OBJ: SFME.KELL.15.08.02 NAT: BUSPROG.SFME.KELL.15.03 STA: DISC.SFME.KELL.15.04 KEY: Bloom’s: Application 65. If Z is a standard normal random variable, find the value z for which: a. the area between 0 and […]
Management Chapter 8 The probability for any individual value of a continuous
127. {Phone Orders Narrative} What proportion of customers having to hold more than 1.5 minutes will hang up before placing an order? ANS: P(X > 1.5) = e−0.5 = 0.6065 PTS: 1 DIF: Easy OBJ: SFME.KELL.15.08.03 NAT: BUSPROG.SFME.KELL.15.03 STA: DISC.SFME.KELL.15.04 […]
Management Chapter 9 Given that X is a binomial random variable with very large
33. Recall the rule of thumb used to indicate when the normal distribution is a good approximation of the sampling distribution for the sample proportion . For the combination n = 50, p = 0.05, the rule is satisfied. ANS: […]
Management Chapter 9 Prior Experience Has Shown That The Weight
CHAPTER 9: SAMPLING DISTRIBUTIONS TRUE/FALSE 1. The Central Limit Theorem permits us to draw conclusions about a population based on a sample alone, without having any knowledge about the distribution of that population. And this works no matter what the […]