b.
The distance from the smallest observation to Q1 is the same as the distance from Q3 to the
largest observation.
c.
The distance from the smallest observation to Q2 is the same as the distance from Q2 to the
largest observation.
d.
The distance from Q1 to Q3 is half of the distance from the smallest to the largest
observation.
126. Which of the following summary measures cannot be easily approximated from a box plot?
a.
The range
b.
The interquartile range
c.
The second quartile
d.
The standard deviation
127. The interquartile range is the difference between the:
a.
largest and smallest numbers in the data set.
b.
25th percentile and the 75th percentile.
c.
median and the mean.
d.
None of these choices.
128. In a positively skewed distribution, which of the following is the correct statement?
a.
The distance from Q1 to Q2 is larger than the distance from Q2 to Q3.
b.
The distance from Q1 to Q2 is smaller than the distance from Q2 to Q3.
c.
The distance from Q1 to Q2 is twice the distance from Q2 to Q3.
d.
The distance from Q1 to Q2 is half the distance from Q2 to Q3.
129. Which measures of central location and variability are considered to be resistant to extreme values?
a.
The mean and standard deviation.
b.
The mode and variance.
c.
The median and interquartile range.
d.
None of these choices.
130. Which of the following measures of variability is not sensitive to extreme values?
a.
The range
b.
The standard deviation
c.
The interquartile range
d.
The coefficient of variation
131. Which of the following statements is true?
a.
The lower or first quartile is labeled Q1 and is equal to the 25th percentile.
b.
The second quartile is labeled Q2 and is equal to the median.
c.
The upper or third quartile is labeled Q3 and is equal to the 75th percentile.
d.
All of these choices are true.
132. If the first and second quartiles are closer to each other than are the second and third quartiles, then the
shape of the histogram based on the quartiles is ____________________.
133. If the first and second quartiles are farther apart than the second and third quartiles, then the shape of
the histogram based on the quartiles is ____________________.
ANS:
134. ____________________ are extremely large or extremely small observations.
135. The middle line inside the box in a box plot represents the ____________________.
136. The horizontal lines extending to the left and to the right of the box in a box plot are called
____________________.
137. Any points that lie outside the whiskers on a box plot are called ____________________.
138. The ____________________ measures the spread between the middle 50% of the observations.
139. The 10th ____________________ is the value for which 10% of the observations are less than that
value.
140. A percentile is a measure of ____________________ standing.
141. Q2 is another name for the ____________________.
Weights of Police Officers
The following data represent the weights in pounds of a sample of 25 police officers: 164, 148, 137,
157, 173, 156, 177, 172, 169, 165, 145, 168, 163, 162, 174, 152, 156, 168, 154, 151, 174, 146, 134,
140, and 171.
142. {Weights of Police Officers Narrative} Determine the location and value of the lower quartile of the
weights.
143. {Weights of Police Officers Narrative} Determine the location and value of the second quartile of the
weights.
144. {Weights of Police Officers Narrative} Determine the location and value of the upper quartile of the
weights.
145. {Weights of Police Officers Narrative} Describe the shape of the distribution of weights based on the
quartiles’ values.
146. {Weights of Police Officers Narrative} Determine the location and value of the 60th percentile of the
weights.
147. {Weights of Police Officers Narrative} Construct a frequency distribution for the data, using five class
intervals, and the value 130 as the lower limit of the first class.
148. {Weights of Police Officers Narrative} Construct a relative frequency histogram for the data, using
five class intervals and the value 130 as the lower limit of the first class.
ANS:
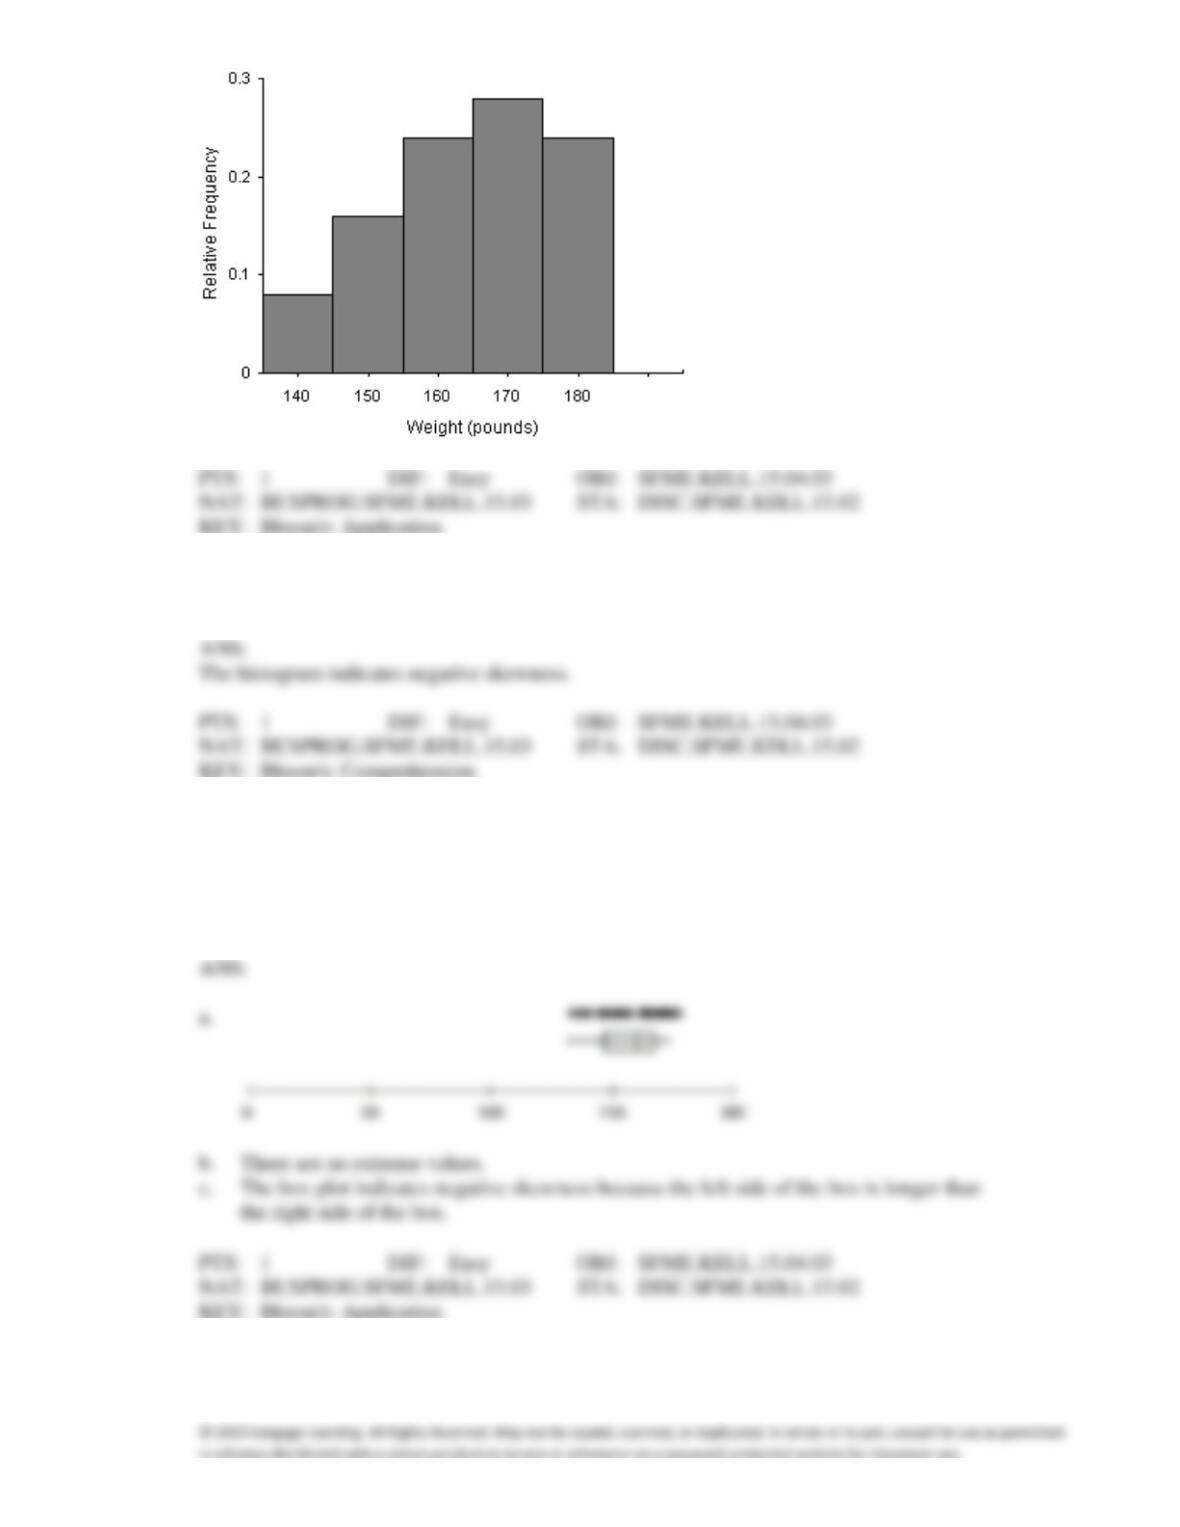
149. {Weights of Police Officers Narrative} What does the histogram tell you about the distribution of the
weights of workers?
150. {Weights of Police Officers Narrative}
a.
Construct a box plot for the weights.
b.
Are there any extreme values?
c.
What does the box plot tell you about the distribution of the data?
b.
There are no extreme values.
the right side of the box.
151. {Weights of Police Officers Narrative} Calculate the 3rd and 7th deciles of the data.
Hours of Playing Video Games
Suppose that the following data provide the hours of playing video games per week for a sample of 15
high school students in Roanoke, Virginia: 5, 11, 25, 19, 18, 20, 27, 13, 8, 10, 15, 19, 18, 9, and 12.
152. {Hours of Playing Video Games Narrative} Determine the location and value of the first quartile.
153. {Hours of Playing Video Games Narrative} Determine the location and value of the second quartile.
154. {Hours of Playing Video Games Narrative} Determine the location and value of the third quartile.
155. {Hours of Playing Video Games Narrative} Calculate and interpret the interquartile range.
Ages of Jockeys
The following data represent the ages in years of a sample of 25 jockeys from a local race track: 31,
43, 56, 23, 49, 42, 33, 61, 44, 28, 48, 38, 44, 35, 40, 64, 52, 42, 47, 39, 53, 27, 36, 35, and 20.
156. {Ages of Jockeys Narrative} Find the lower quartile of the ages.
157. {Ages of Jockeys Narrative} Find the upper quartile of the ages.
158. {Ages of Jockeys Narrative} Compute the interquartile range of the data and interpret its meaning.
159. {Ages of Jockeys Narrative}
a.
Construct a box plot for the ages and identify any extreme values.
b.
What does the box plot tell you about the distribution of the data?
a.
The box plot lies below. There are no extreme values.
skewness).
160. {Ages of Jockeys Narrative} Construct a relative frequency distribution for the data, using five class
intervals and the value 20 as the lower limit of the first class.
161. {Ages of Jockeys Narrative}
a.
Construct a relative frequency histogram for the data.
b.
What does the histogram tell you about the distribution of the data?
ANS:
b.
The histogram is close to symmetric.
Yearly Donations
The following data represent the yearly donations (in thousands of dollars) of a sample of 13
benefactors: 26.5, 23.5, 29.7, 24.8, 21.1, 24.3, 20.4, 22.7, 27.2, 23.7, 24.1, 24.8, and 28.2.
162. {Yearly Donations Narrative} Compute the lower quartile for the donations.
163. {Yearly Donations Narrative} Compute median.
164. {Yearly Donations Narrative} Compute the upper quartile.
165. {Yearly Donations Narrative}
a.
Describe the shape of distribution of donations based on the values of the quartiles.
b.
Give a possible reason for the shape of this data set, in terms of donations.
skewed.
166. {Yearly Donations Narrative} Compute and interpret the 90th percentile.
Test Scores
Suppose that an analysis of a set of test scores reveals that: Q1 = 45, Q2 = 85, Q3 = 105.
167. {Test Scores Narrative} What do these statistics tell you about the shape of the distribution of test
scores?
168. {Test Scores Narrative} What can you say about the relative position of each of the observations 34,
84, and 104, within this data set?
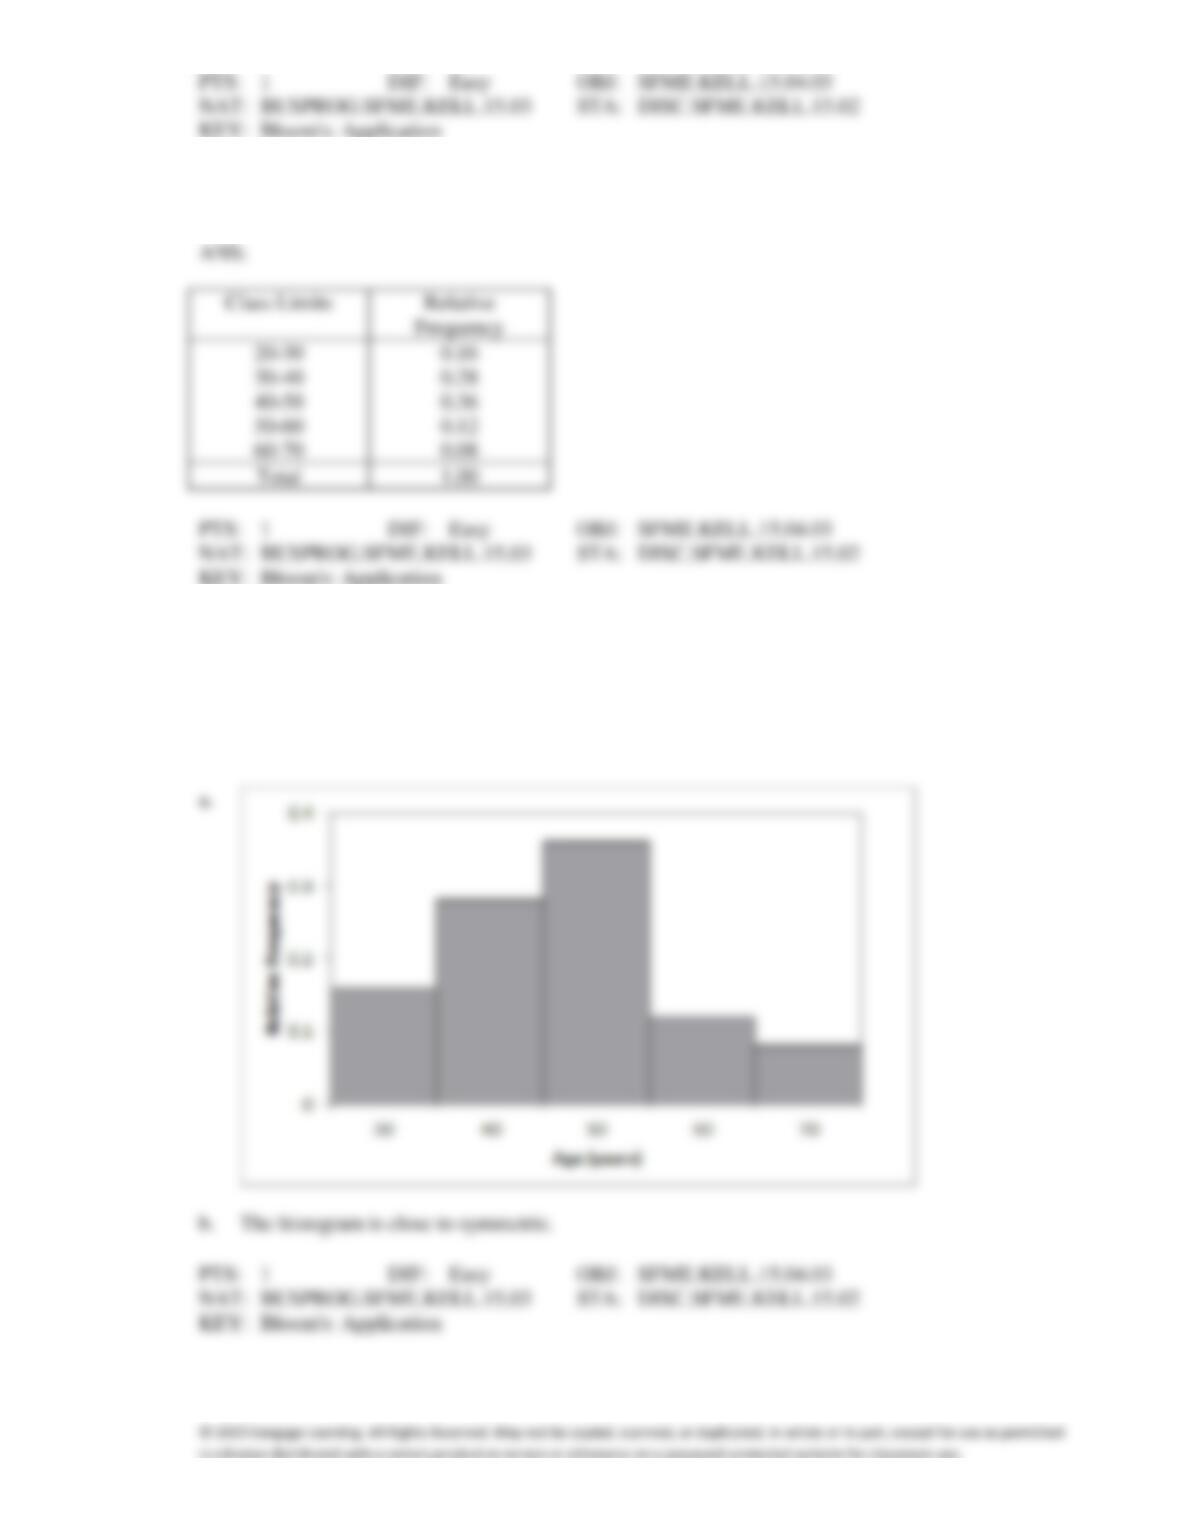
169. {Test Scores Narrative} Calculate the interquartile range. What does this tell you about the data?
Ages of Retirees
A sociologist recently conducted a survey of retirees over 65 years of age whose net worth is too high
to qualify for Medicaid and who have no private health insurance. The ages of 20 uninsured retirees
were as follows: 65, 66, 67, 68, 69, 70, 71, 73, 74, 75, 78, 79, 80, 81, 86, 87, 91, 92, 94, and 97.
170. {Ages of Retirees Narrative} Calculate the first quartile of the ages of the uninsured retirees.
171. {Ages of Retirees Narrative} Calculate the third quartile of the ages of the uninsured retirees.
172. {Ages of Retirees Narrative} Identify the interquartile range of the ages of the uninsured retirees.
What does this value tell you about the data?
173. {Ages of Retirees Narrative} What does the value of the first quartile tell you?
174. {Ages of Retirees Narrative} What does the value of the third quartile tell you?
175. {Ages of Retirees Narrative} Describe the shape of the distribution of ages by comparing the quartiles.