Chapter 13
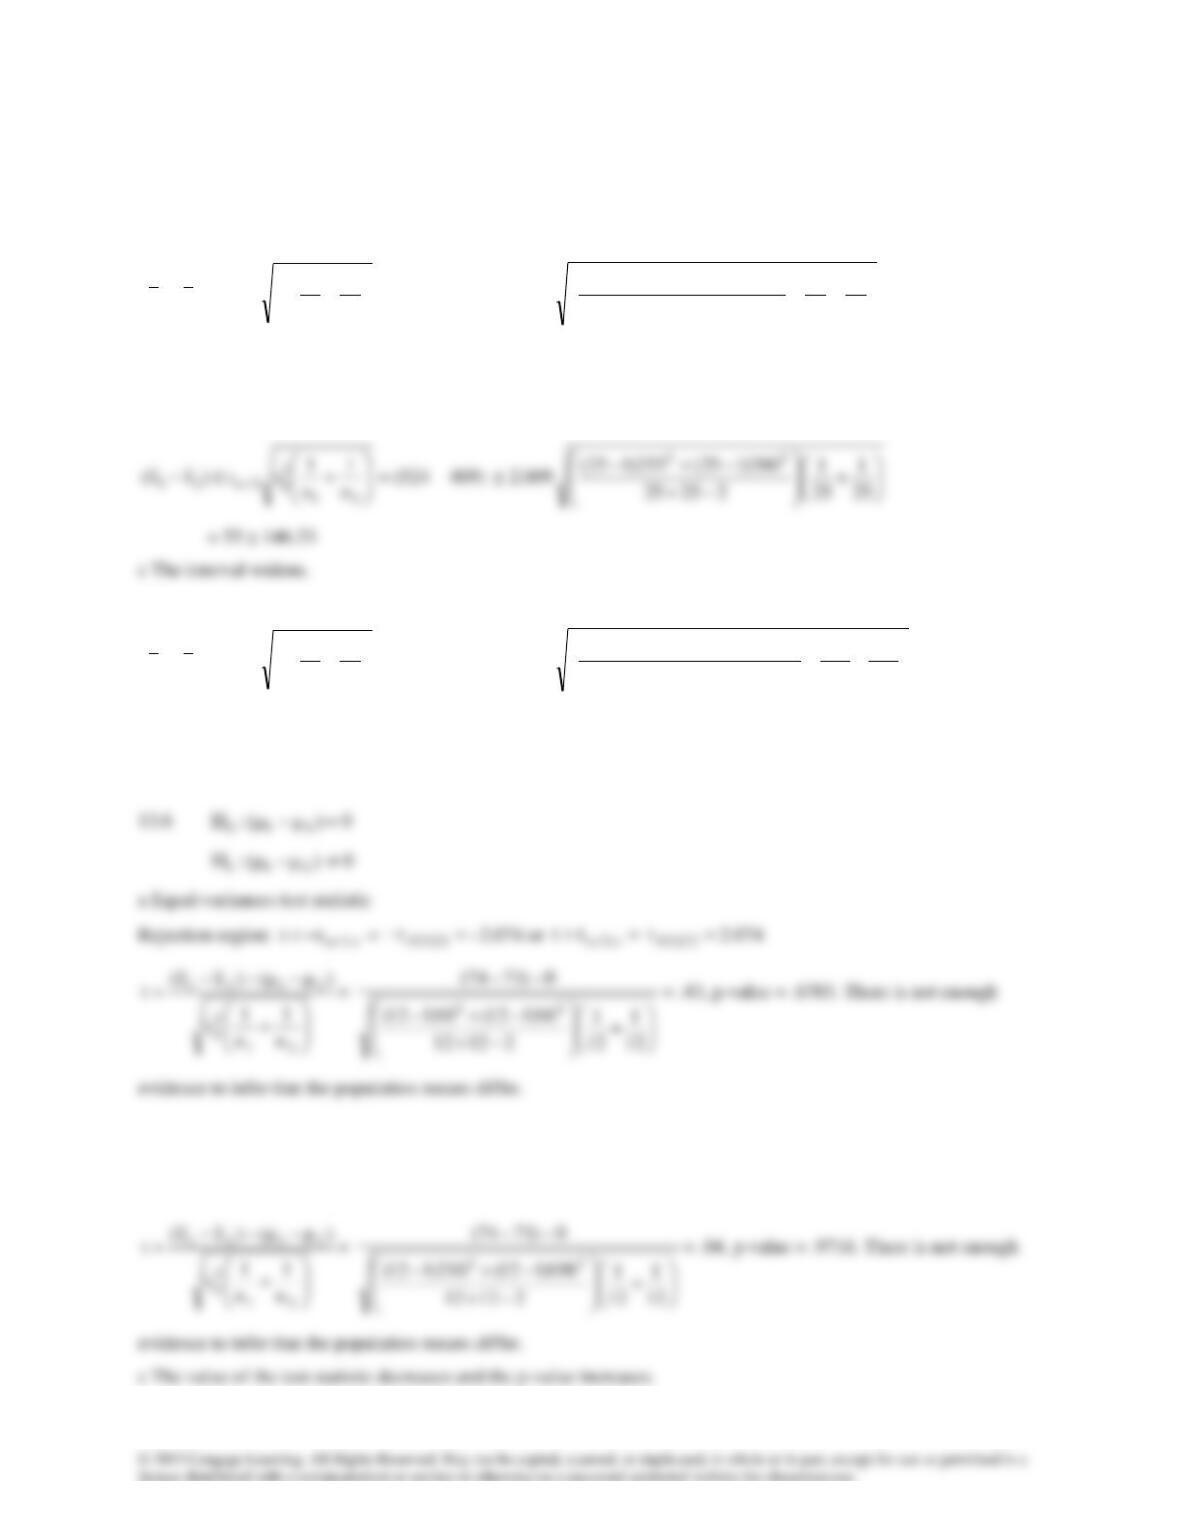
13.5a Equal-variances estimator
+−
21
2
p2/21 n
1
n
1
st)xx(
= (524 – 469)
2.009
+
−+
−+−
25
1
25
1
22525
131)125(129)125(22
= 55
73.87
b Equal-variances estimator
+−
21
2
p2/21 n
1
n
1
st)xx(
d Equal-variances estimator
+−
21
2
p2/21 n
1
n
1
st)xx(
= (524 – 469)
1.972
+
−+
−+−
100
1
100
1
2100100
131)1100(129)1100( 22
= 55
36.26
e The interval narrows.
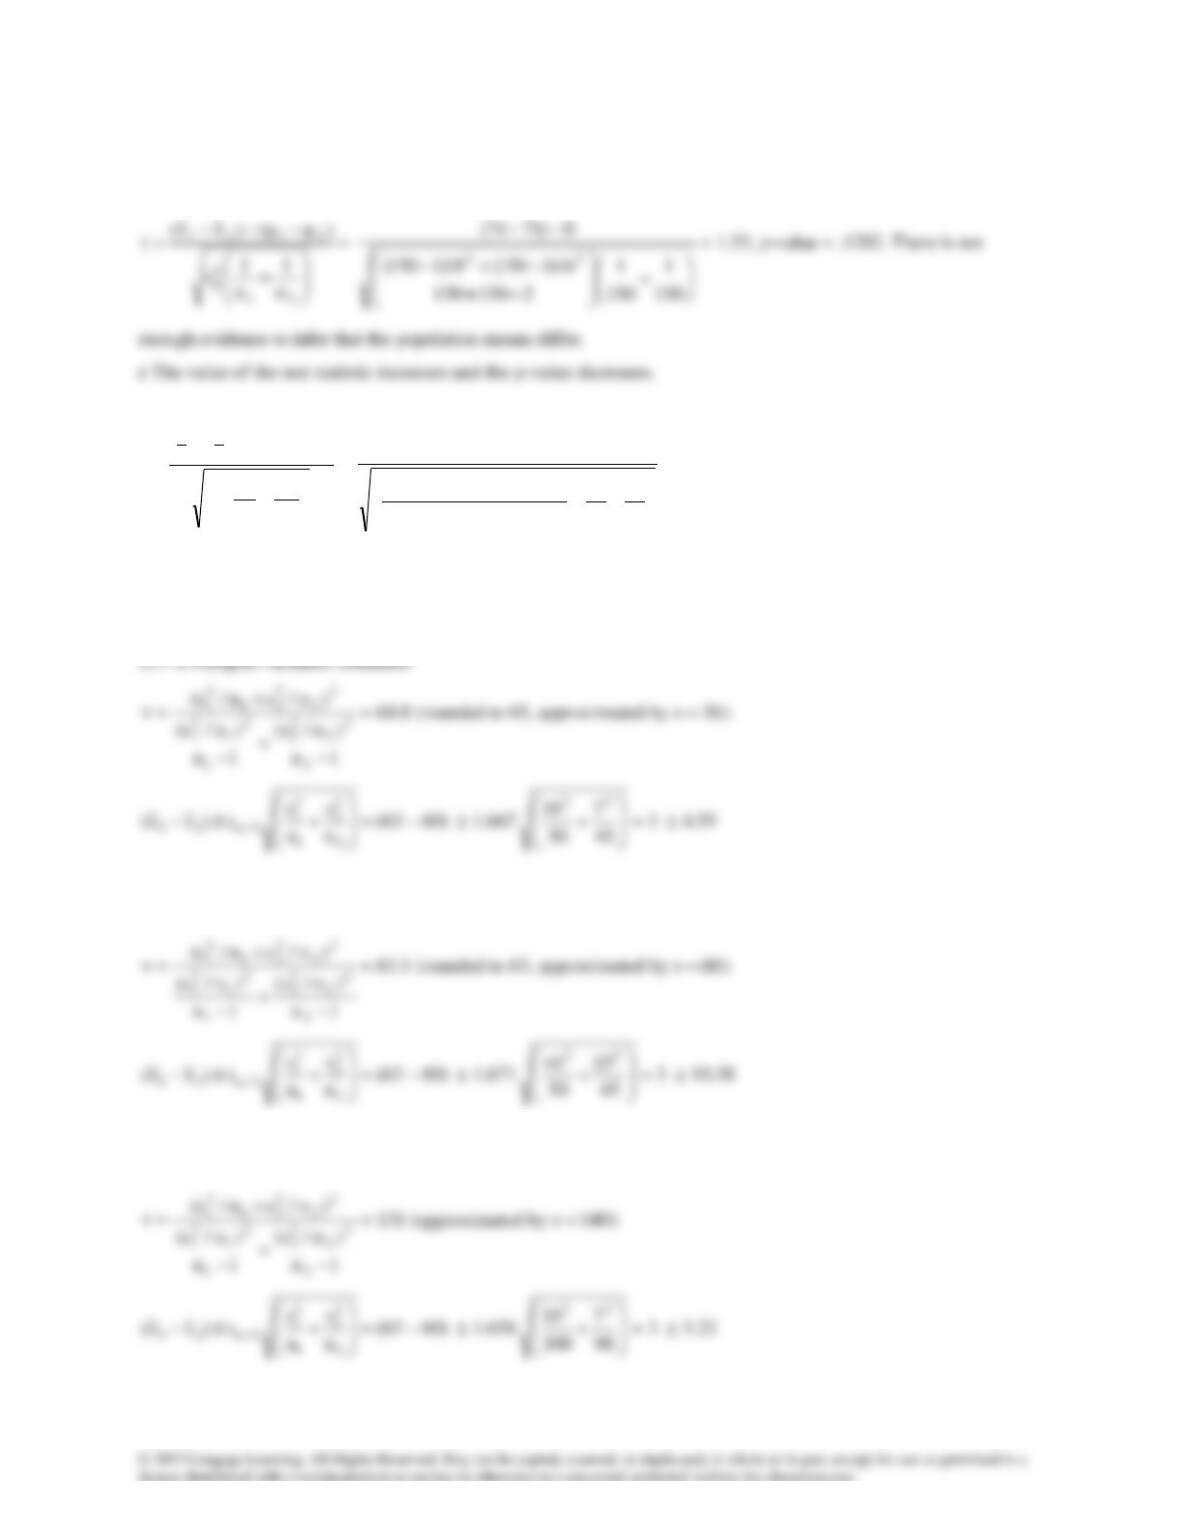
b Equal-variances test statistic
Rejection region:
=− ,2/
tt
=− 22,025.
t
–2.074 or
= ,2/
tt
=
22,0 2 5.
t
2.074
d Equal-variances test statistic
Rejection region:
=− ,2/
tt
=− 298,025.
t
–1.960 or
= ,2/
tt
=
298,025.
t
1.960
f Rejection region:
=− ,2/
tt
=− 22,025.
t
–2.074 or
= ,2/
tt
=
22,025.
t
2.074
+
−−−
=
21
2
p
2121
n
1
n
1
s
)()xx(
t
=
+
−+
−+−
−−
12
1
12
1
21212
16)112(18)112(
0)7176(
22
= .72, p-value = .4796. There is not enough
evidence to infer that the population means differ.
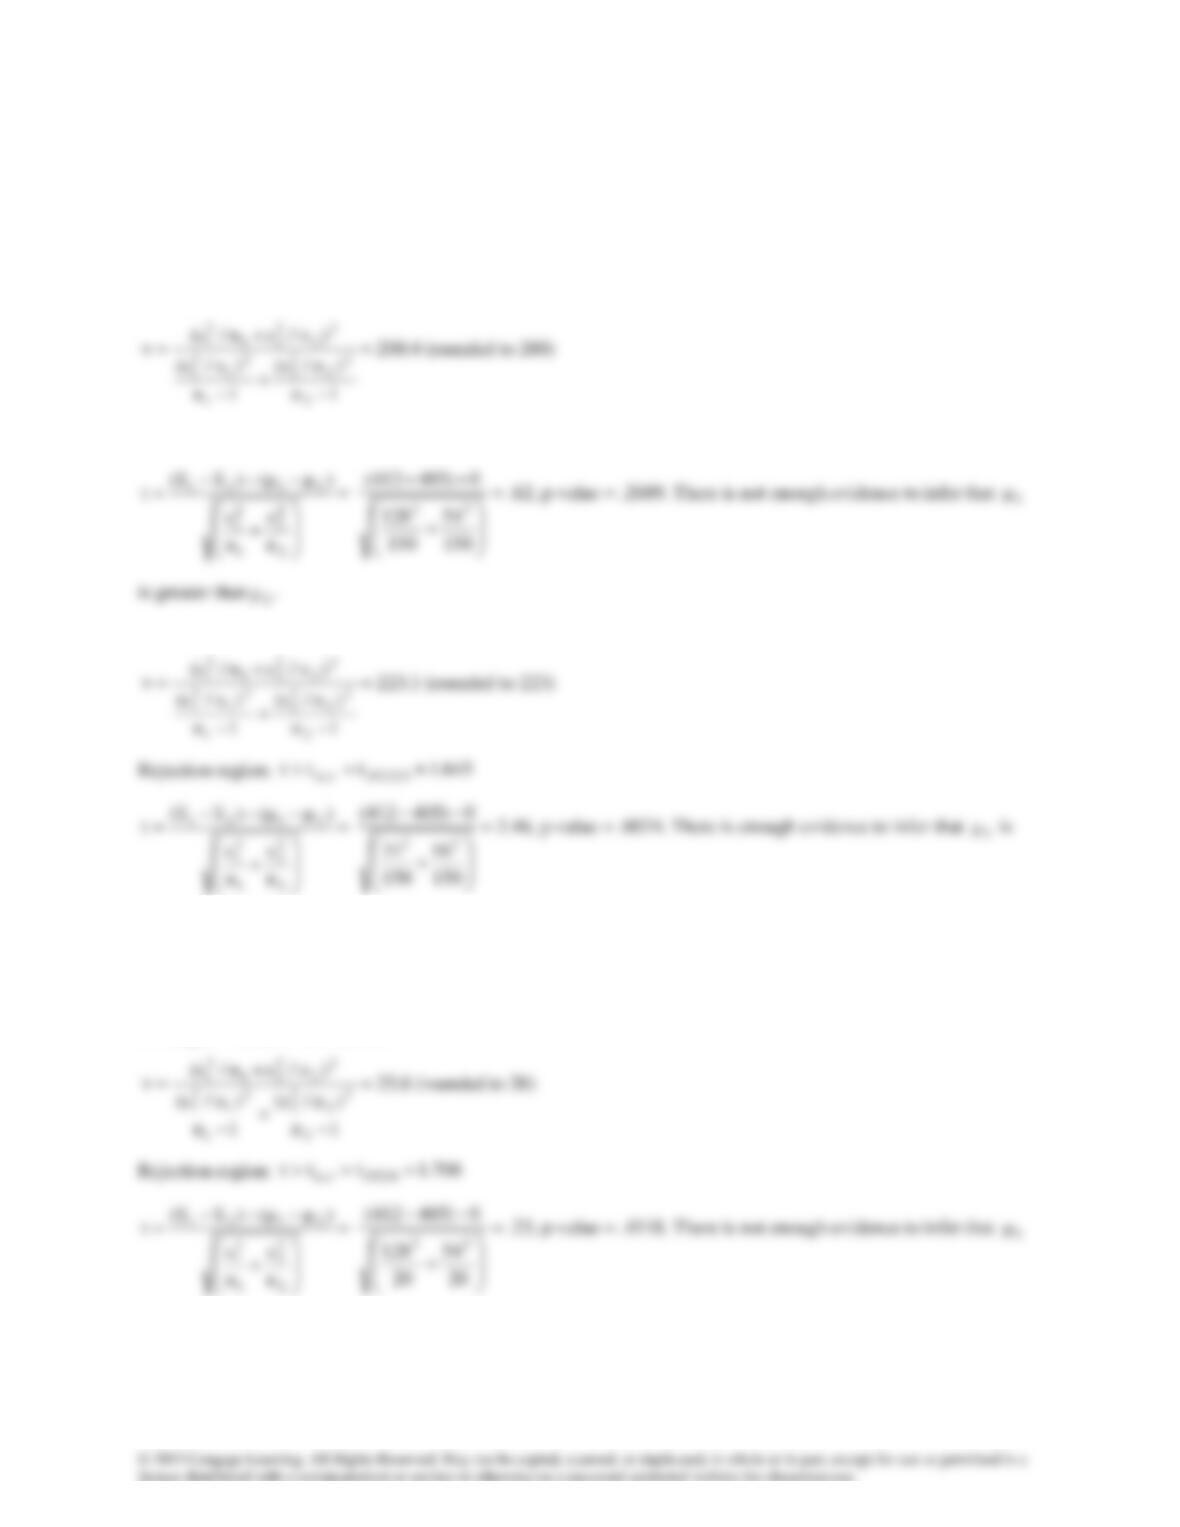
g The value of the test statistic increases and the p-value decreases.
b Unequal-variances estimator
c The interval widens.
d Unequal-variances estimator
e The interval narrows.
13.8
)(:H 210 −
= 0
)(:H 211 −
0
a Unequal-variances test statistic
Rejection region:
653.1ttt 200,05., ==
b Unequal-variances test statistic
greater than
2
.
c The value of the test statistic increases and the p-value decreases.
d Unequal-variances test statistic
is greater than
2
.
e The value of the test statistic decreases and the p-value increases.
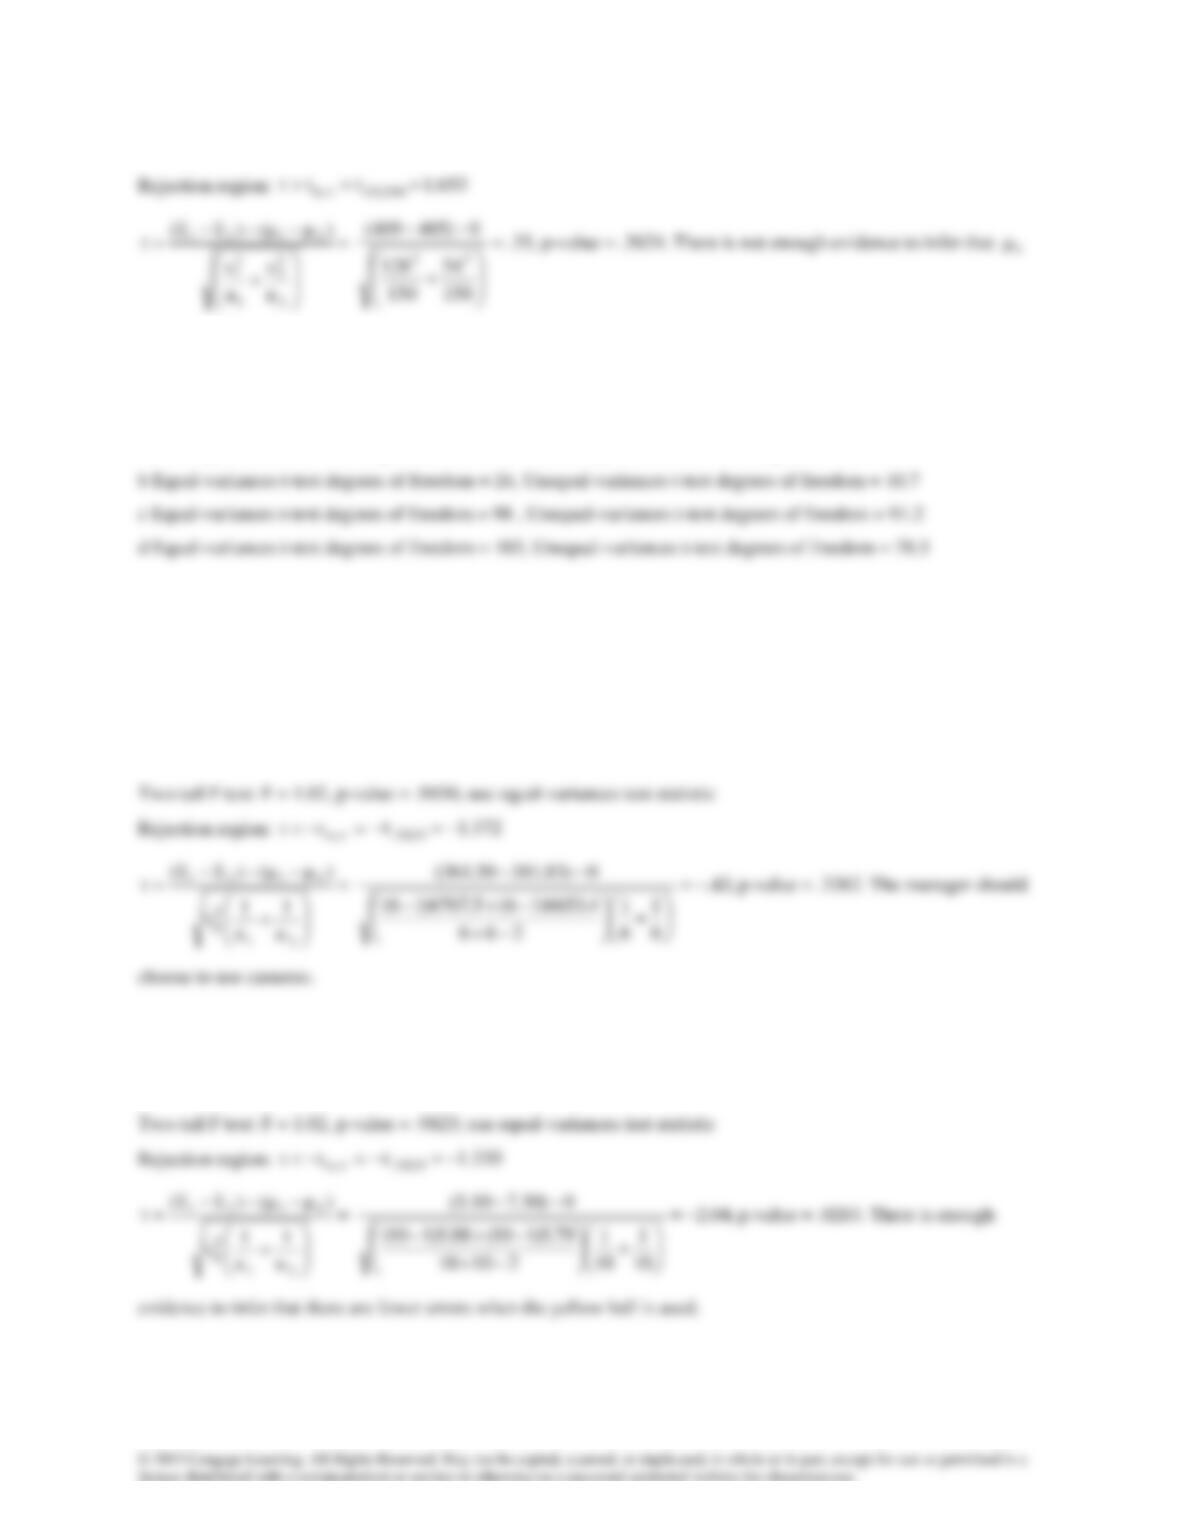
f Unequal-variances test statistic
is greater than
2
.
g The value of the test statistic decreases and the p-value increases.
13.9 a Equal-variances t-test degrees of freedom = 28, Unequal-variances t-test degrees of freedom =26.4
13.10 a In all cases the equal-variances t-test degrees of freedom is greater than the unequal-variances t-test degrees
of freedom.
13.11
)(:H 210 −
= 0
)(:H 211 −
< 0
13.12
)(:H 210 −
= 0
)(:H 211 −
< 0
13.13
)(:H 210 −
= 0
)(:H 211 −
< 0
13.14
)(:H 210 −
= 0
)(:H 211 −
0
13.15
)(:H 210 −
= 0
)(:H 211 −
< 0
13.16
)(:H 210 −
= 0
)(:H 211 −
0
13.17a
)(:H 210 −
= 0
)(:H 211 −
> 0
13.18
)(:H 210 −
= 0
− )(:H 211
0
enough evidence to infer that oat bran is different from other cereals in terms of cholesterol reduction?
13.19 a
)(:H 210 −
= 0
− )(:H 211
0
Two-tail F test: F = .50, p-value = 0; use unequal-variances test statistic
conclude that a difference in mean listening times exist between the two populations.
c The histograms are bell shaped.
13.20 a
)(:H 210 −
= 0
)(:H 211 −
> 0
enough evidence to infer that the cruise ships are attracting younger customers.
13.21a
)(:H 210 −
= 0
− )(:H 211
0
Two-tail F test: F = .98, p-value = .9254; use equal-variances test statistic
c The histograms are bell shaped.
13.22
)(:H 210 −
= 0
− )(:H 211
0
enough evidence to retain supplier A – switch to supplier B.
13.23
)(:H 210 −
= 0
− )(:H 211
0
13.24a
)(:H 210 −
= 0
− )(:H 211
0
Two-tail F test: F = 5.18, p-value = .0019; use unequal-variances test statistic
the two packages differ in the amount of time needed to learn how to use them.
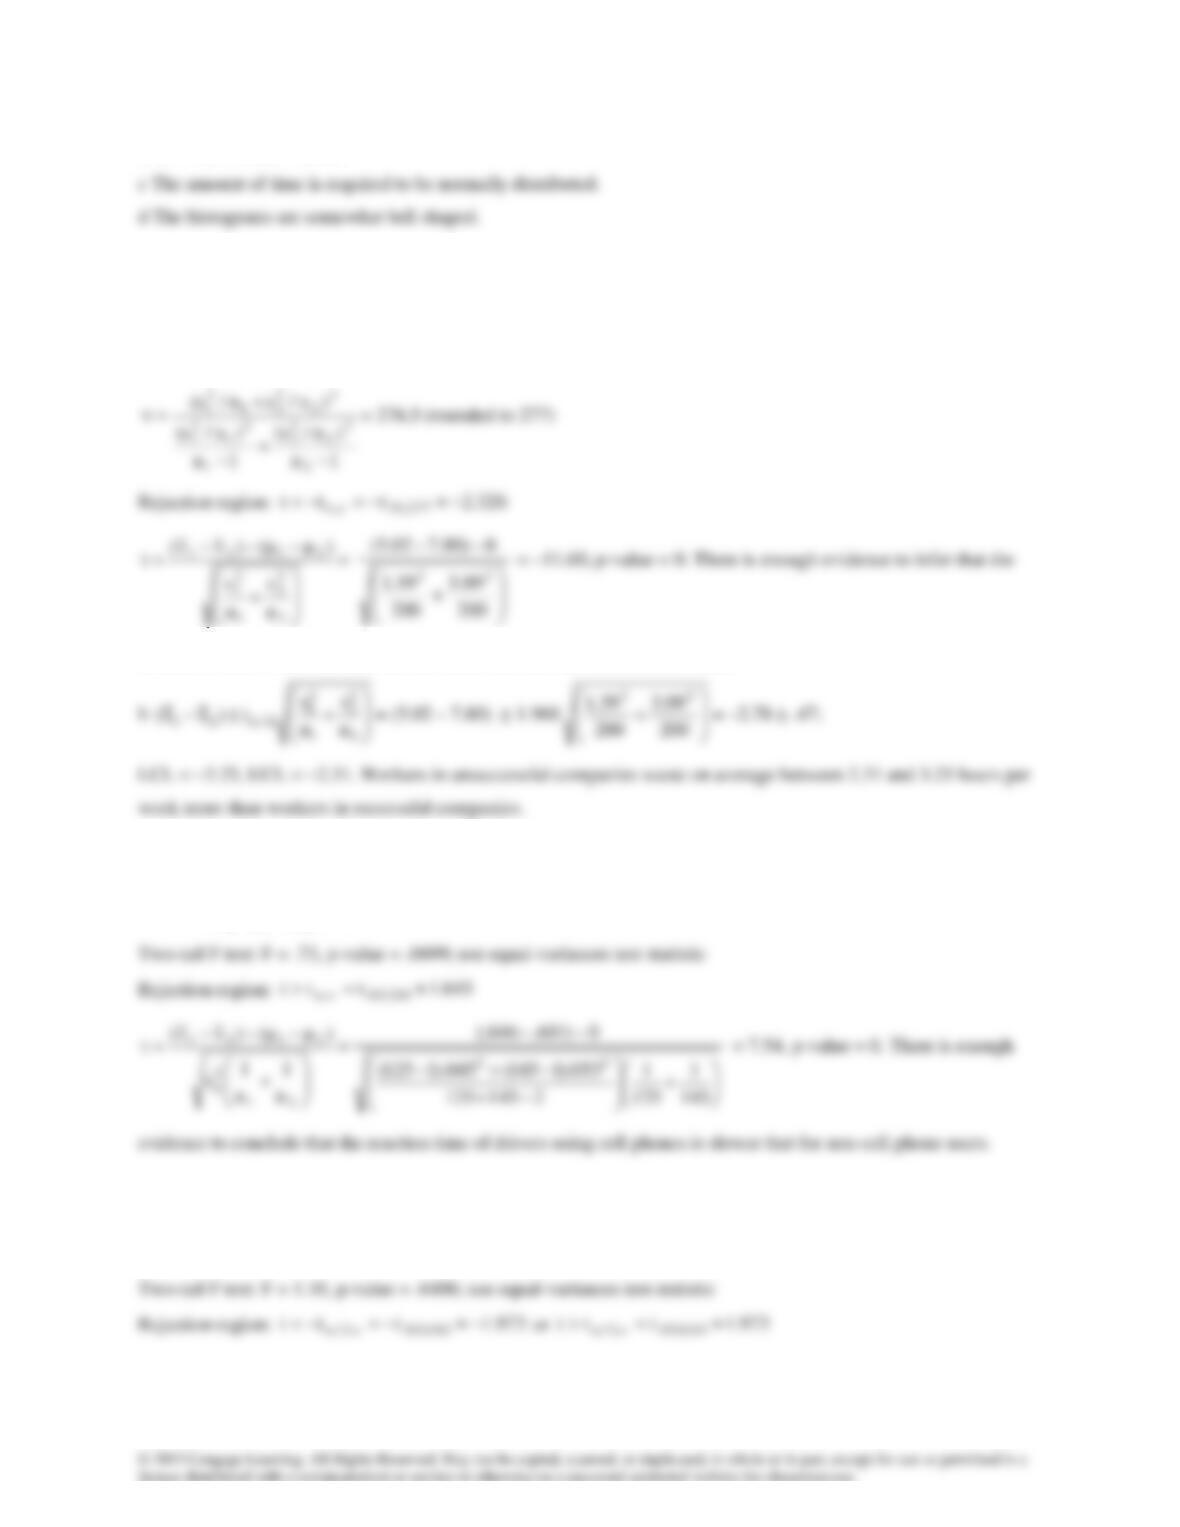
LCL = 4.31, UCL = 23.65
13.25a
)(:H 210 −
= 0
)(:H 211 −
< 0
Two-tail F test: F = 5.18, p-value = .0019; use unequal-variances test statistic
amount of time wasted in unsuccessful firms exceeds that of successful firms.
13.26
)(:H 210 −
= 0
− )(:H 211
0
13.27
)(:H 210 −
= 0
− )(:H 211
0
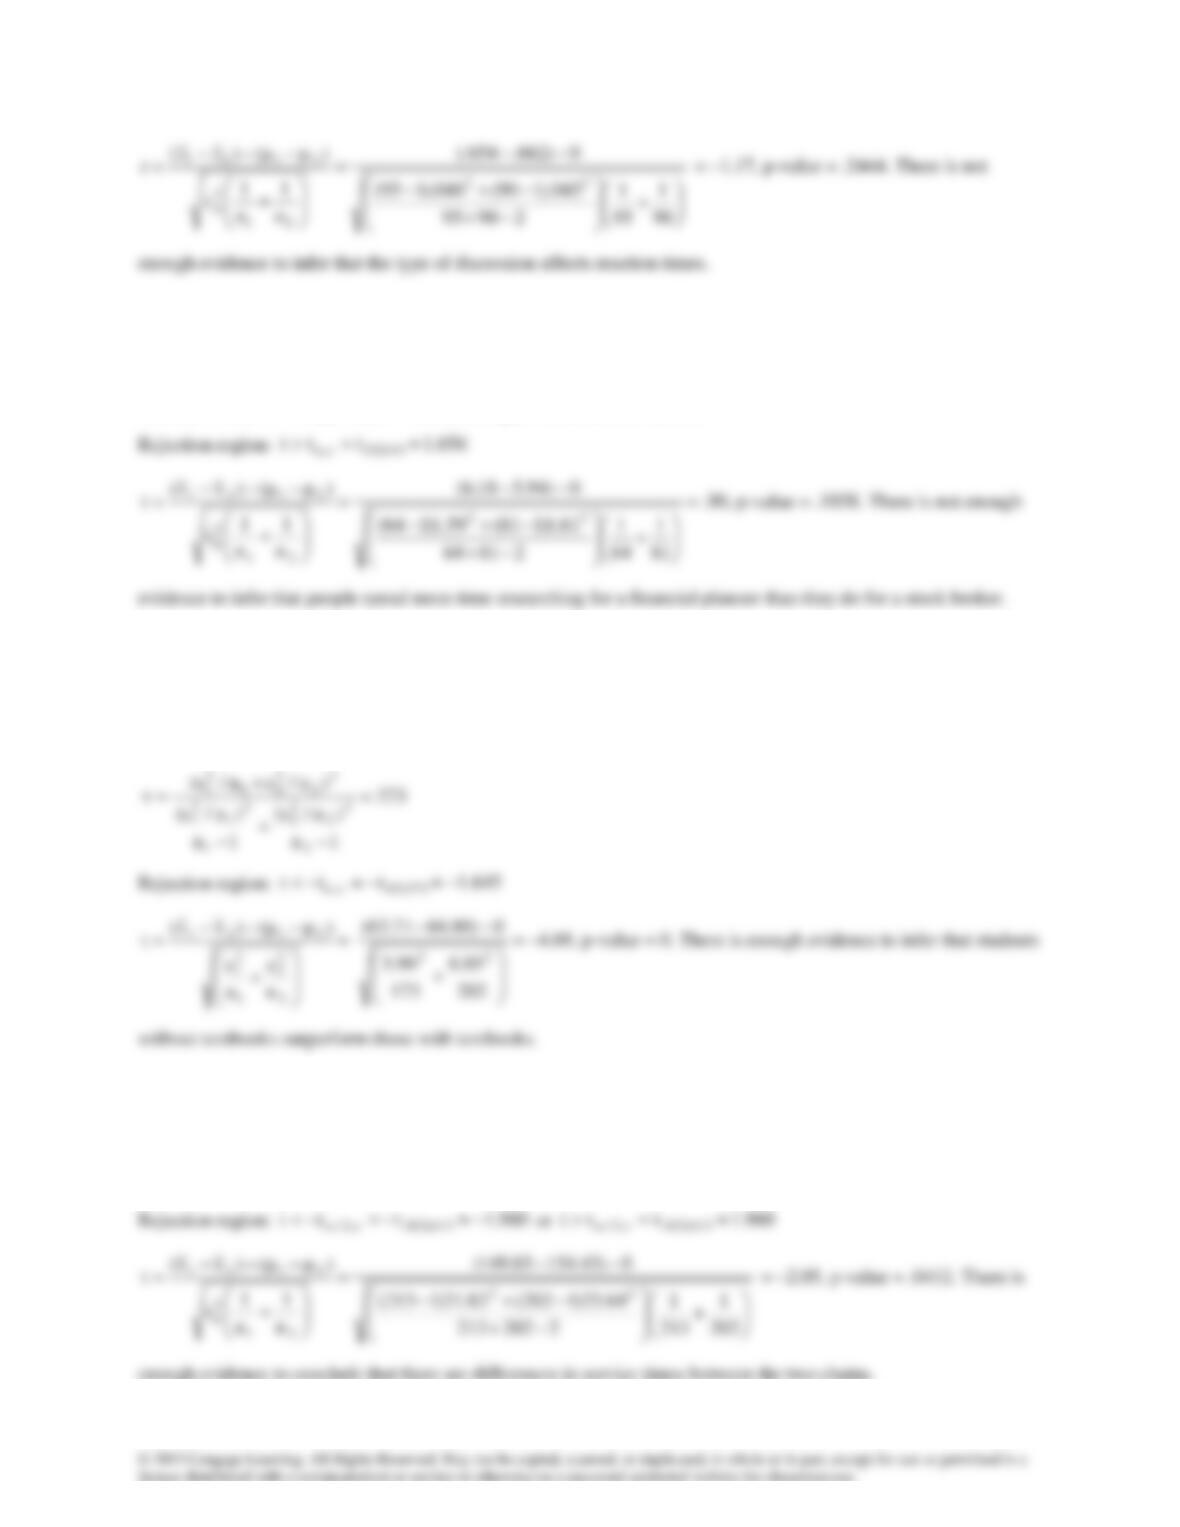
13.28
)(:H 210 −
= 0
)(:H 211 −
> 0
Two-tail F test: F = .97, p-value = .9054; use equal-variances test statistic
13.29
)(:H 210 −
= 0
)(:H 211 −
< 0
Two-tail F test: F = .74, p-value = .0446; use unequal-variances test statistic
13.30
)(:H 210 −
= 0
− )(:H 211
0
Two-tail F test: F = .85, p-value = .2494; use equal-variances test statistic
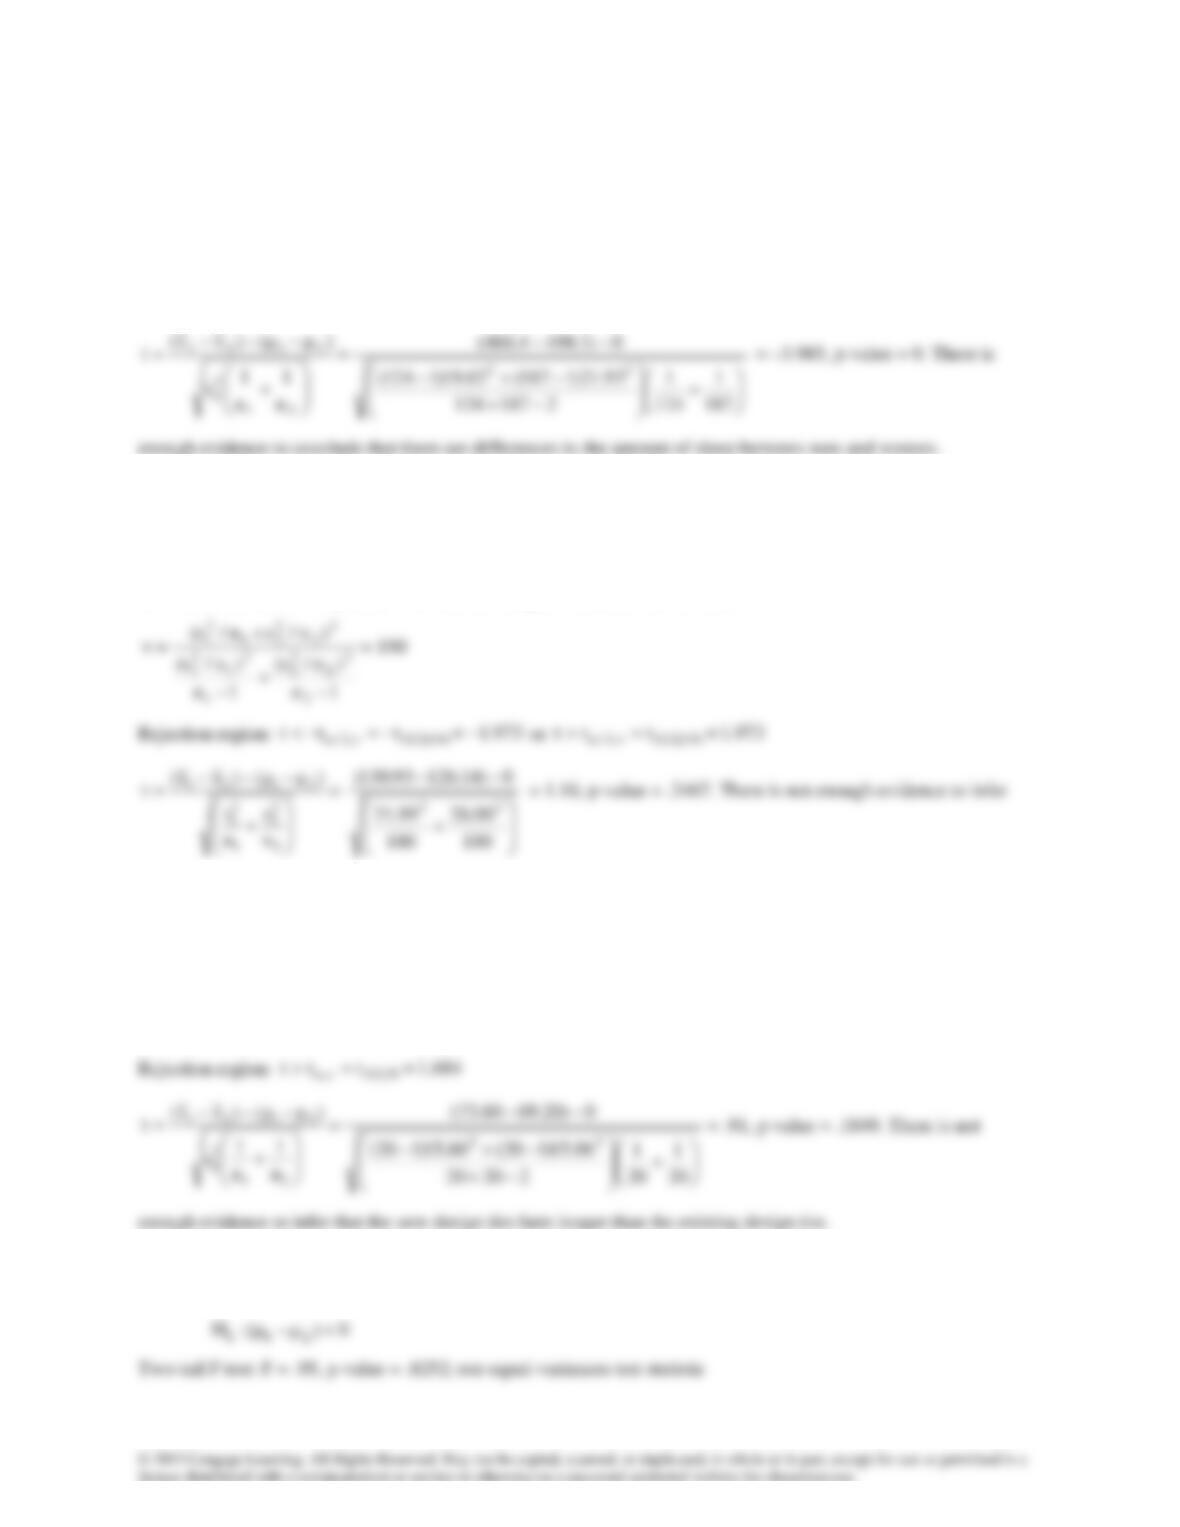
13.31
)(:H 210 −
= 0
− )(:H 211
0
Two-tail F test: F = .80, p-value = .1818; use equal-variances test statistic
Rejection region:
960.1ttt 309,025.,2/ −−=−
or
960.1ttt 3 09,025.,2/ =
13.32 a
)(:H 210 −
= 0
− )(:H 211
0
Two-tail F test: F = 1.51, p-value = .0402; use unequal-variances test statistic
that differences exist between the two types of customers.
13.33
)(:H 210 −
= 0
)(:H 211 −
> 0
Two-tail F test: F = 1.07, p-value = .8792; use equal-variances test statistic
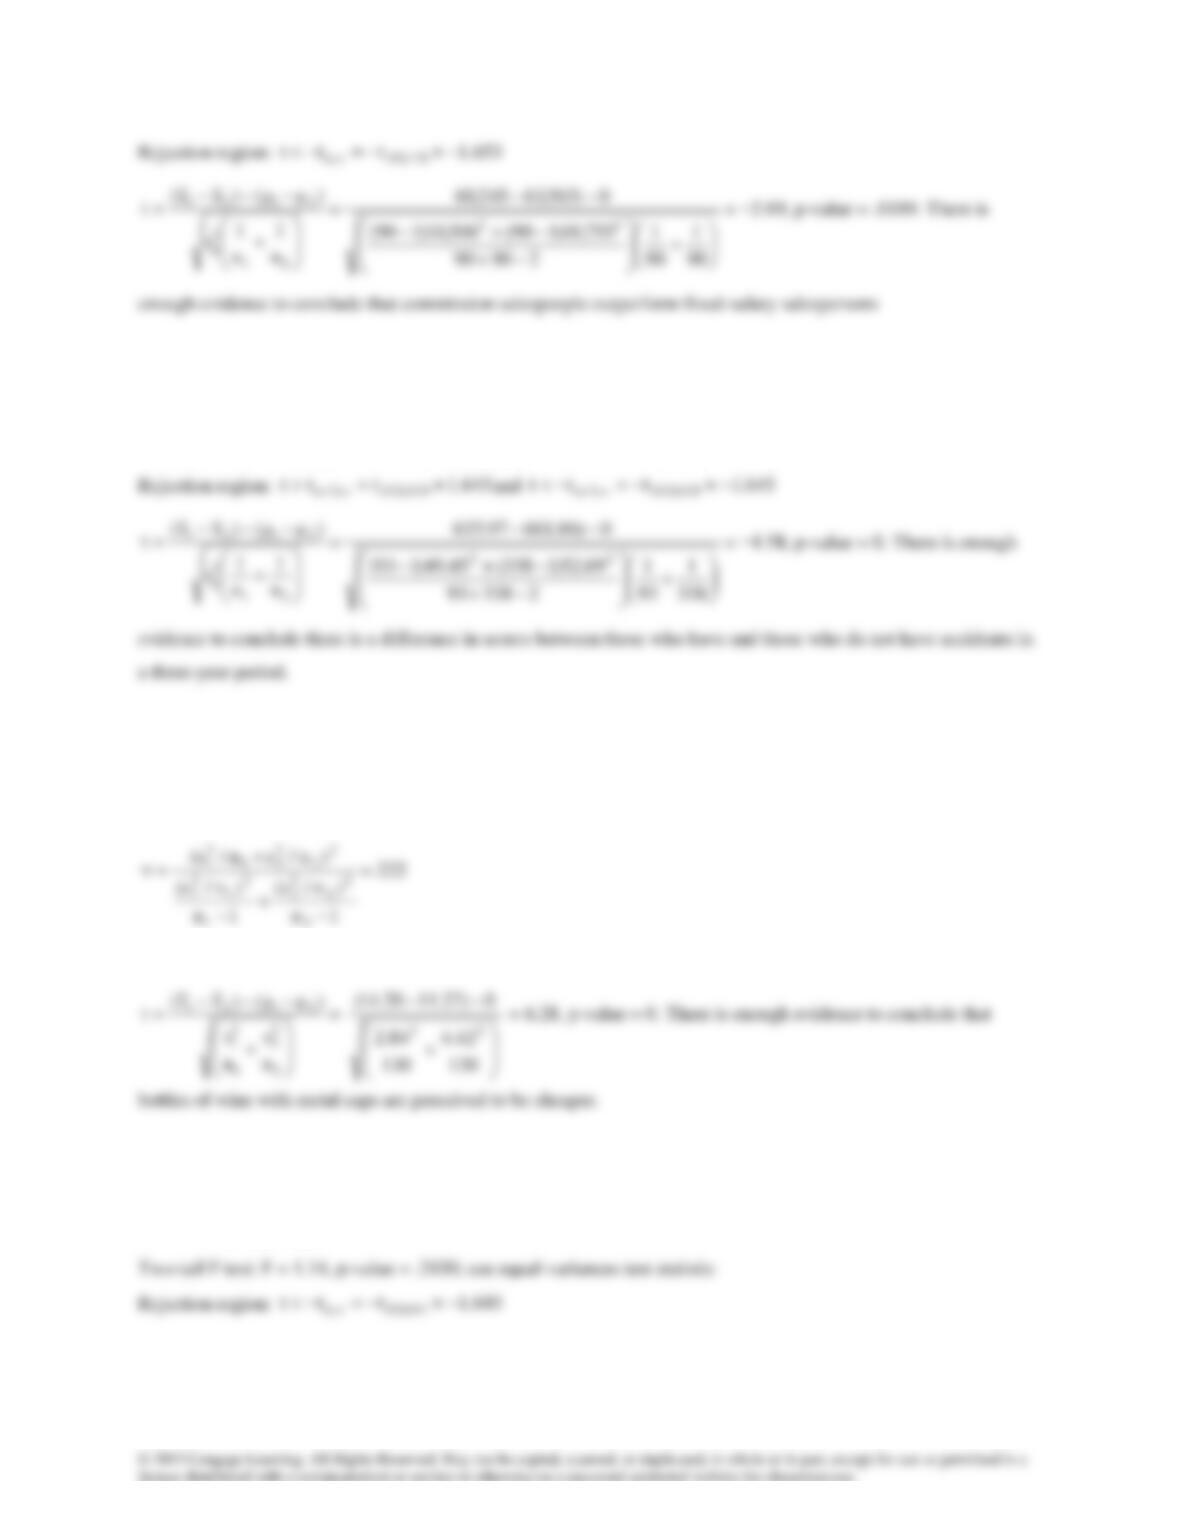
13.34
0)(:H 210 =−
13.35
0)(:H 210 =−
)(:H 211 −
0
Two-tail F test: F = .88, p-value = .4709; use equal-variances test statistic
13.36
)(:H 210 −
= 0
)(:H 211 −
> 0
Two-tail F test: F = .41, p-value = 0; use unequal-variances test statistic
Rejection region:
645.1ttt 222,05., =
13.37
0)(:H 210 =−
)(:H 211 −
< 0
13.38
)(:H 210 −
= 0
)(:H 211 −
> 0
Two-tail F test: F = 3.14, p-value = 0; use unequal-variances test statistic
13.39a
)(:H 210 −
= 0
)(:H 211 −
> 0
b
)(:H 210 −
= 0
)(:H 211 −
> 0
13.40
)(:H 210 −
= 0
)(:H 211 −
> 0
3.41
)(:H 210 −
= 0
)(:H 211 −
> 0
Two-tail F test: F = 5.99, p-value = .0001; use unequal-variances test statistic
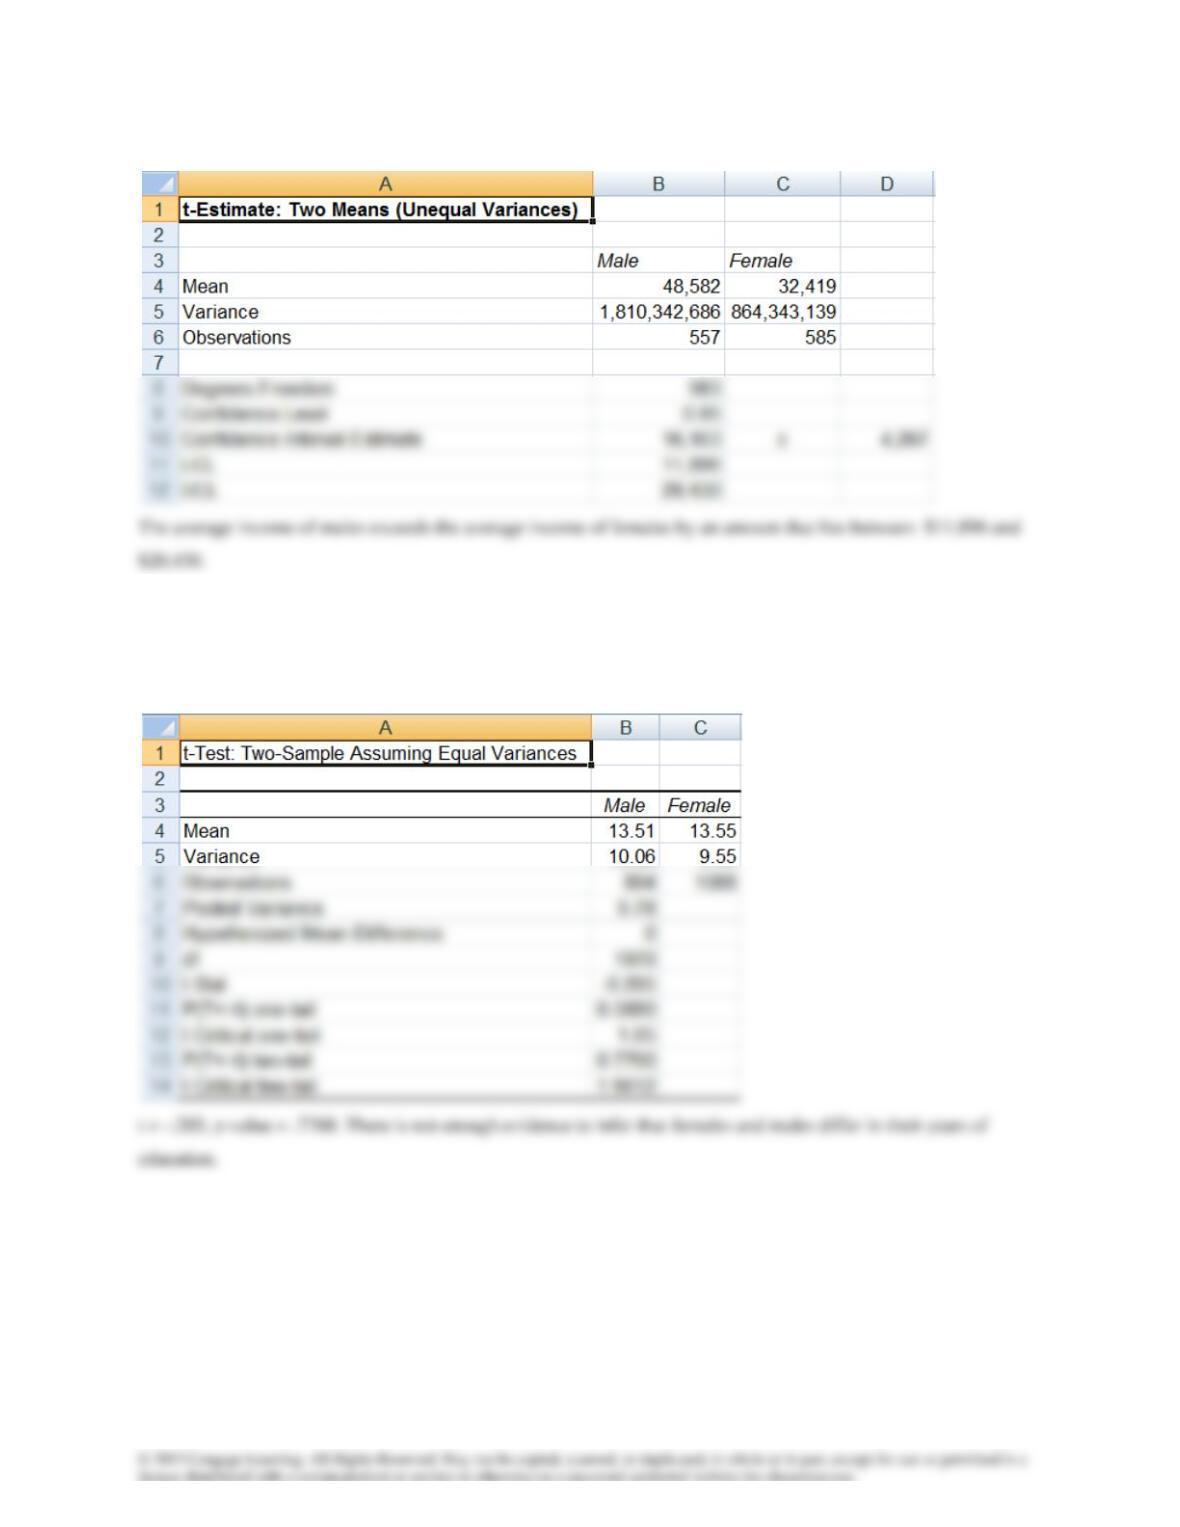
13.42 Two-tail F test: F = 2.09, p-value = 0; use unequal-variances estimator
13.43 H0: (μ1– μ2) = 0
H1: (μ1– μ2) ≠ 0
Two-tail F test: F = 1.05, p-value = .4140; use equal-variances test statistic
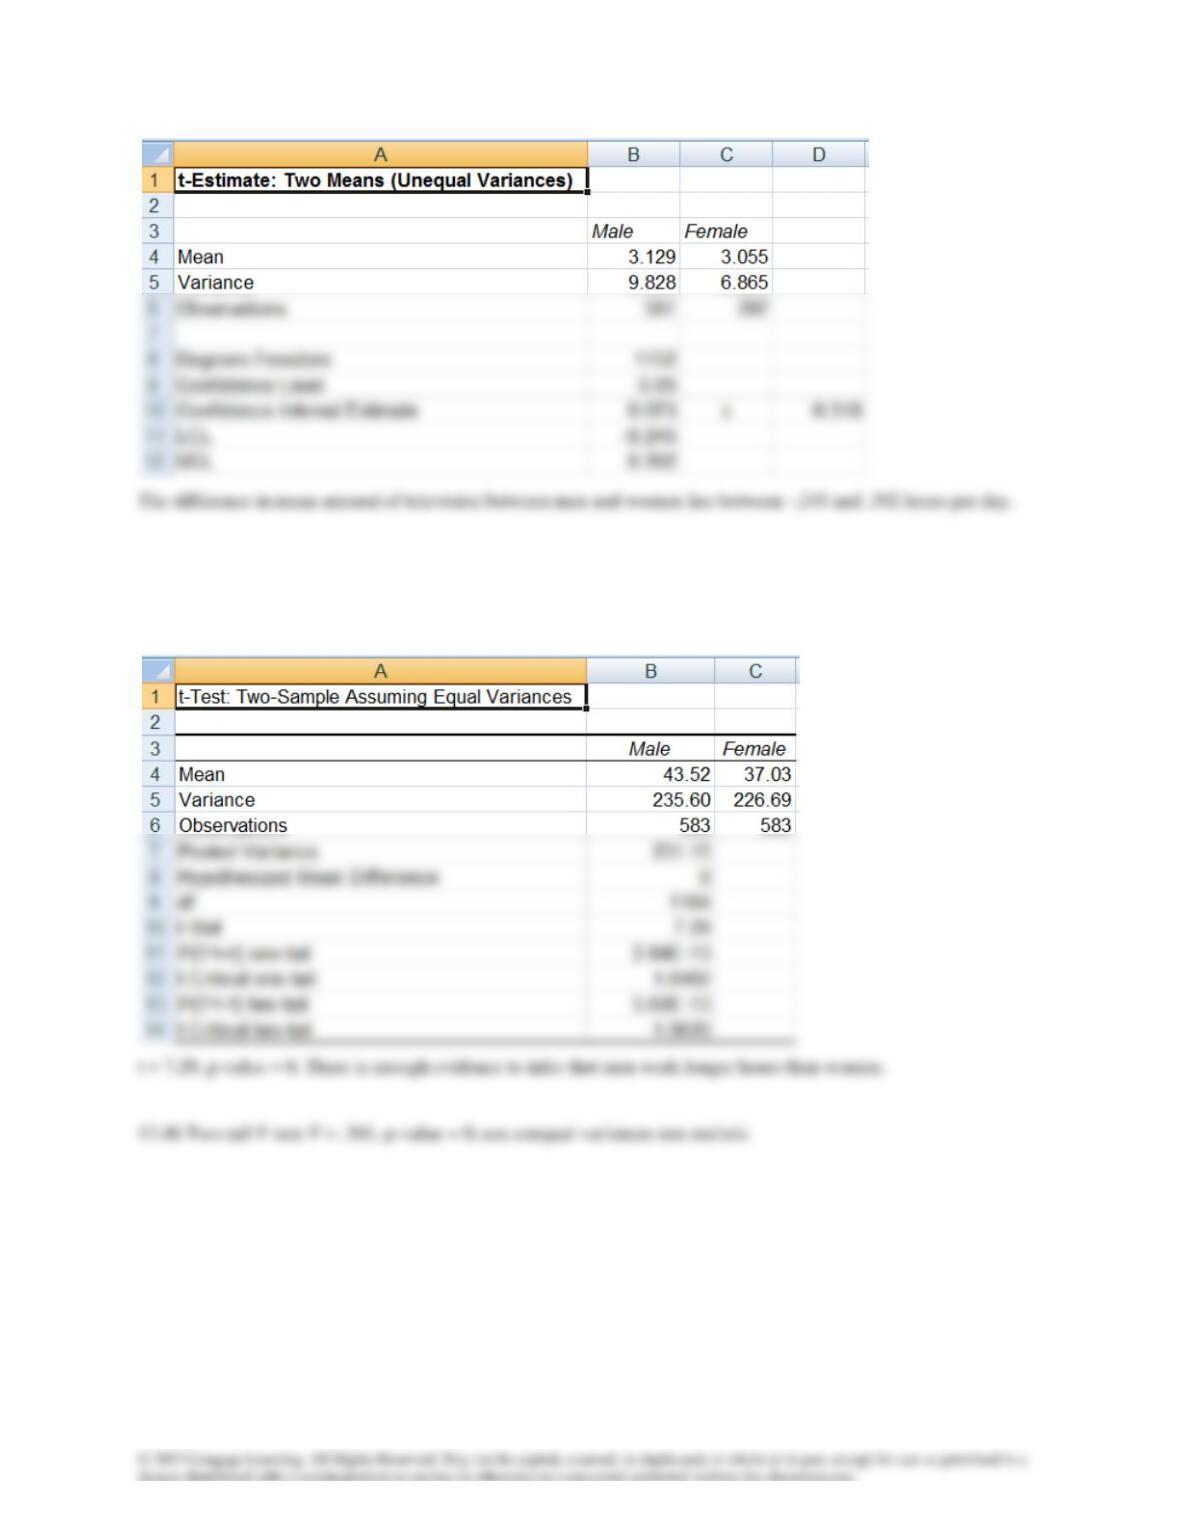
13.44 Two-tail F test: F = 1.43, p-value = 0; use unequal-variances test statistic
13.45 H0: (μ1– μ2) = 0
H1: (μ1– μ2) > 0
Two-tail F test: F = 1.04, p-value = .6422; use equal-variances test statistic
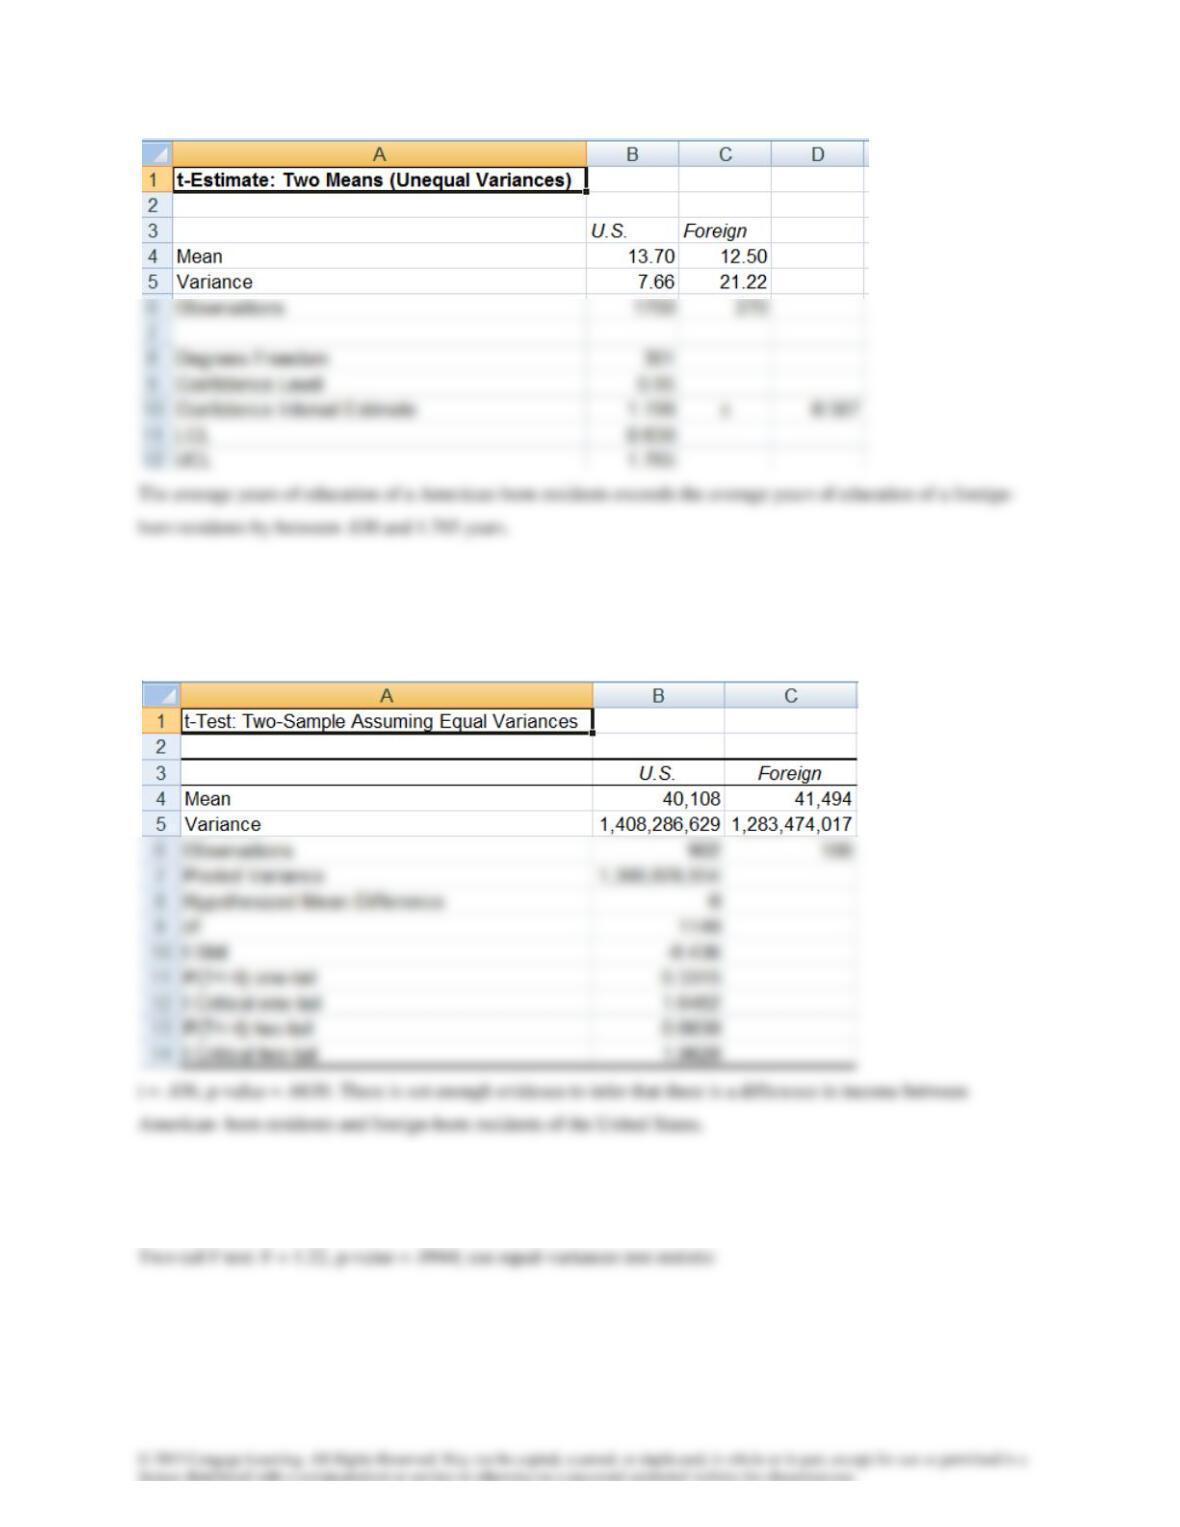
13.47 H0: (μ1– μ2) = 0
H1: (μ1– μ2) > 0
Two-tail F test: F = 1.10, p-value = .4656; use equal-variances test statistic
13.48 H0: (μ1– μ2) = 0
H1: (μ1– μ2) > 0
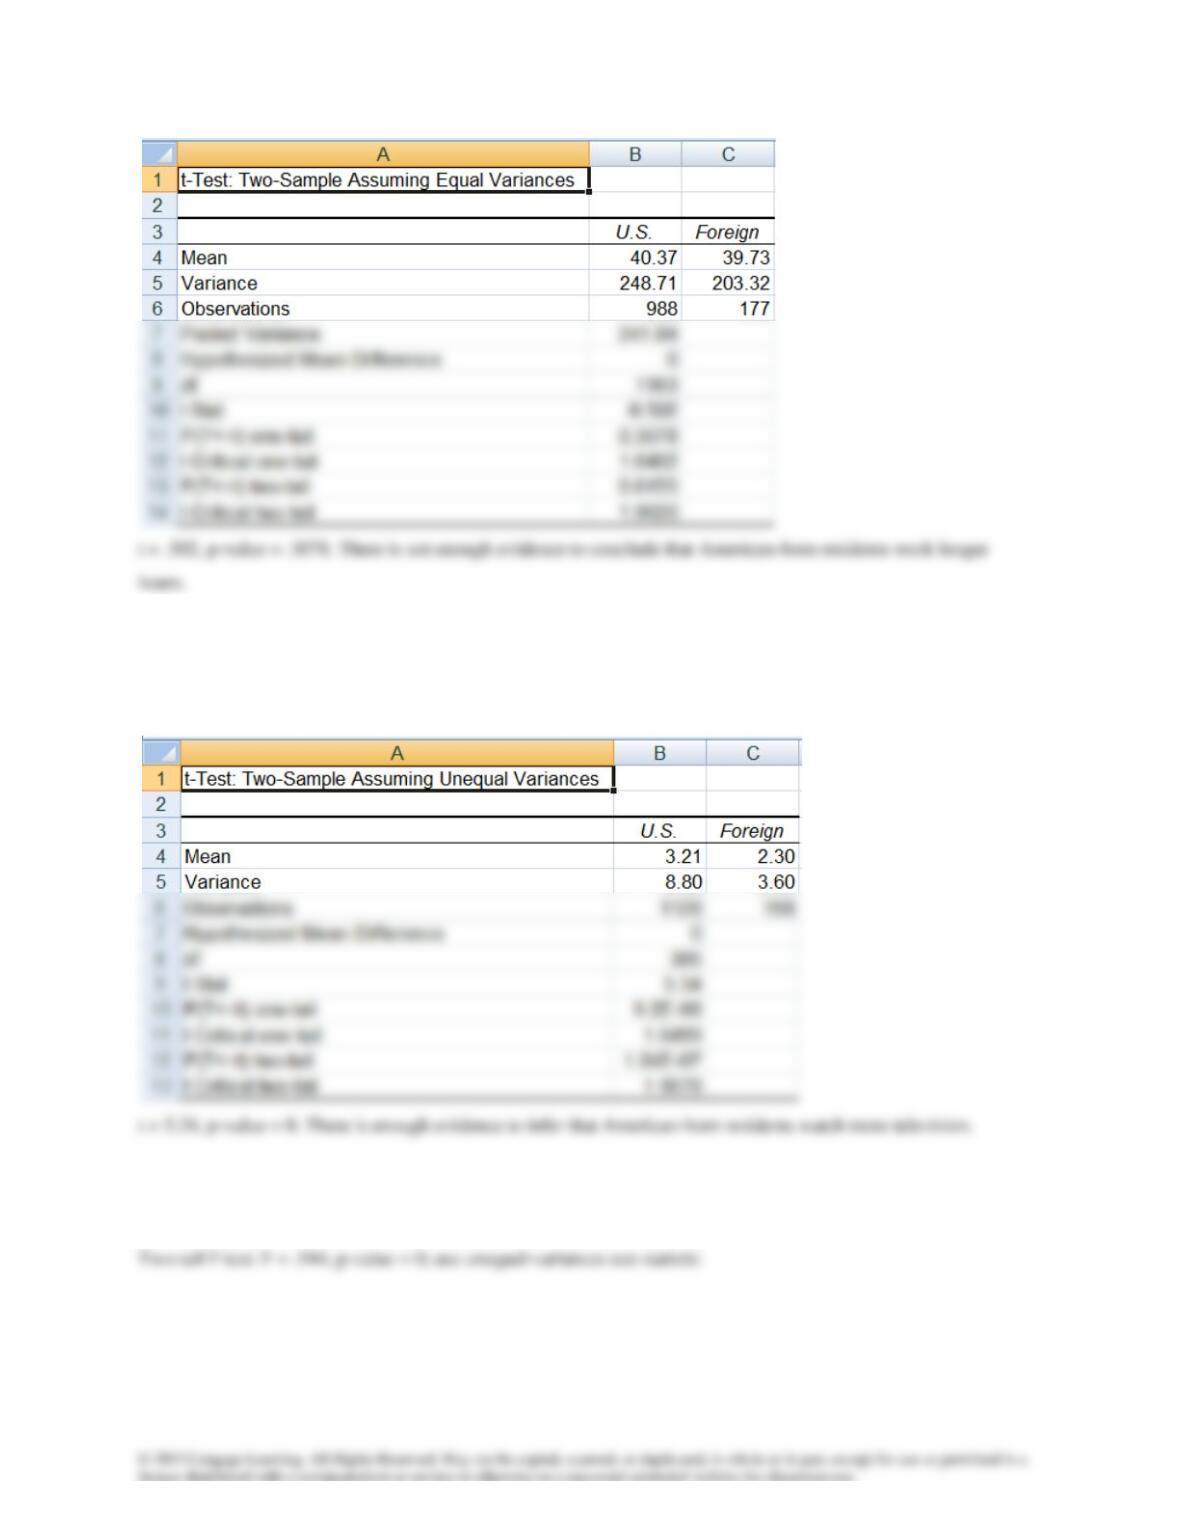
13.49 H0: (μ1– μ2) = 0
H1: (μ1– μ2) > 0
Two-tail F test: F = 2.44, p-value = 0; use unequal-variances test statistic
13.50 H0: (μ1– μ2) = 0
H1: (μ1– μ2) < 0
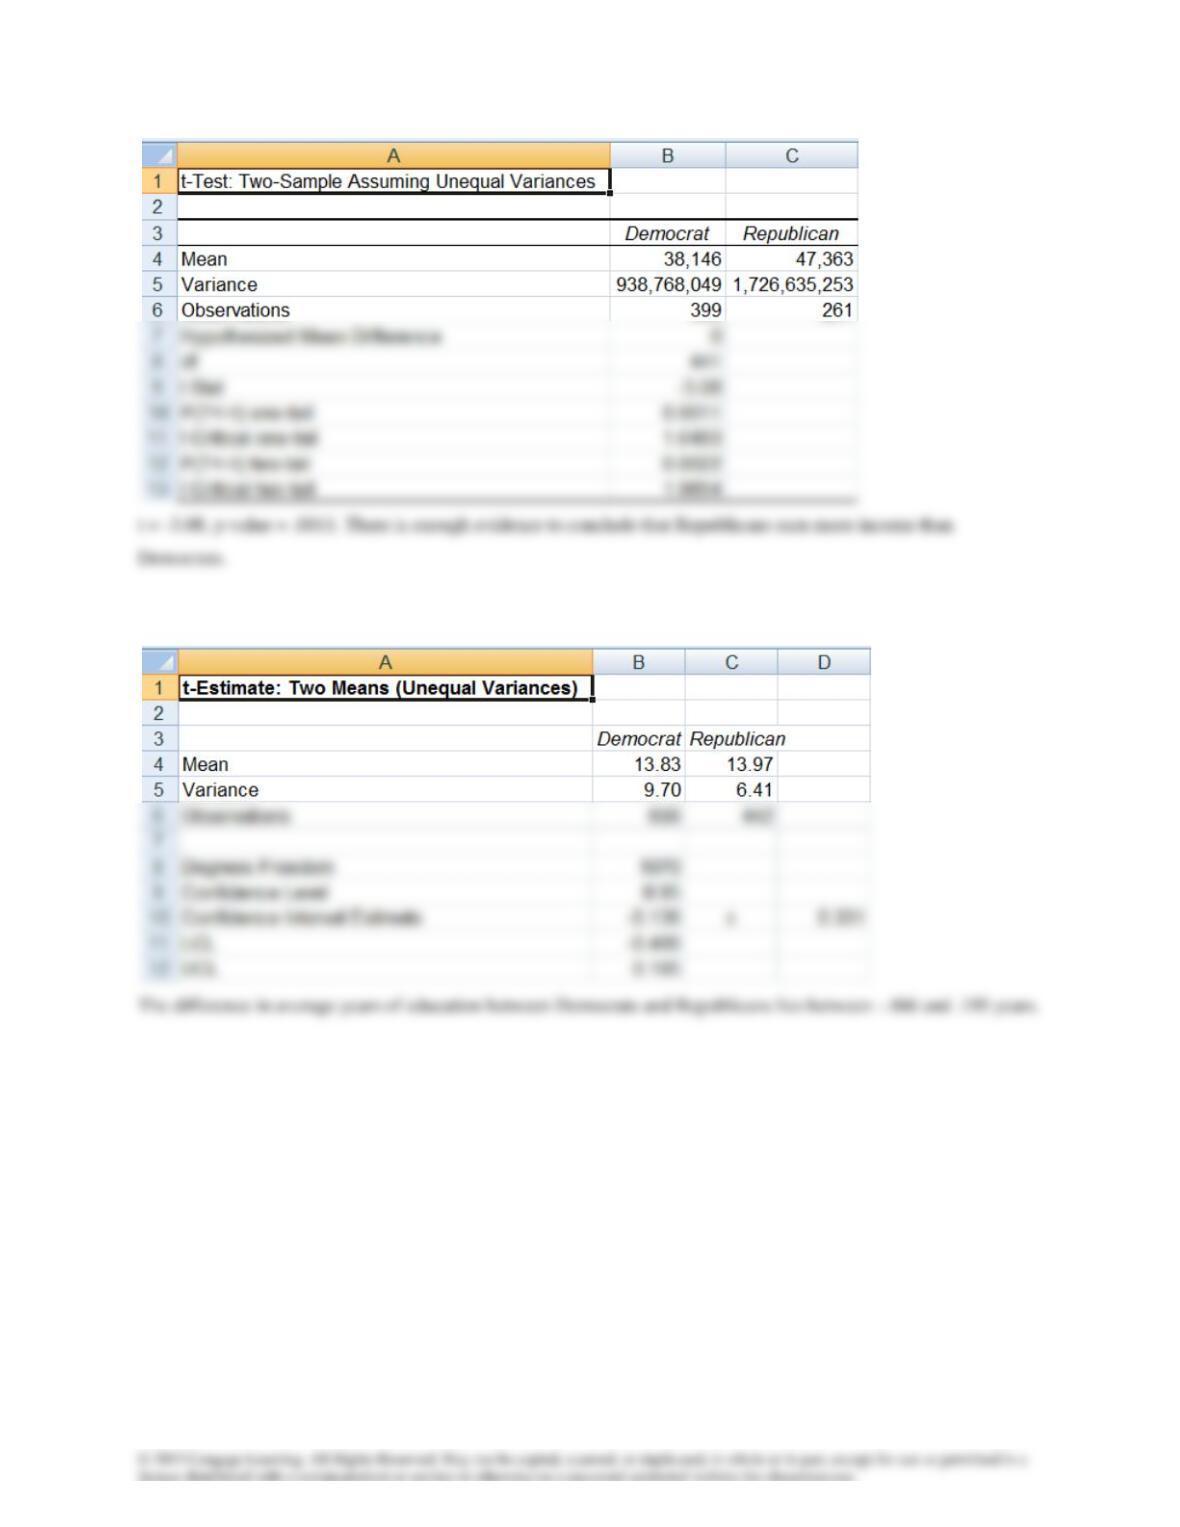
13.51 Two-tail F test: F = 1.51, p-value = 0; use unequal-variances estimator
13.52 Two-tail F test: F = 1.46, p-value = .0005; use unequal-variances estimator
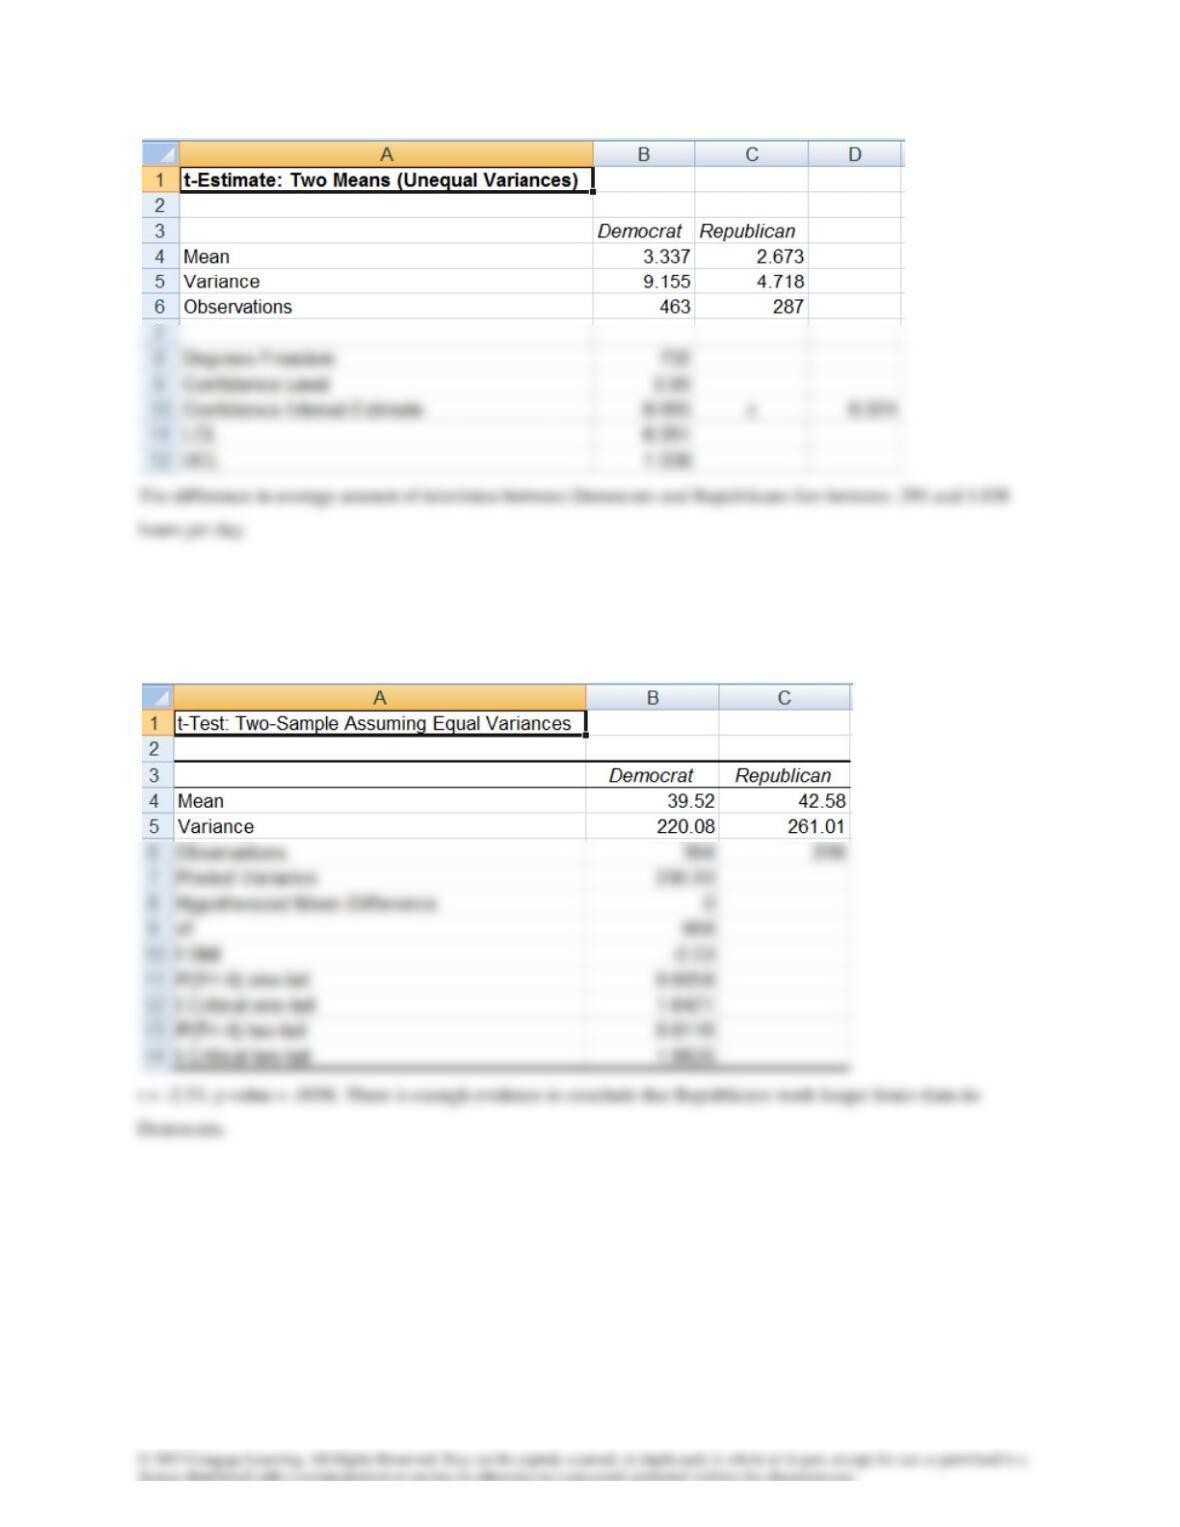
13.53 H0: (μ1– μ2) = 0
H1: (μ1– μ2) < 0
Two-tail F test: F =.843, p-value = .1220; use equal-variances test statistic
13.54 Two-tail F test: F =.674, p-value = .0002; use unequal-variances estimator