CHAPTER 10: INTRODUCTION TO ESTIMATION
TRUE/FALSE
1. An unbiased estimator is said to be consistent if the difference between the estimator and the
parameter grows smaller as the sample size grows larger.
2. An unbiased estimator is a sample statistic whose expected value equals the population parameter.
3. An unbiased estimator is said to be consistent if the difference between the estimator and the
parameter grows larger as the sample size grows larger.
4. If there are two unbiased estimators of a parameter, the one whose variance is smaller is said to be
relatively efficient.
5. An interval estimate is a range of values within which the actual value of the population parameter,
such as
, may fall.
6. An interval estimate is an estimate of the range for a sample statistic.
7. The sample variance (where you divide by n − 1) is an unbiased estimator of the population variance.
8. Knowing that an estimator is unbiased only assures us that its expected value equals the parameter, but
it does not tell us how close the estimator is to the parameter.
9. The sample mean is a consistent estimator of the population mean
.
10. The sample proportion is a consistent estimator of the population proportion p because it is unbiased
and the variance of is p(1 − p) / n, which grows smaller as n grows larger.
11. The sample variance s2 is an unbiased estimator of the population variance
2 when the denominator of
s2 is n.
12. An unbiased estimator has an average value (across all samples) equal to the population parameter.
13. The sample variance is a point estimate of the population variance.
14. The confidence interval estimate of the population mean is constructed around the sample mean.
15. A point estimate consists of a single sample statistic that is used to estimate the true population
parameter.
16. A specific confidence interval obtained from data will always correctly estimate the population
parameter.
MULTIPLE CHOICE
1. An estimator is said to be consistent if:
a.
the difference between the estimator and the population parameter grows smaller as the
sample size grows larger.
b.
it is an unbiased estimator.
c.
the variance of the estimator is zero.
d.
the difference between the estimator and the population parameter stays the same as the
sample size grows larger.
2. A point estimator is defined as:
a.
a range of values that estimates an unknown population parameter.
b.
a single value that estimates an unknown population parameter.
c.
a range of values that estimates an unknown sample statistic.
d.
a single value that estimates an unknown sample statistic.
3. Which of the following is a characteristic for a good estimator?
a.
Being unbiased
c.
Having relative efficiency
b.
Being consistent
d.
All of these choices are true.
4. An unbiased estimator of a population parameter is defined as:
a.
an estimator whose expected value is equal to the parameter.
b.
an estimator whose variance is equal to one.
c.
an estimator whose expected value is equal to zero.
d.
an estimator whose variance goes to zero as the sample size goes to infinity.
5. Which of the following statements is true?
a.
The sample mean is relatively more efficient than the sample median.
b.
The version of the sample variance where you divide by n is biased.
c.
The sample mean is consistent.
d.
All of these choices are true.
6. Which of the following statements is correct?
a.
The sample mean is an unbiased estimator of the population mean.
b.
The sample proportion is an unbiased estimator of the population proportion.
c.
The difference between two sample means is an unbiased estimator of the difference
between two population means.
d.
All of these choices are true.
7. If there are two unbiased estimators of a population parameter available, the one that has the smallest
variance is said to be:
a.
a biased estimator.
c.
consistent.
b.
relatively efficient.
d.
relatively unbiased.
8. The problem with relying on a point estimate of a population parameter is that:
a.
it is virtually certain to be wrong.
b.
it doesn’t have the capacity to reflect the effects of larger sample sizes.
c.
it doesn’t tell us how close or far the point estimate might be from the parameter.
d.
All of these choices are true.
9. The sample variance s2 is an unbiased estimator of the population variance
s2 is
a.
n + 1
c.
n − 1
b.
n
d.
10. The librarian at the New York City Public Library has asked her assistant for an interval estimate of
the mean number of books checked out each day. The assistant took a sample and found the mean to
be 880 books. She provides the librarian with an interval estimate of between 790 and 970 books
checked out per day. An efficient, unbiased point estimate of the number of books checked out each
day at the New York City Public Library is:
a.
790
c.
90
b.
880
d.
None of these choices.
COMPLETION
1. It is intuitively reasonable to expect that a larger sample will produce more ____________________
results.
2. ____________________ estimators do not have the capacity to reflect the effects of larger sample
sizes.
3. ____________________ estimators reflect the effects of larger sample sizes, but
____________________ estimators do not.
4. An interval estimator estimates the value of an unknown ____________________.
5. A(n) ____________________ estimator of a population parameter is an estimator whose expected
value is equal to that parameter.
6. The sample ____________________ is an unbiased estimator for the population mean.
7. The version of the sample variance where you divide by ____________________ gives you an
unbiased estimator of the population variance.
8. An unbiased estimator is ____________________ if its variance gets smaller as n gets larger.
9. If there are two unbiased estimators of the same parameter, the one whose variance is smaller is said to
be relatively more ____________________.
10. The sample ____________________ is relatively more efficient than the sample
____________________ when estimating the population mean.
SHORT ANSWER
1. Define unbiasedness.
2. Define consistency.
3. Is the sample mean a consistent estimator of the population mean? Explain
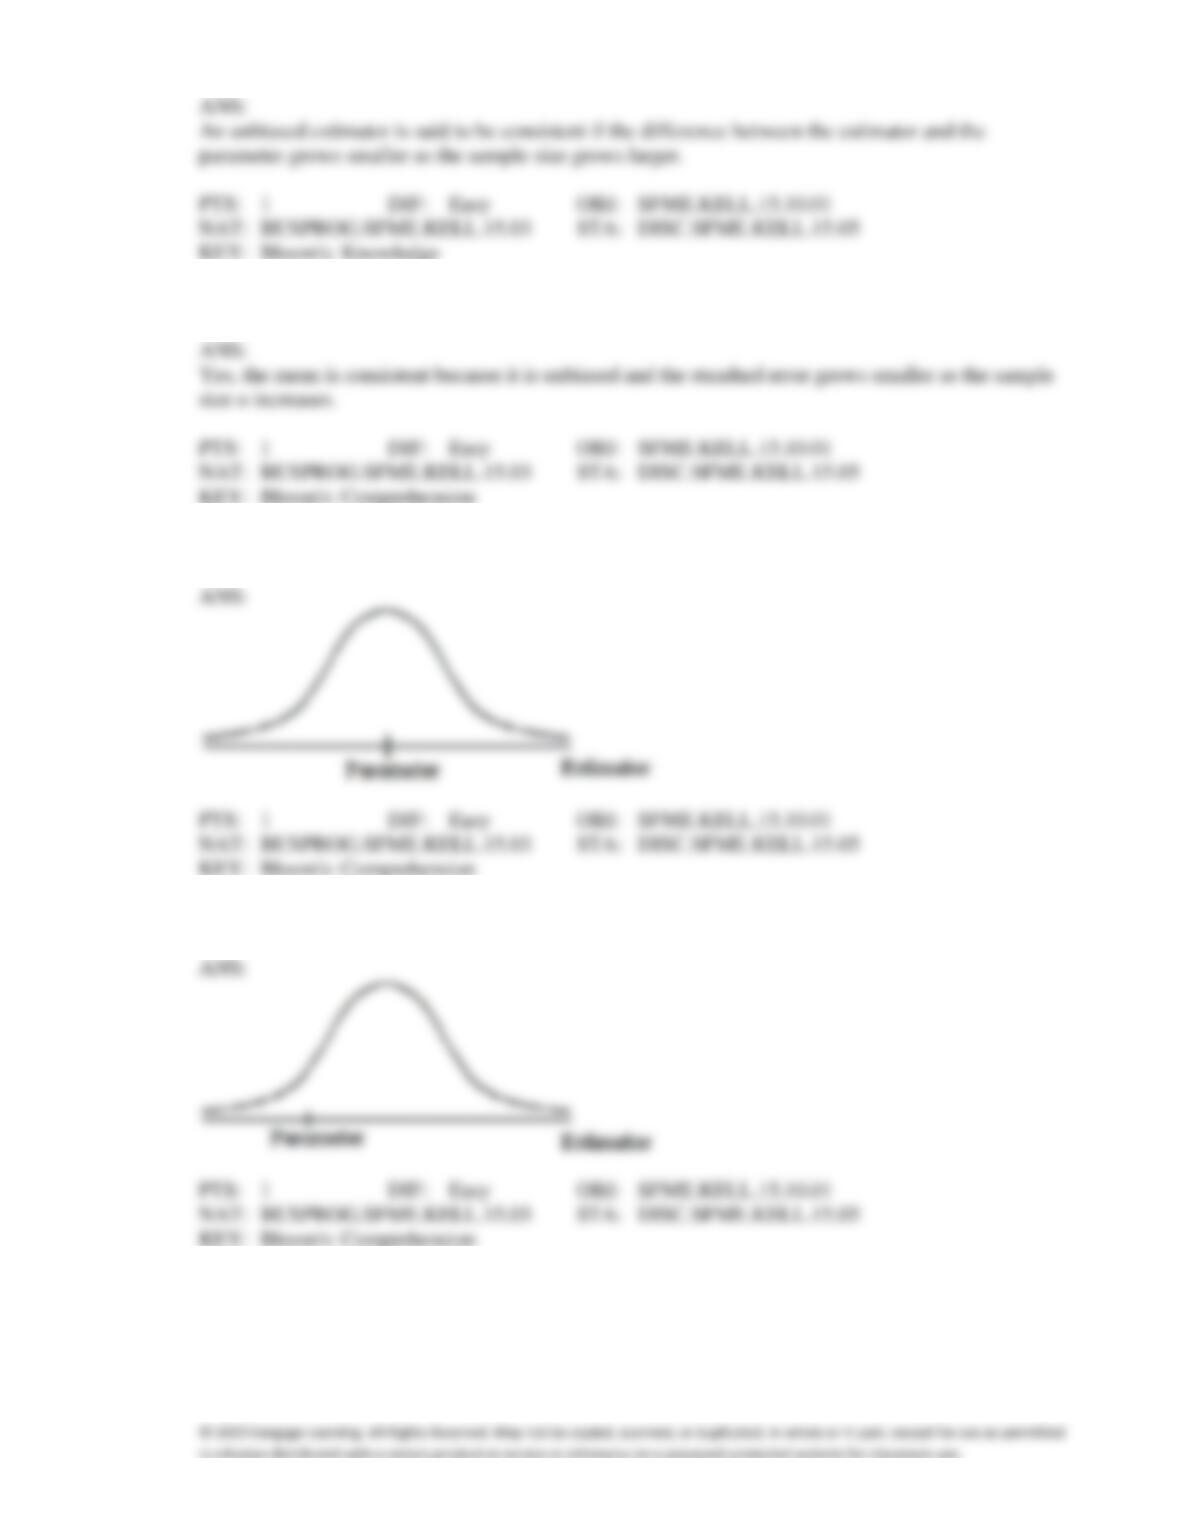
4. Draw a sampling distribution of an unbiased estimator for
.
5. Draw a sampling distribution of a biased estimator for
.
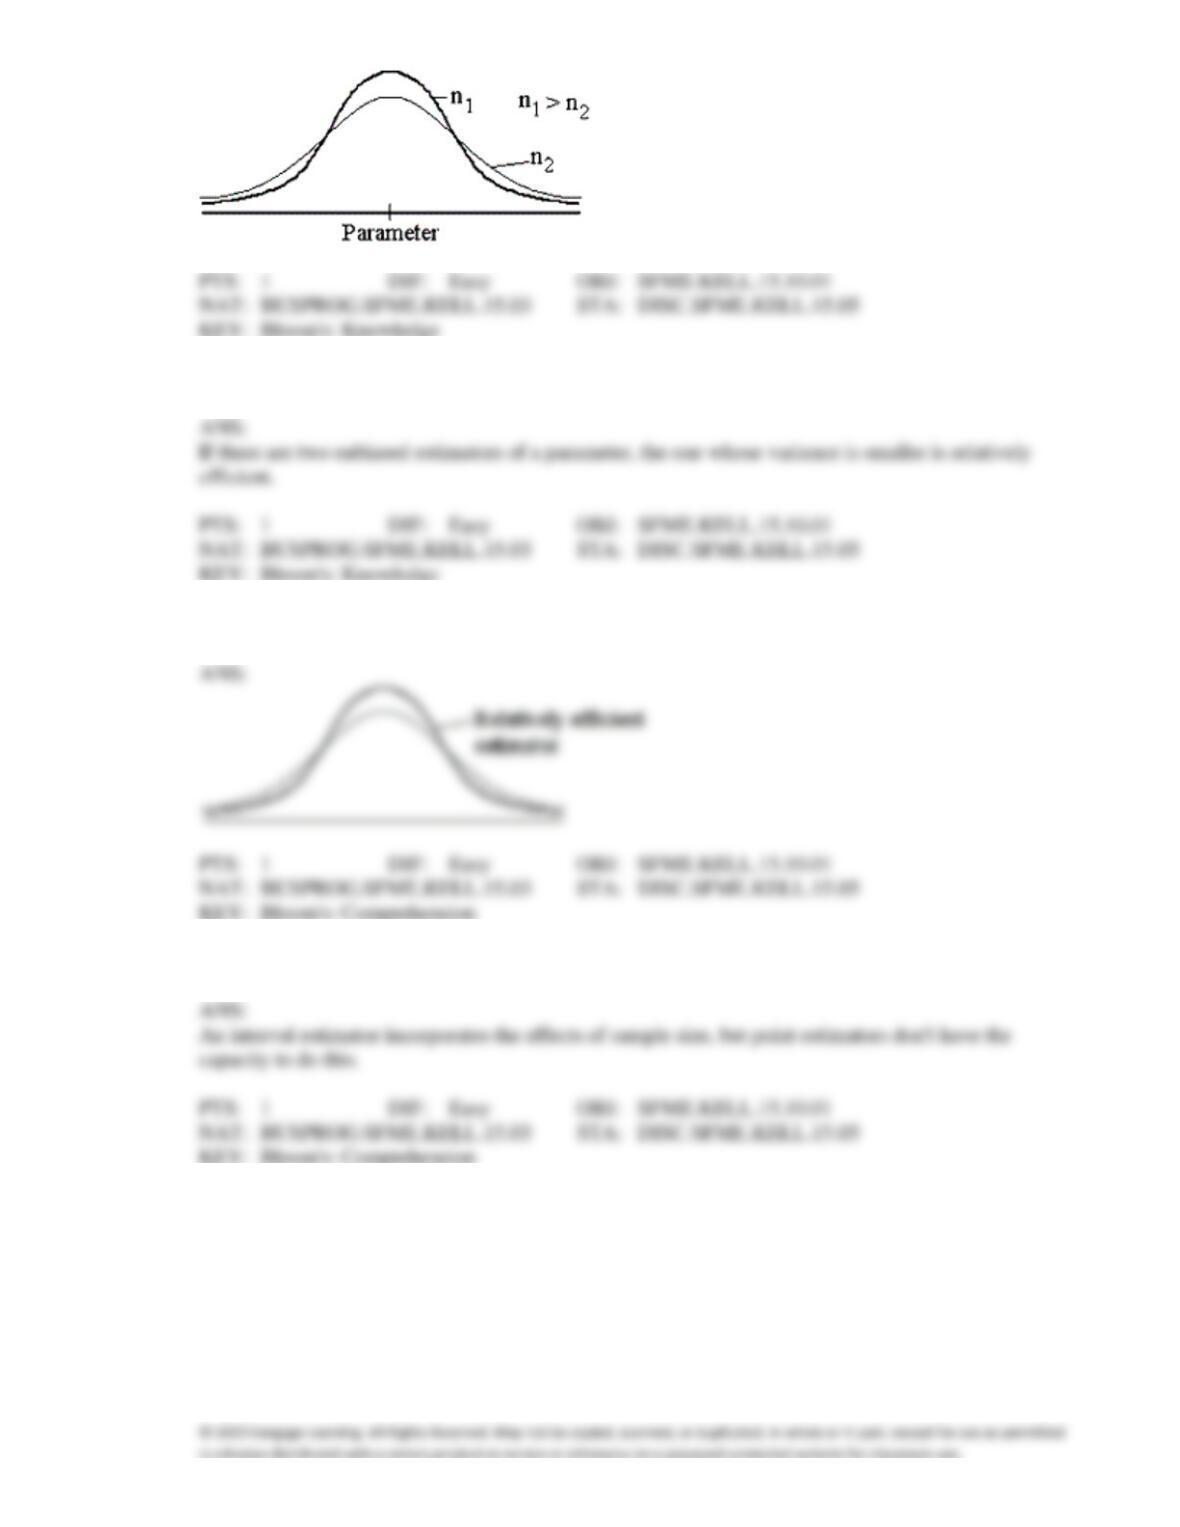
6. Draw sampling distributions of a consistent estimator for
where one sample mean is larger than the
other.
ANS:
7. Define relative efficiency.
8. Draw the sampling distribution of two unbiased estimators for
, one of which is relatively efficient.
9. Explain briefly why interval estimators are preferred to point estimators.
10. A random sample of 10 university students was surveyed to help estimate the average amount of time
students spent per week on their computers. The student hours spent using a personal computer over a
randomly selected week were 13, 14, 5, 6, 8, 10, 7, 12, 15, 3.
a.
Find an unbiased estimator of the average time per week for all university students.
b.
Find an unbiased estimator of the variance.
c.
Find a consistent estimator of the average time per week for all university students.
11. In order to construct a confidence interval estimate of the population mean, the value of the population
mean is needed.
12. A confidence interval is an interval estimate for which there is a specified degree of certainty that the
actual value of the population parameter will fall within the interval.
13. The larger the confidence level used in constructing a confidence interval estimate of the population
mean, the narrower the confidence interval.
14. One can reduce the width of a confidence interval by taking a smaller sample size.
15. The width of a 95% confidence interval is 0.95.
ANS:
16. The term 1 −
refers to the probability that a confidence interval does not contain the population
parameter.
17. The difference between the sample statistic and actual value of the population parameter is the
confidence level of the estimate.
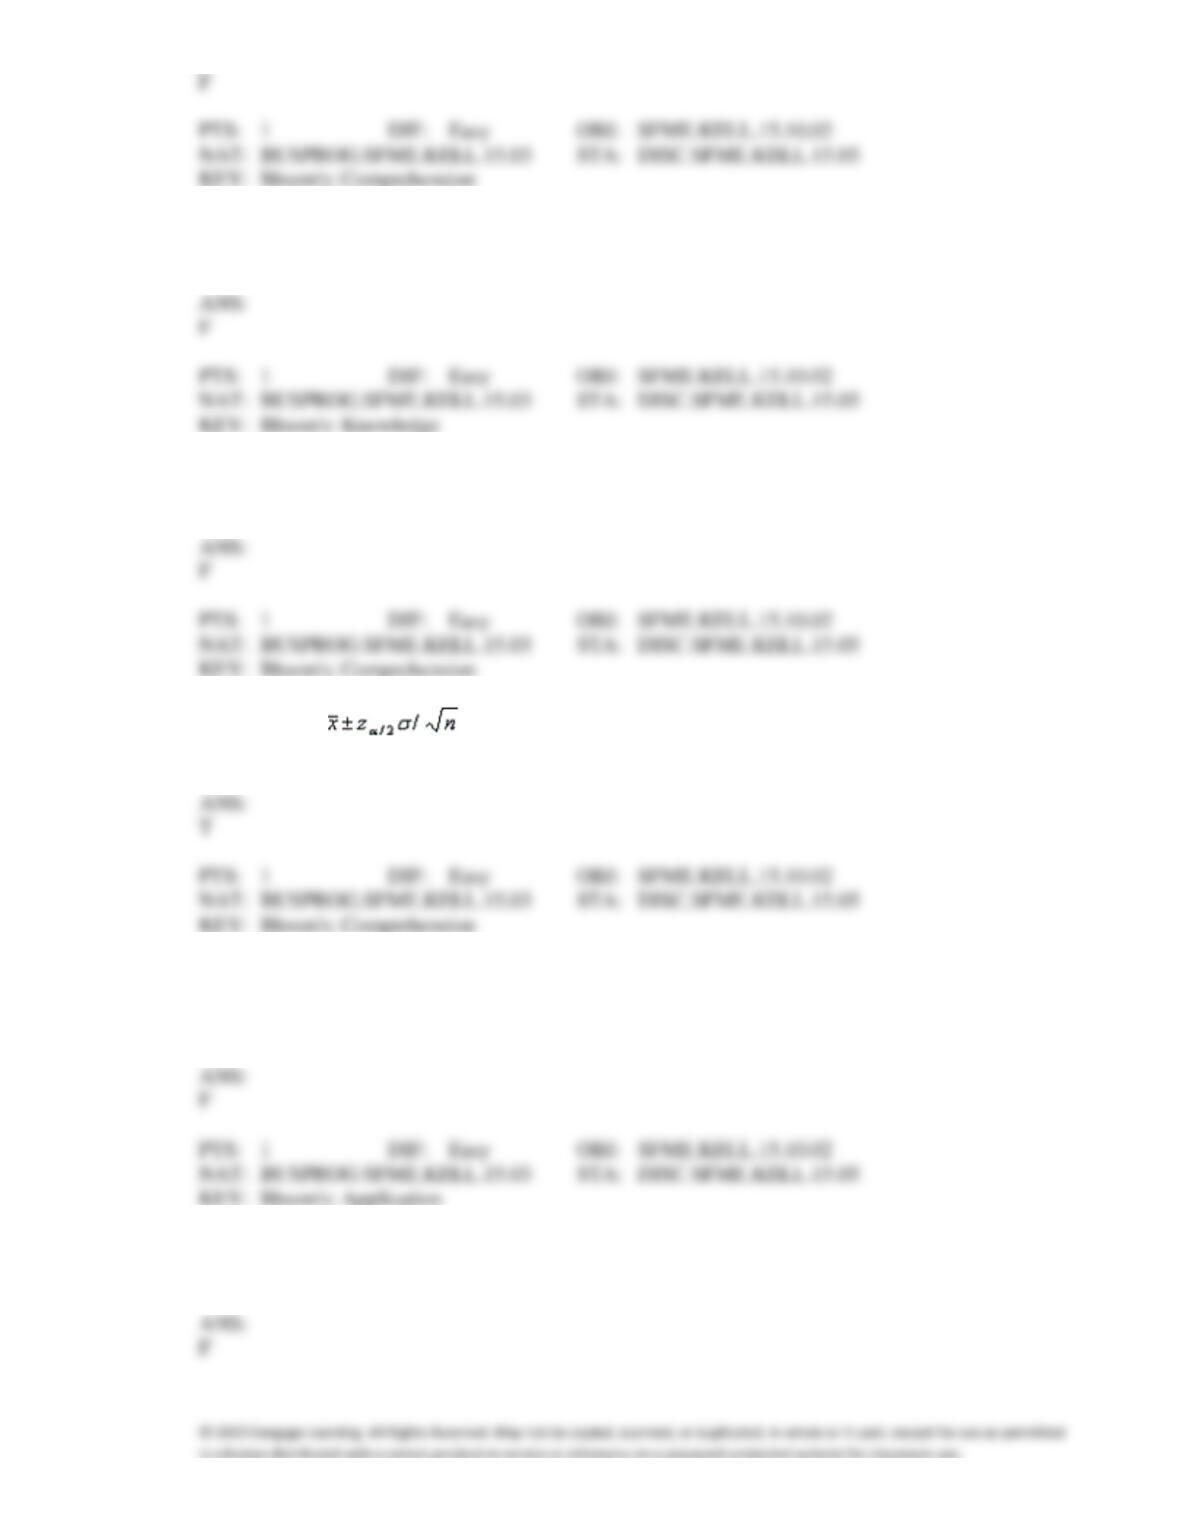
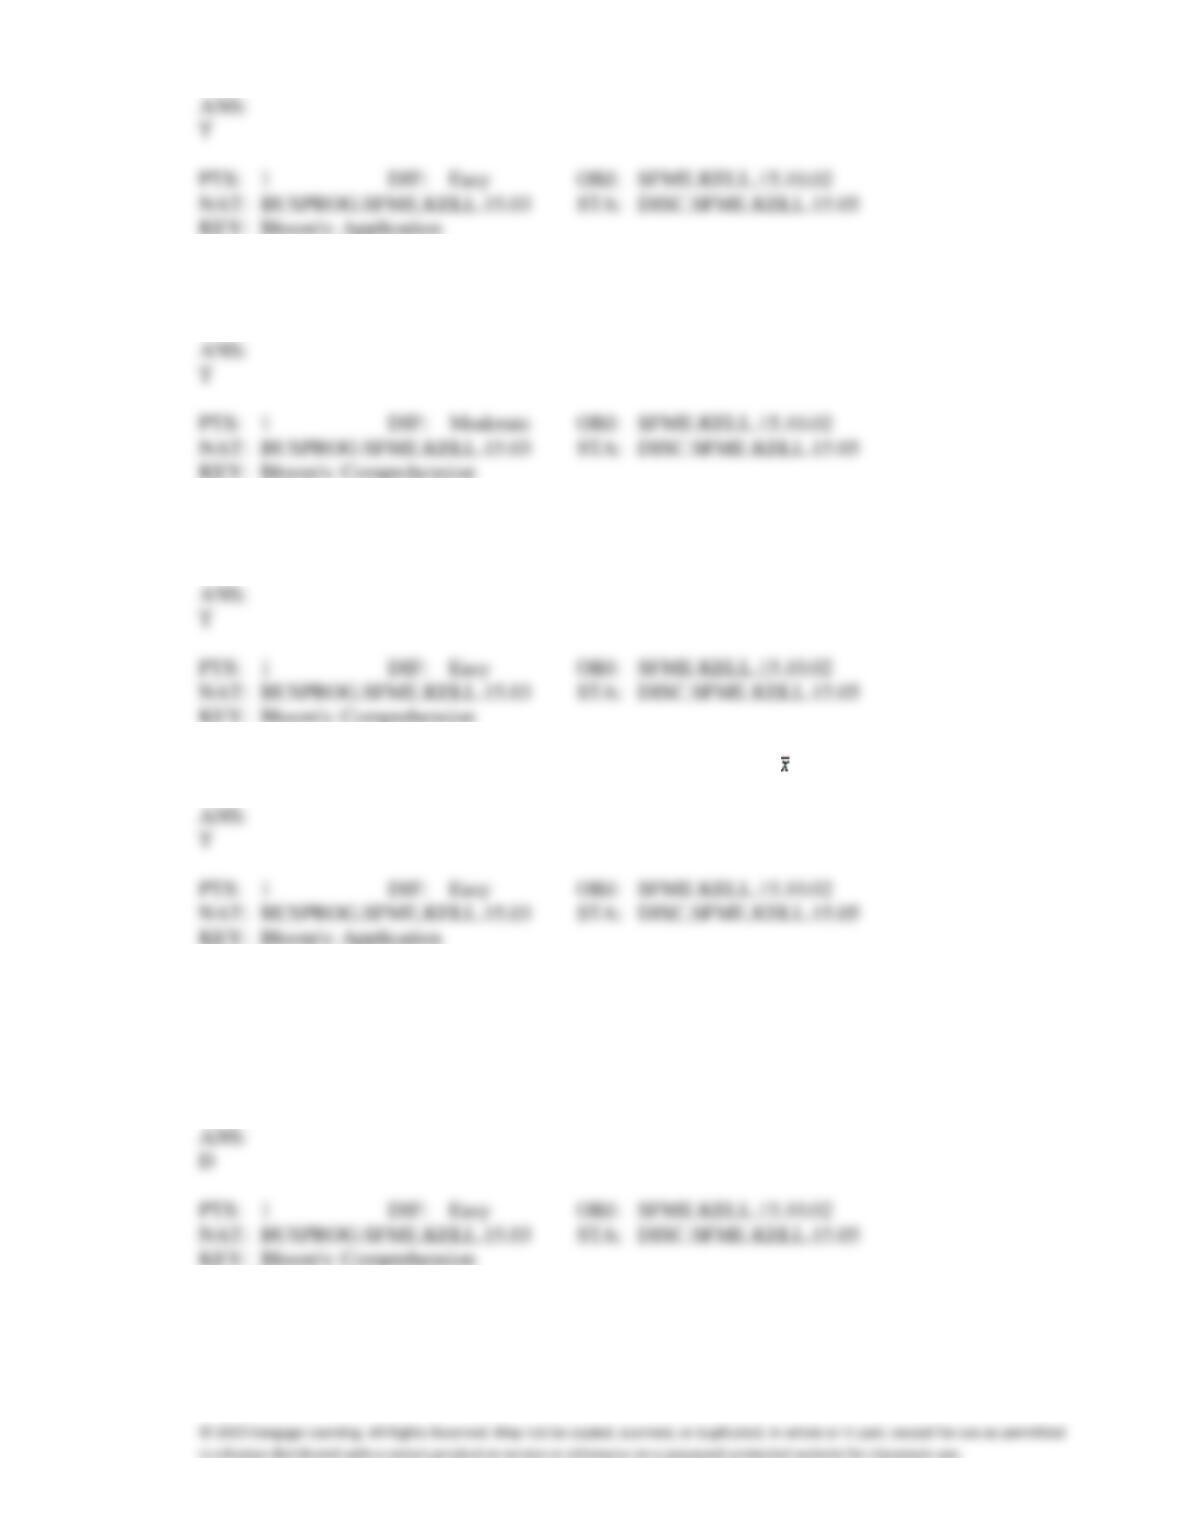
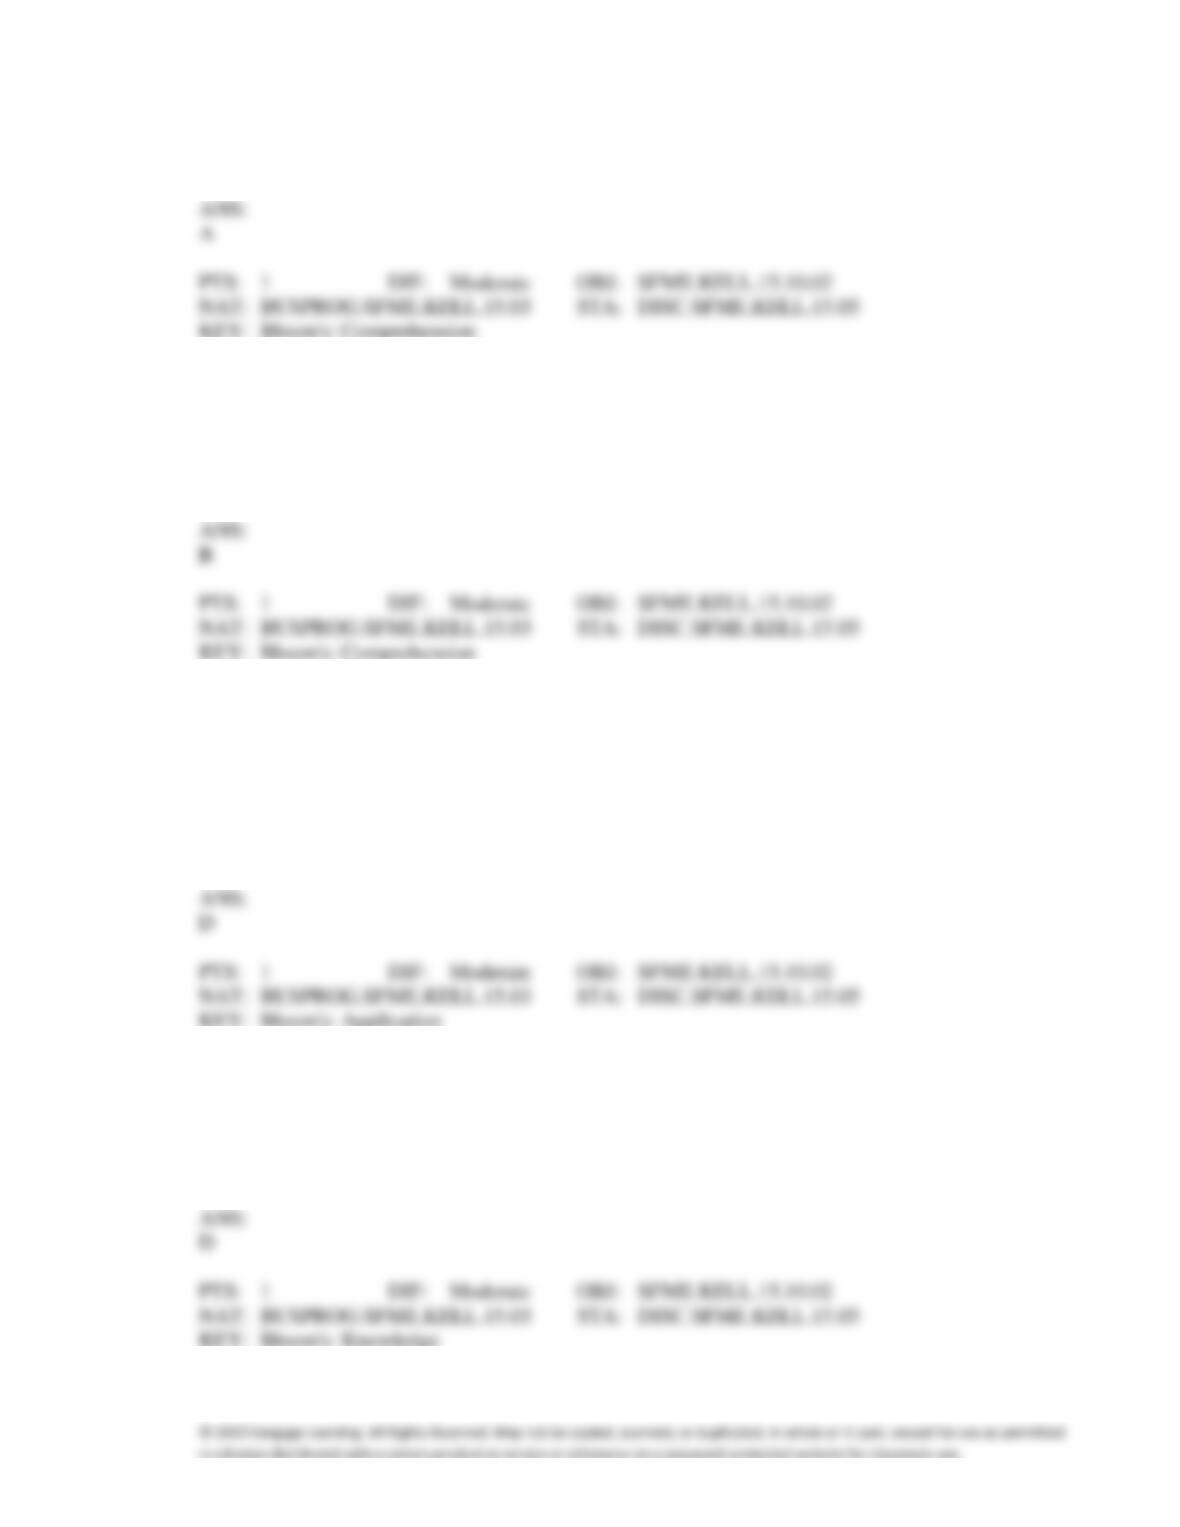
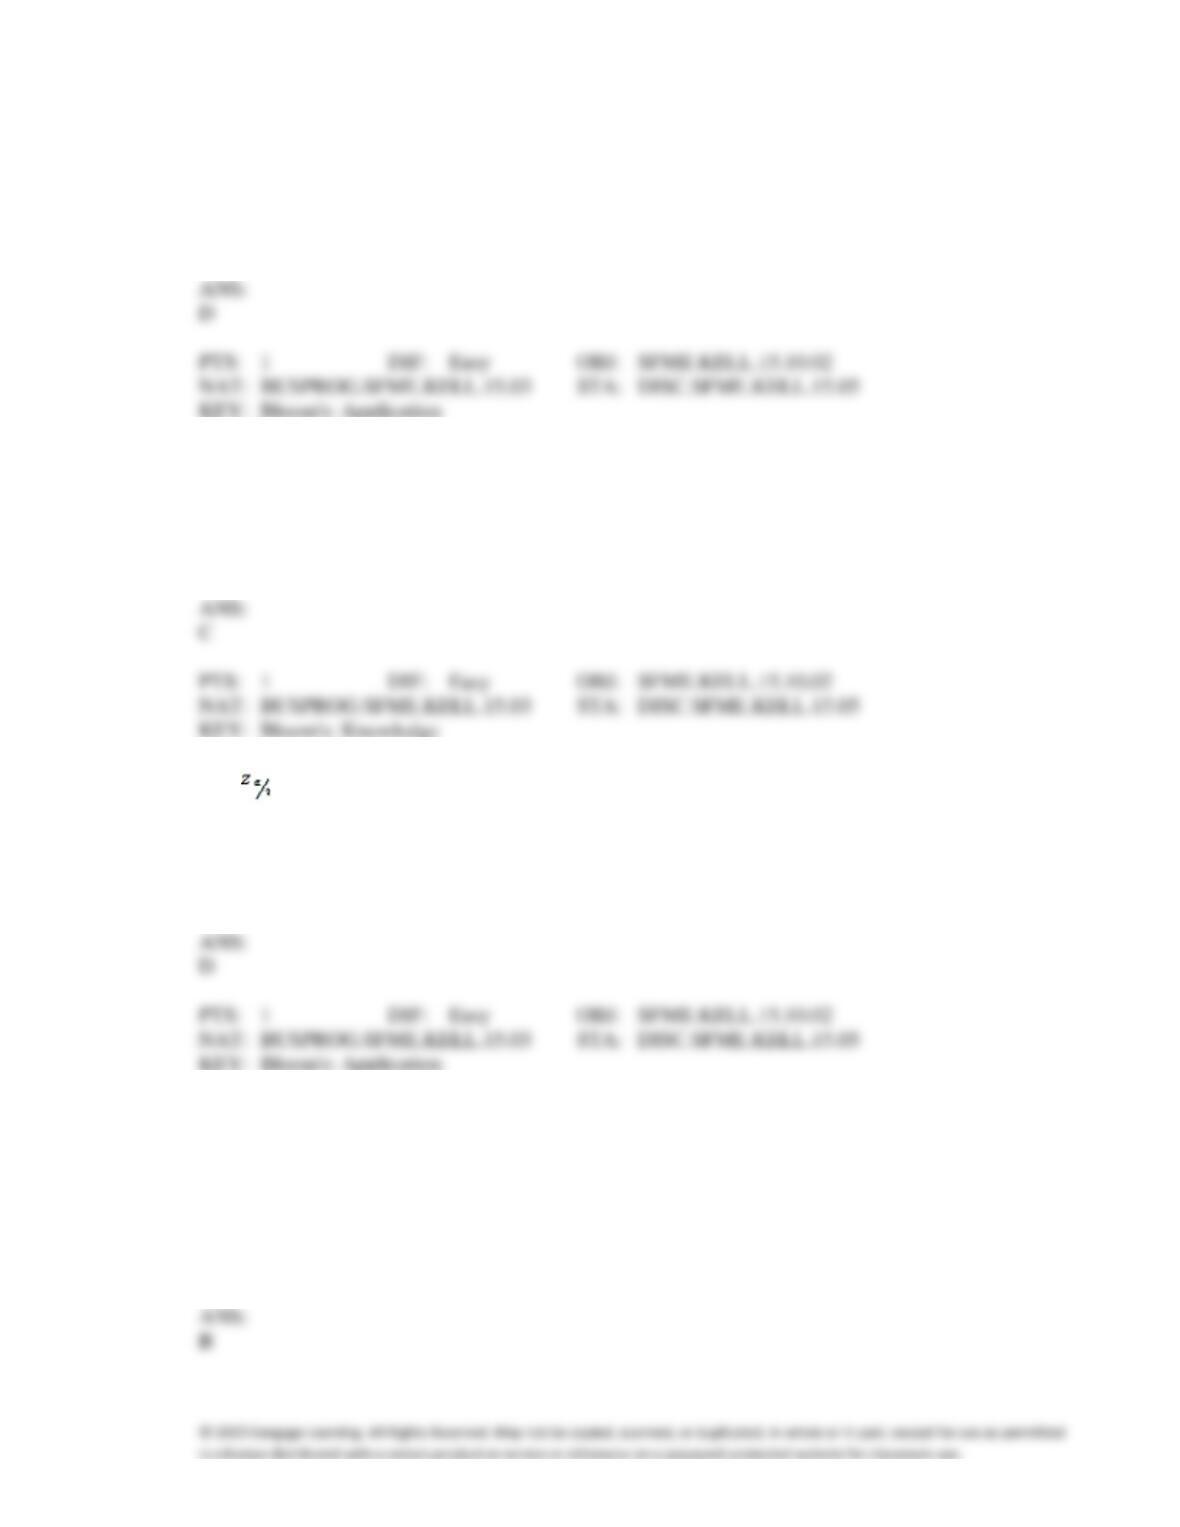
18. In the formula , the subscript
/ 2 refers to the area in the lower tail or upper tail of the
sampling distribution of the sample mean.
19. In developing an interval estimate for a population mean, the population standard deviation
was
assumed to be 8. The interval estimate was 50.0 2.50. Had
equaled 16, the interval estimate would
be 100 5.0.
20. A 95% confidence interval estimate for a population mean
is determined to be 75 to 85. If the
confidence level is reduced to 80%, the confidence interval for
becomes wider.
21. When constructing confidence interval for a parameter, we generally set the confidence level 1 −
close to 1 (usually between 0.90 and 0.99) because it is the probability that the interval includes the
actual value of the population parameter.
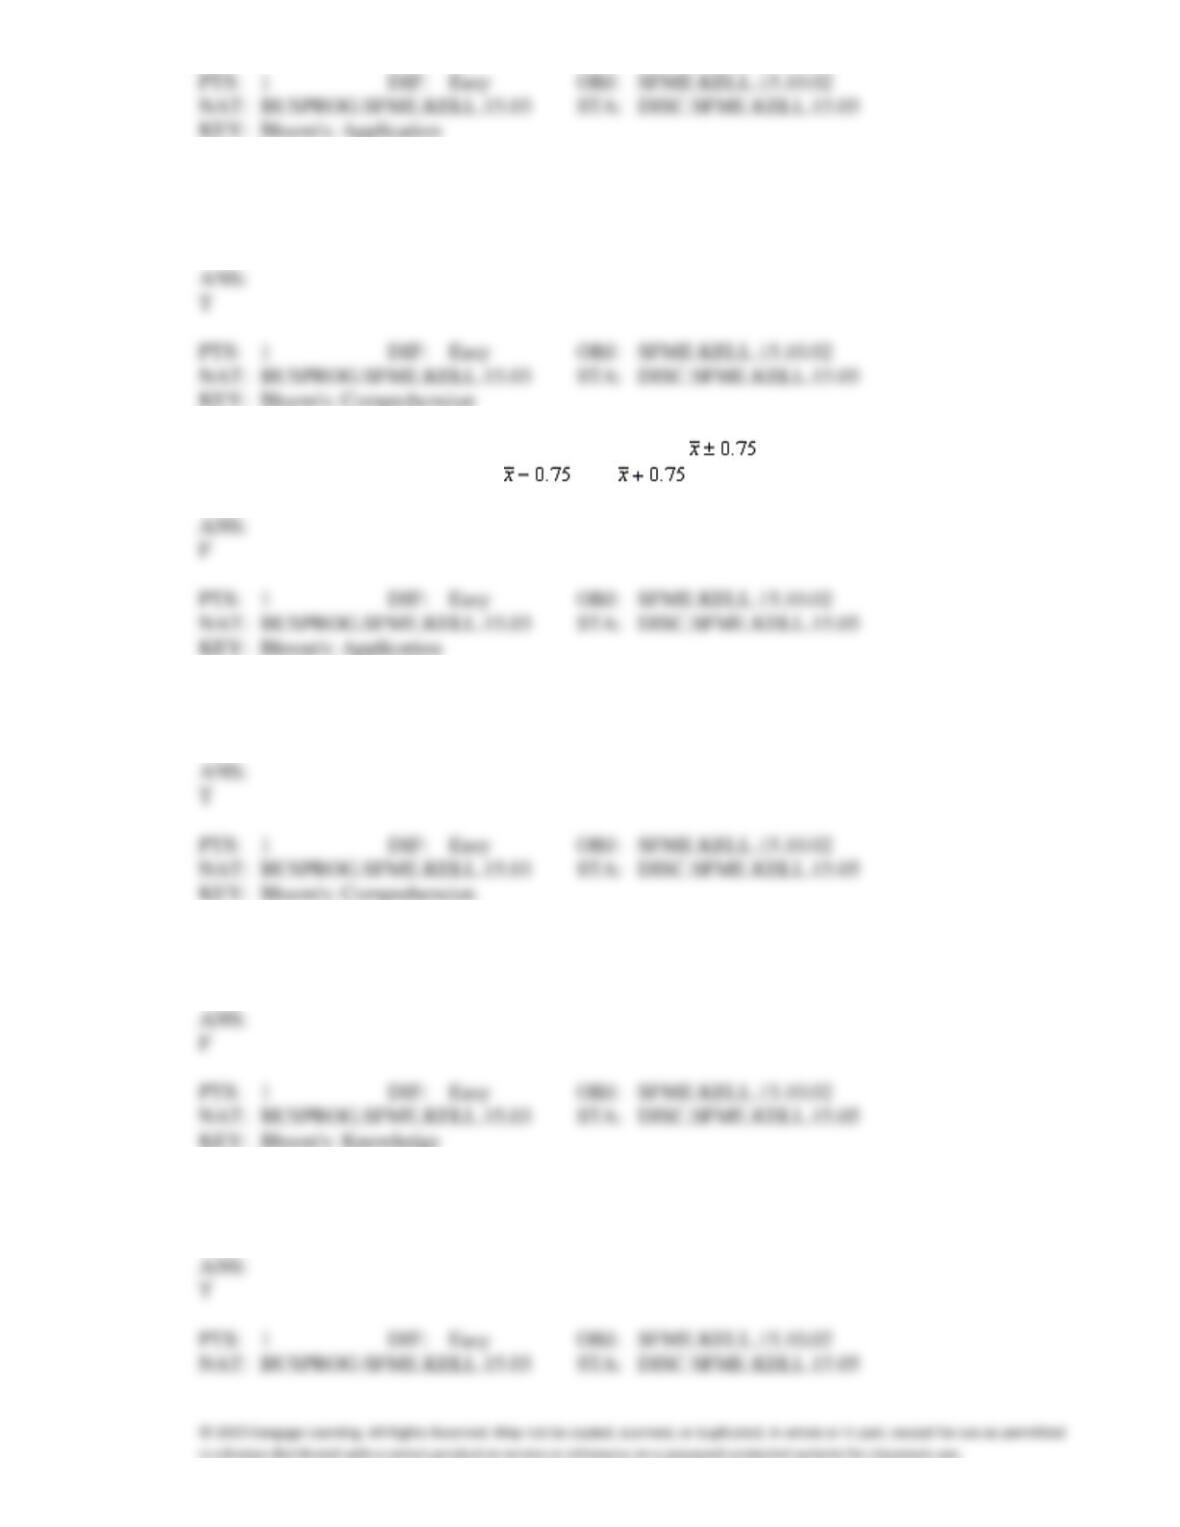
22. Suppose that a 90% confidence interval for
is given by . This notation means that we are
90% confident that
falls between and .
23. We cannot interpret the confidence interval estimate of
as a probability statement about
because
the population mean is a fixed quantity.
24. The width of the confidence interval estimate of the population mean
is a function of only two
quantities: the population standard deviation
and the sample size n.
25. Doubling the population standard deviation
has the effect of doubling the width of the confidence
interval estimate of
.
26. Increasing the value of 1 −
narrows a confidence interval.
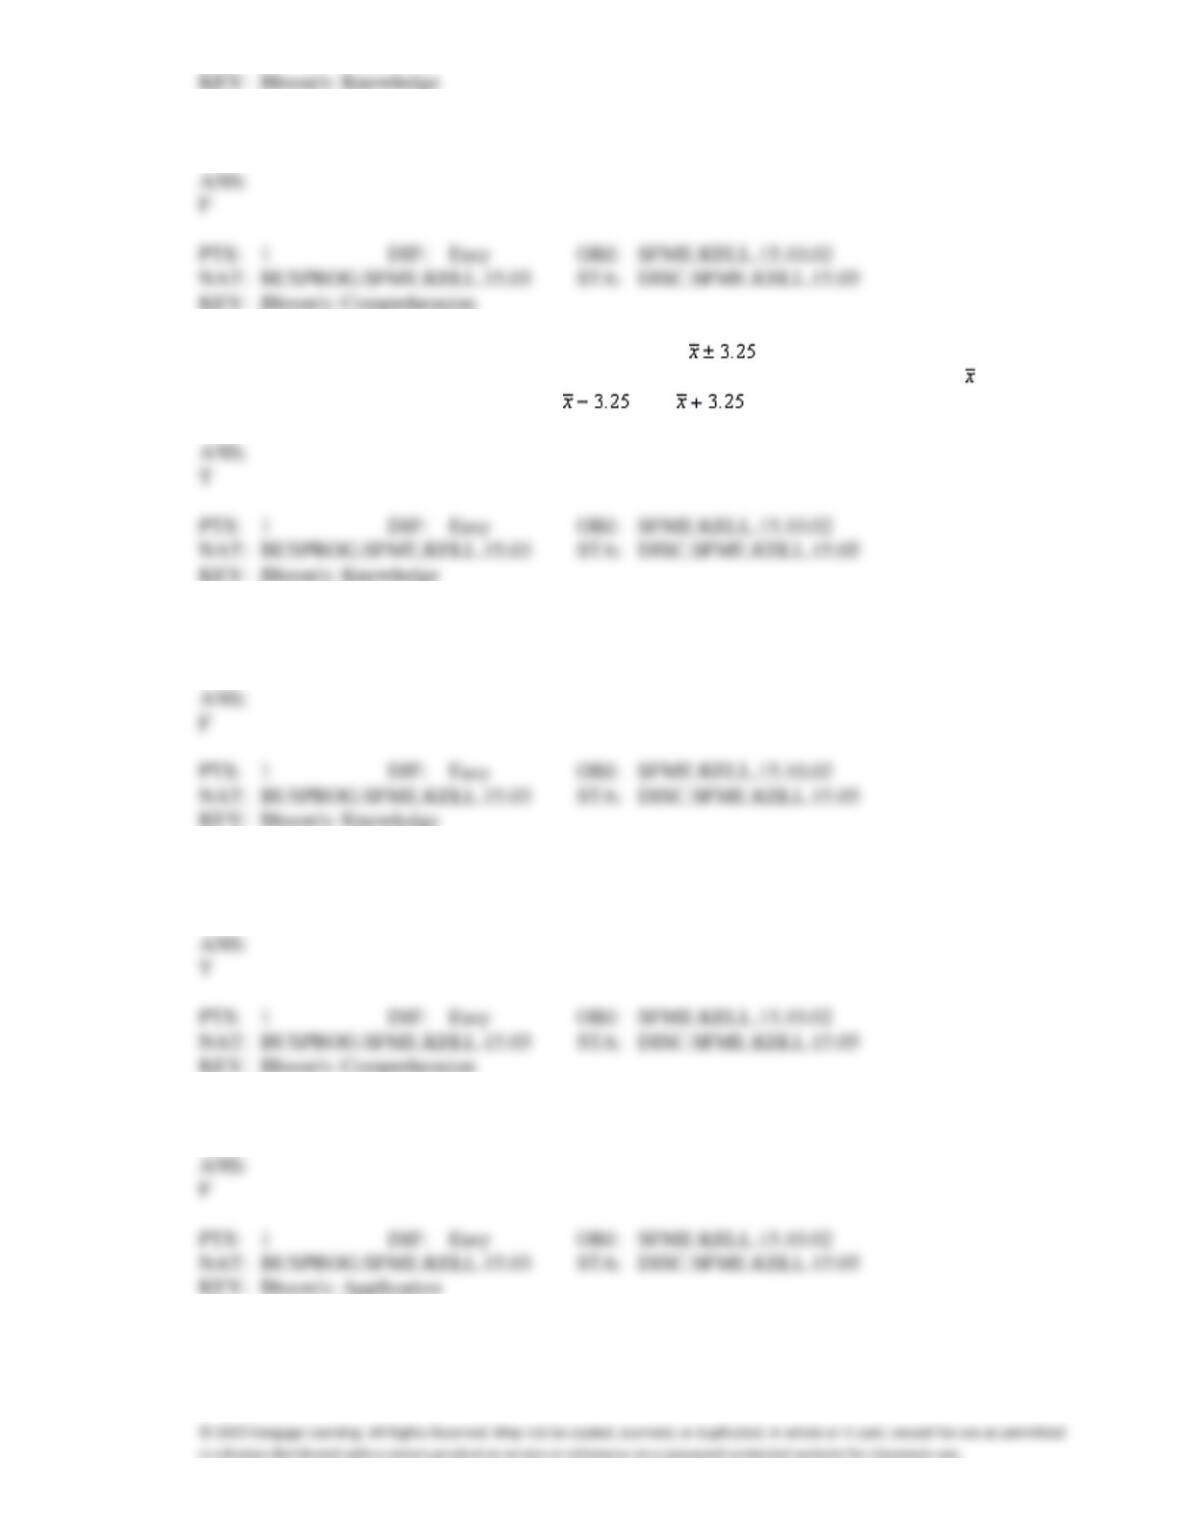
27. Suppose that a 95% confidence interval for
is given by . This notation means that, if we
repeatedly draw samples of the same size from the same population, 95% of the values of will be
such that
would lie somewhere between and .
28. When constructing confidence interval estimate of
, doubling the sample size n decreases the width
of the interval by half.
29. In this chapter you need four values to construct the confidence interval estimate of
. They are the
sample mean, the sample size, the population standard deviation, and the confidence level.
30. Given a mean of 2.1 and a standard deviation of 0.7, a 90% confidence interval will be 2.1 0.7.
31. Suppose a sample size of 5 has mean 9.60. If the population variance is 5 and the population is
normally distributed, the lower limit for a 92% confidence interval is 7.85.
32. Other things being equal, as the confidence level increases, the width of the confidence interval
increases.
33. Other things being equal, the confidence interval for the mean will be wider for 99% confidence than
for 95% confidence.
34. The lower limit of the 90% confidence interval for
, where n = 64, = 70, and
= 20, is 65.89.
35. The letter
in the formula for constructing a confidence interval estimate of the population mean is:
a.
the level of confidence.
b.
the probability that a particular confidence interval will contain the population mean.
c.
the area in the lower tail of the sampling distribution of the sample mean.
d.
None of these choices.
36. Which of the following is an incorrect statement about a 90% confidence interval?
a.
If we repeatedly draw samples of the same size from the same population, 90% of the
resulting confidence intervals will include
.
b.
There is a 90% probability that the population mean
will lie between the lower
confidence limit (LCL) and the upper confidence limit (UCL).
c.
We are 90% confident that our sample mean equals the population mean
.
d.
90% of the population values will lie within the confidence interval.
37. The term 1 −
refers to:
a.
the probability that a confidence interval does not contain the population parameter.
b.
the confidence level.
c.
the level of unbiasedness.
d.
the level of consistency.
38. Suppose an interval estimate for the population mean was 62.84 to 69.46. The population standard
deviation was assumed to be 6.50, and a sample of 100 observations was used. The mean of the sample
was:
a.
6.62
b.
56.34
c.
62.96
d.
66.15
39. The width of a confidence interval estimate of the population mean increases when the:
a.
level of confidence increases
b.
sample size decreases
c.
value of the population standard deviation increases
d.
All of these choices are true.
40. In developing an interval estimate for a population mean, the population standard deviation
was
assumed to be 10. The interval estimate was 50.92 2.14. Had
equaled 20, the interval estimate
would be
a.
60.92 2.14
b.
50.92 12.14
c.
101.84 4.28
d.
50.92 4.28
41. If the confidence level is reduced, the confidence interval:
a.
widens.
b.
remains the same.
c.
narrows.
d.
disappears.
42. The value for a 95% confidence interval estimate for a population mean
is
a.
0.95
b.
0.025
c.
1.65
d.
1.96
43. In developing an interval estimate for a population mean, a sample of 50 observations was used. The
interval estimate was 19.76 1.32. Had the sample size been 200 instead of 50, the interval estimate
would have been:
a.
19.76 .33
b.
19.76 .66
c.
19.76 5.28
d.
None of these choices.
44. After constructing a confidence interval estimate for a population mean, you believe that the interval is
useless because it is too wide. In order to correct this problem, you need to:
a.
increase the sample size.
b.
increase the population standard deviation.
c.
increase the level of confidence.
d.
increase the sample mean.
45. A confidence interval is defined as:
a.
a point estimate plus or minus a specific confidence level.
b.
a lower and upper confidence limit associated with a specific level of confidence.
c.
an interval that has a 95% probability of containing the population parameter.
d.
a lower and upper confidence limit that has a 95% probability of containing the population
parameter.
46. Which of the following is not a part of the formula for constructing a confidence interval estimate of
the population mean?
a.
A point estimate of the population mean.
b.
The standard error of the sampling distribution of the sample mean.
c.
The confidence level.
d.
The value of the population mean.
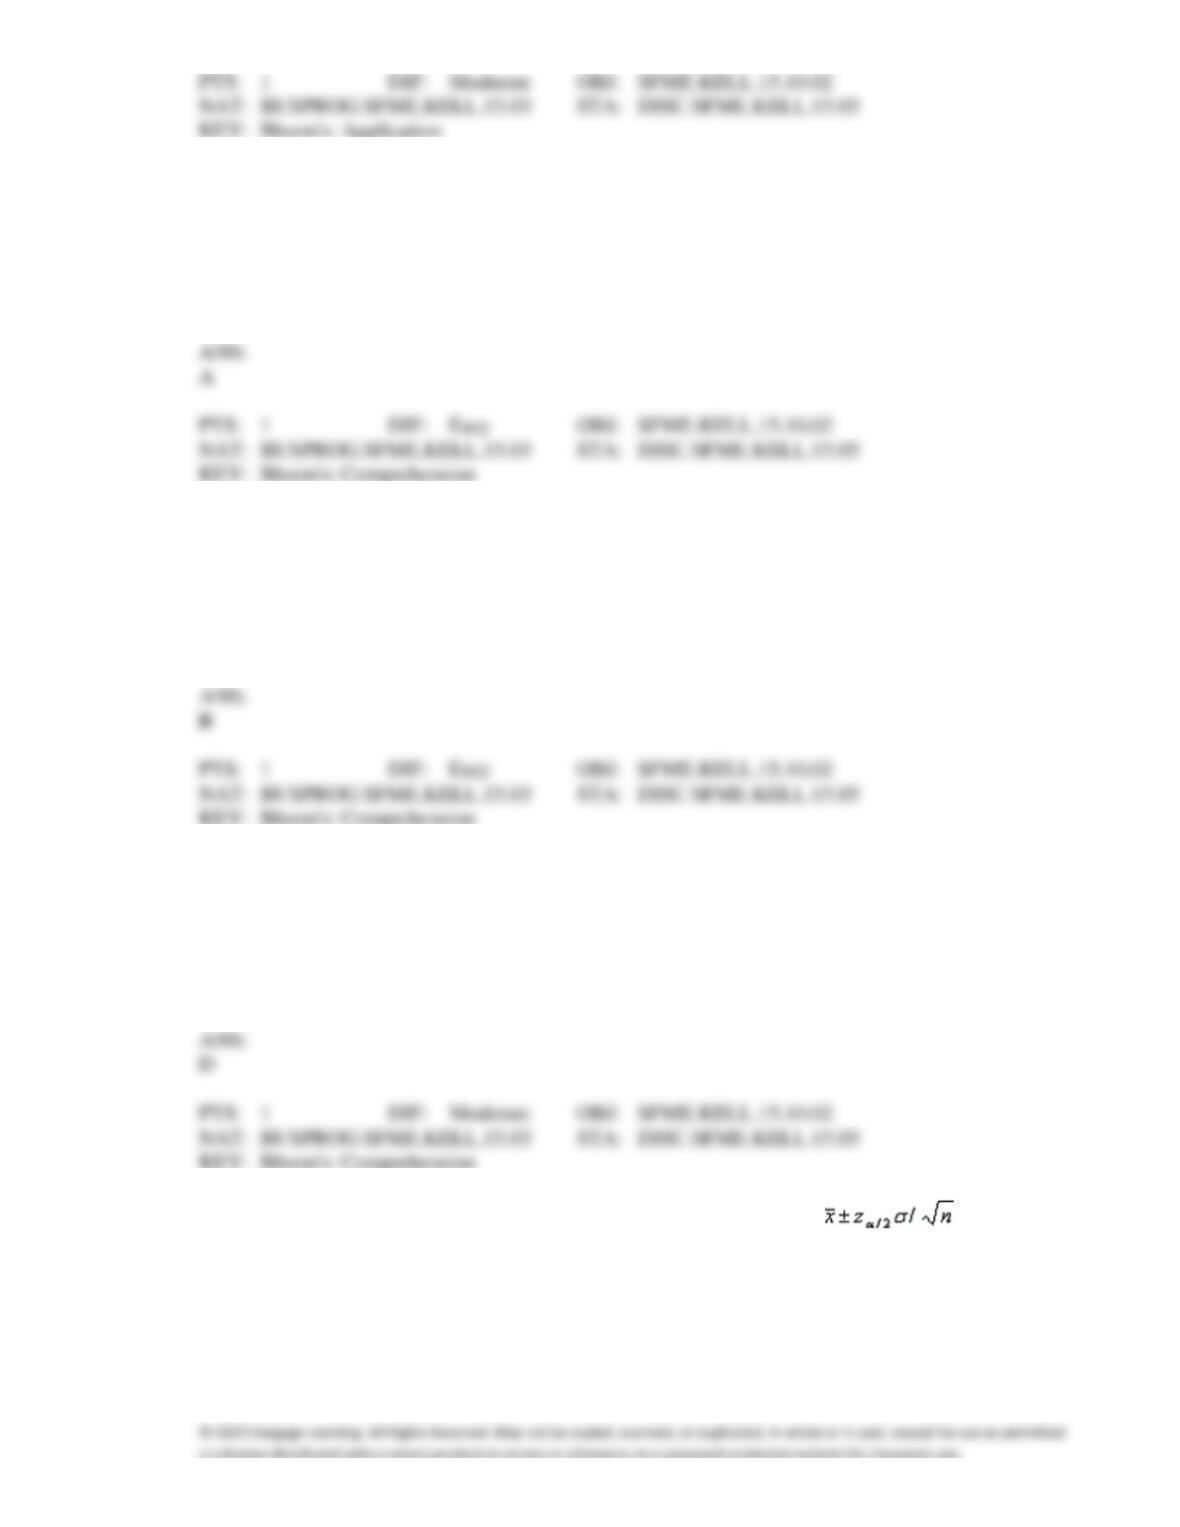
47. Which of the following conditions does not allow you to use the formula to
estimate
?
a.
Population is normally distributed and the population variance is known.
b.
Population is not normally distributed but n is large; population variance is known.
c.
Population has any distribution and n is any size.
d.
All of these choices allow you to use the formula.