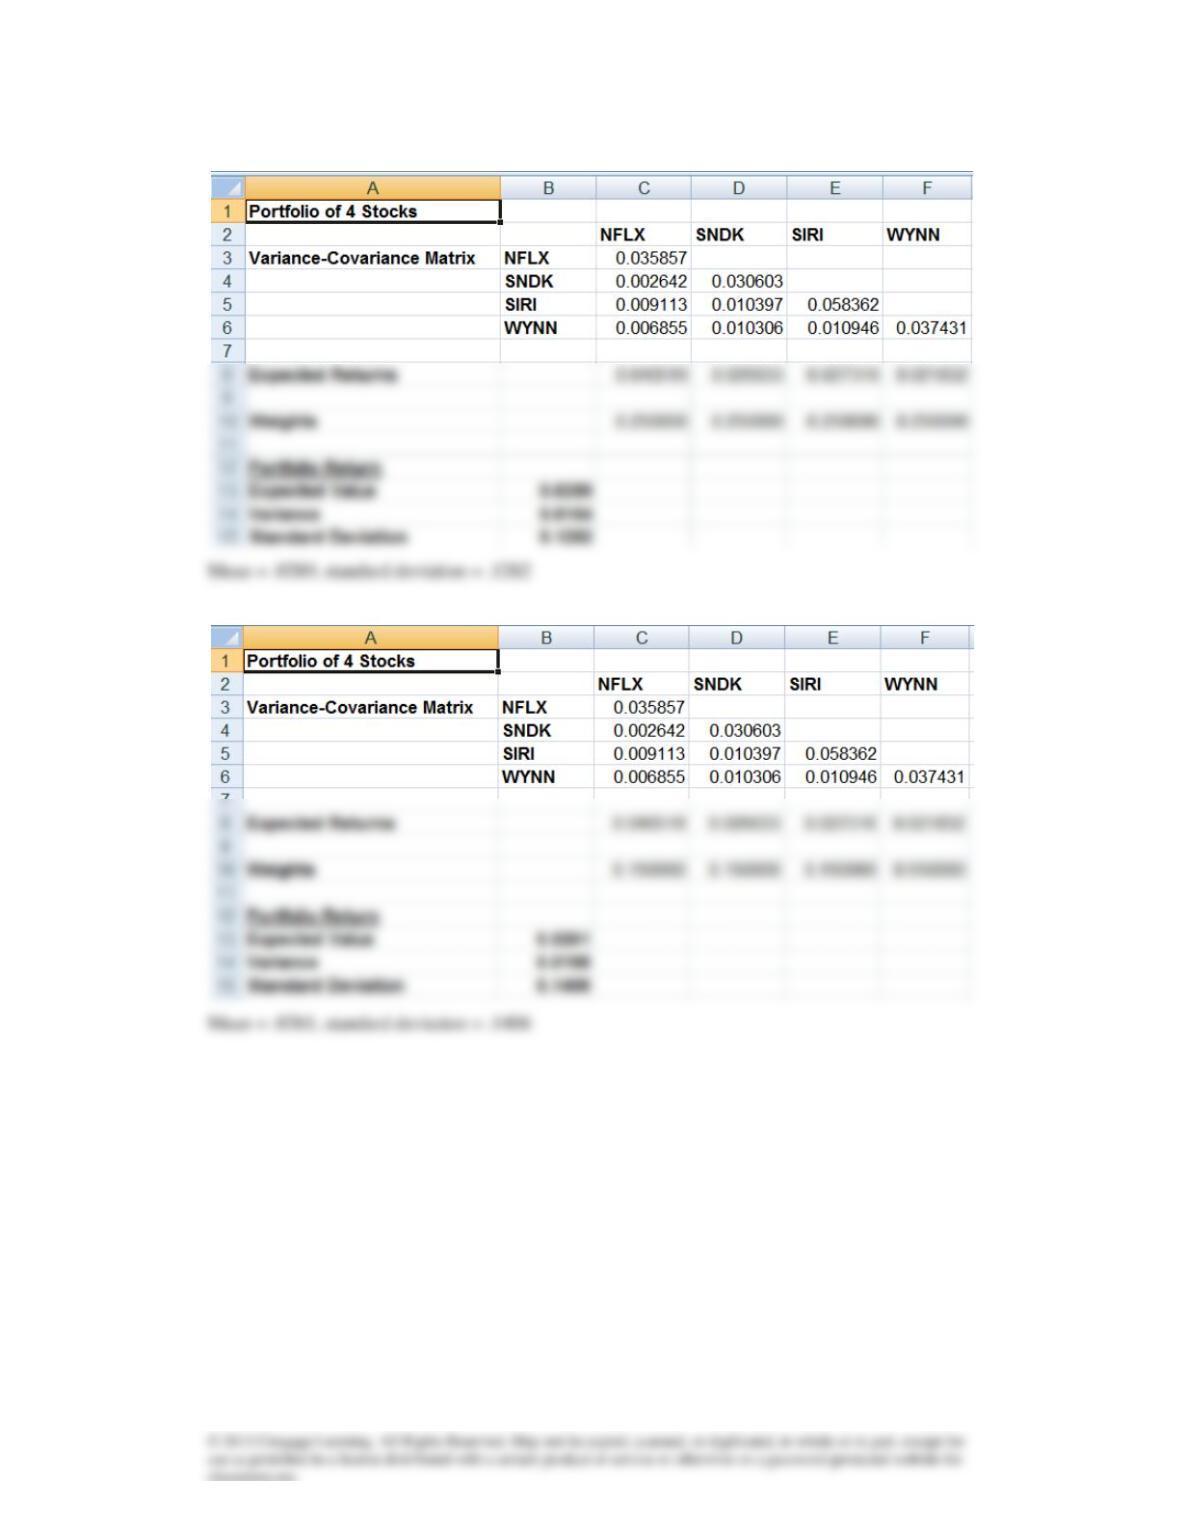
7.80a
b
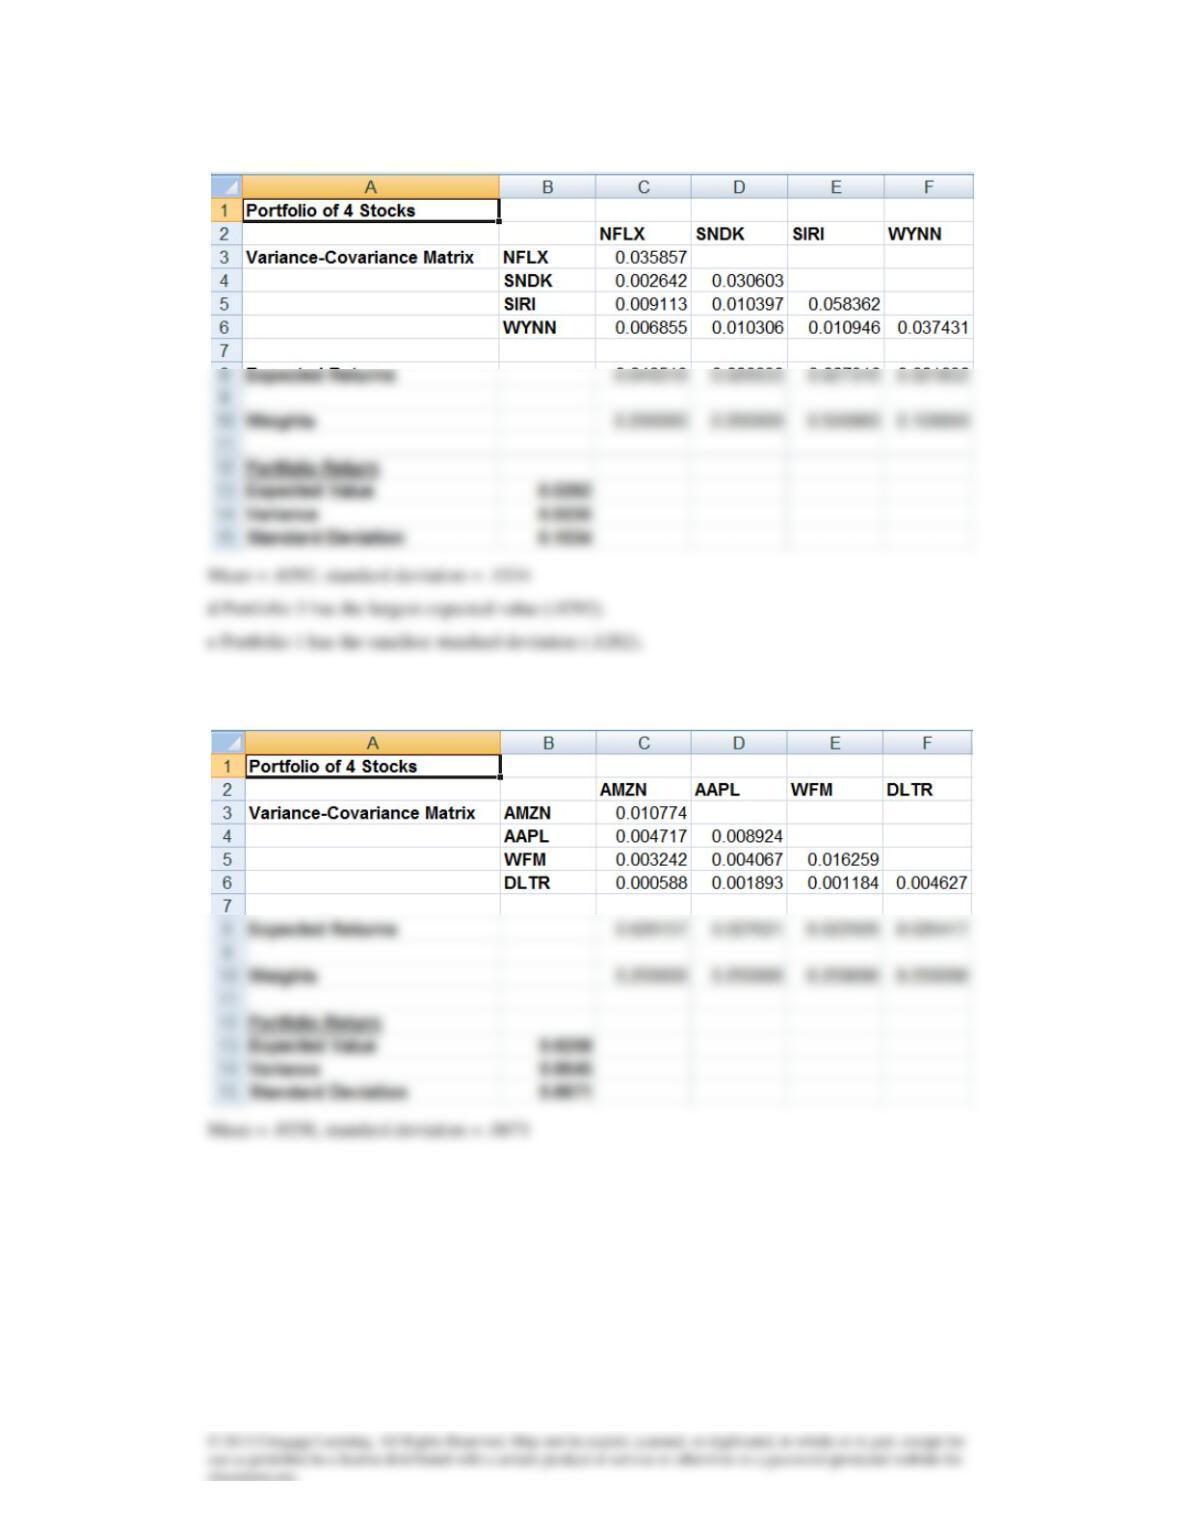
c
7.81a
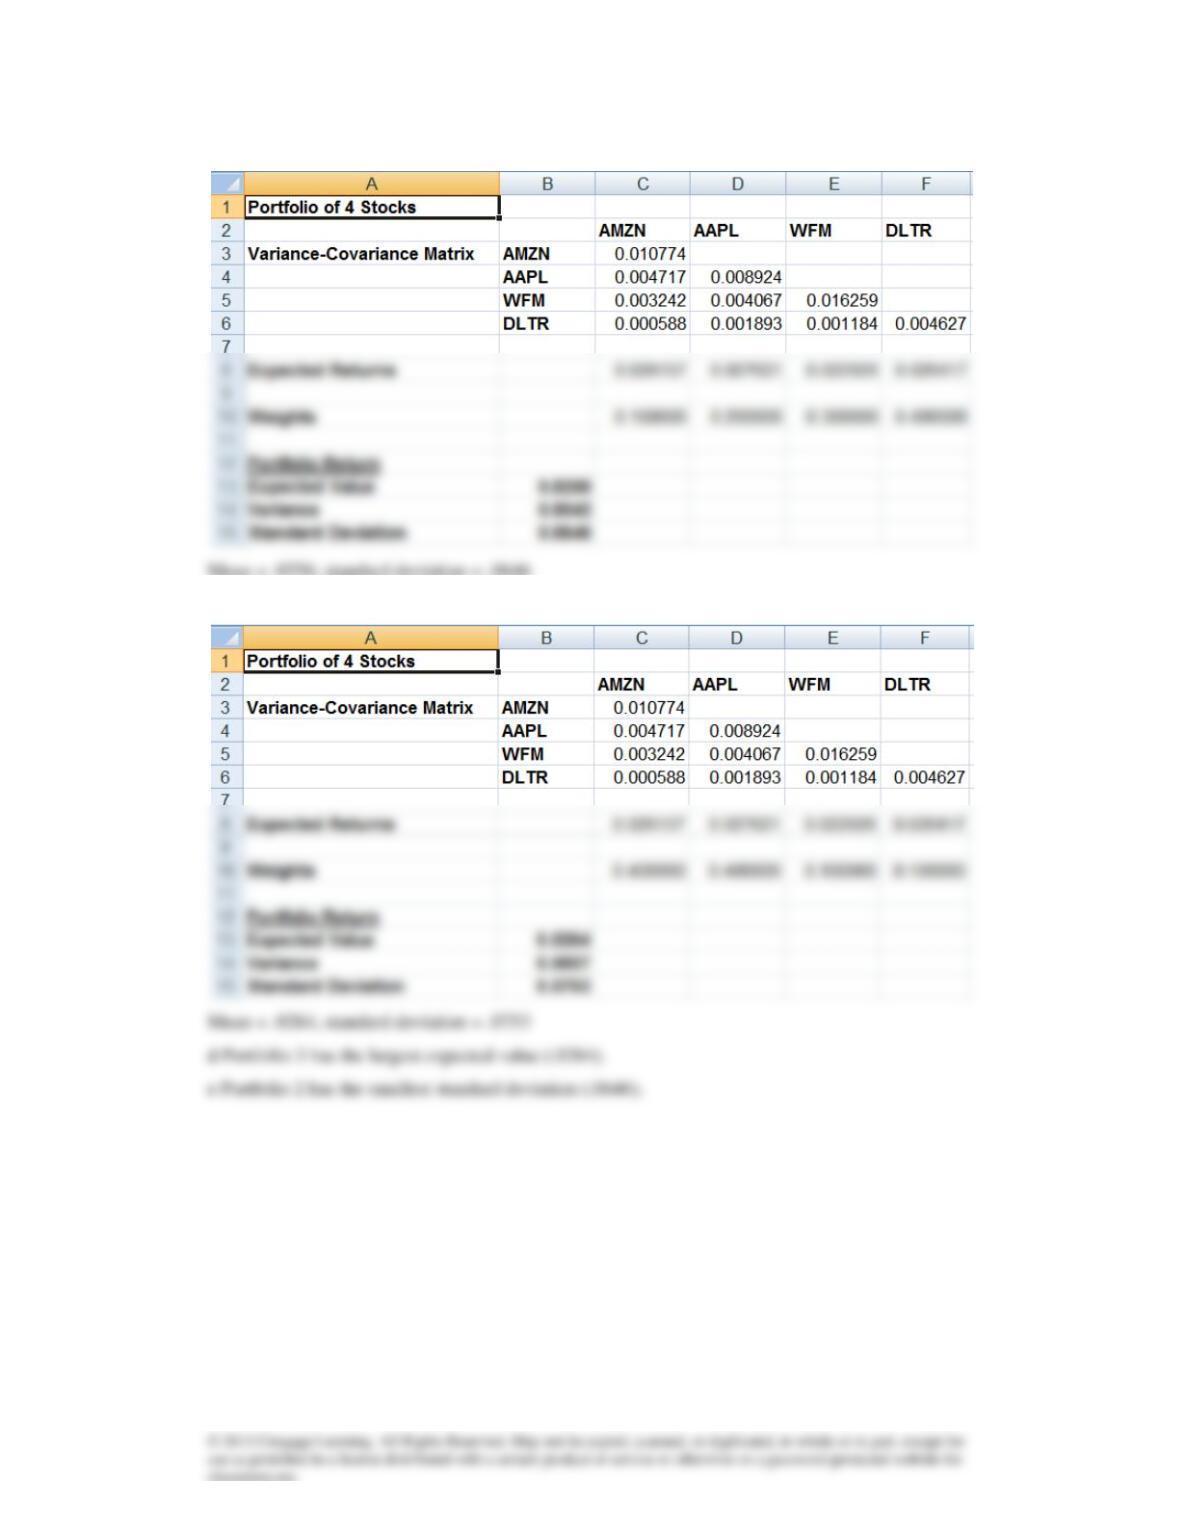
b
Mean = .0256, standard deviation = .0646
c
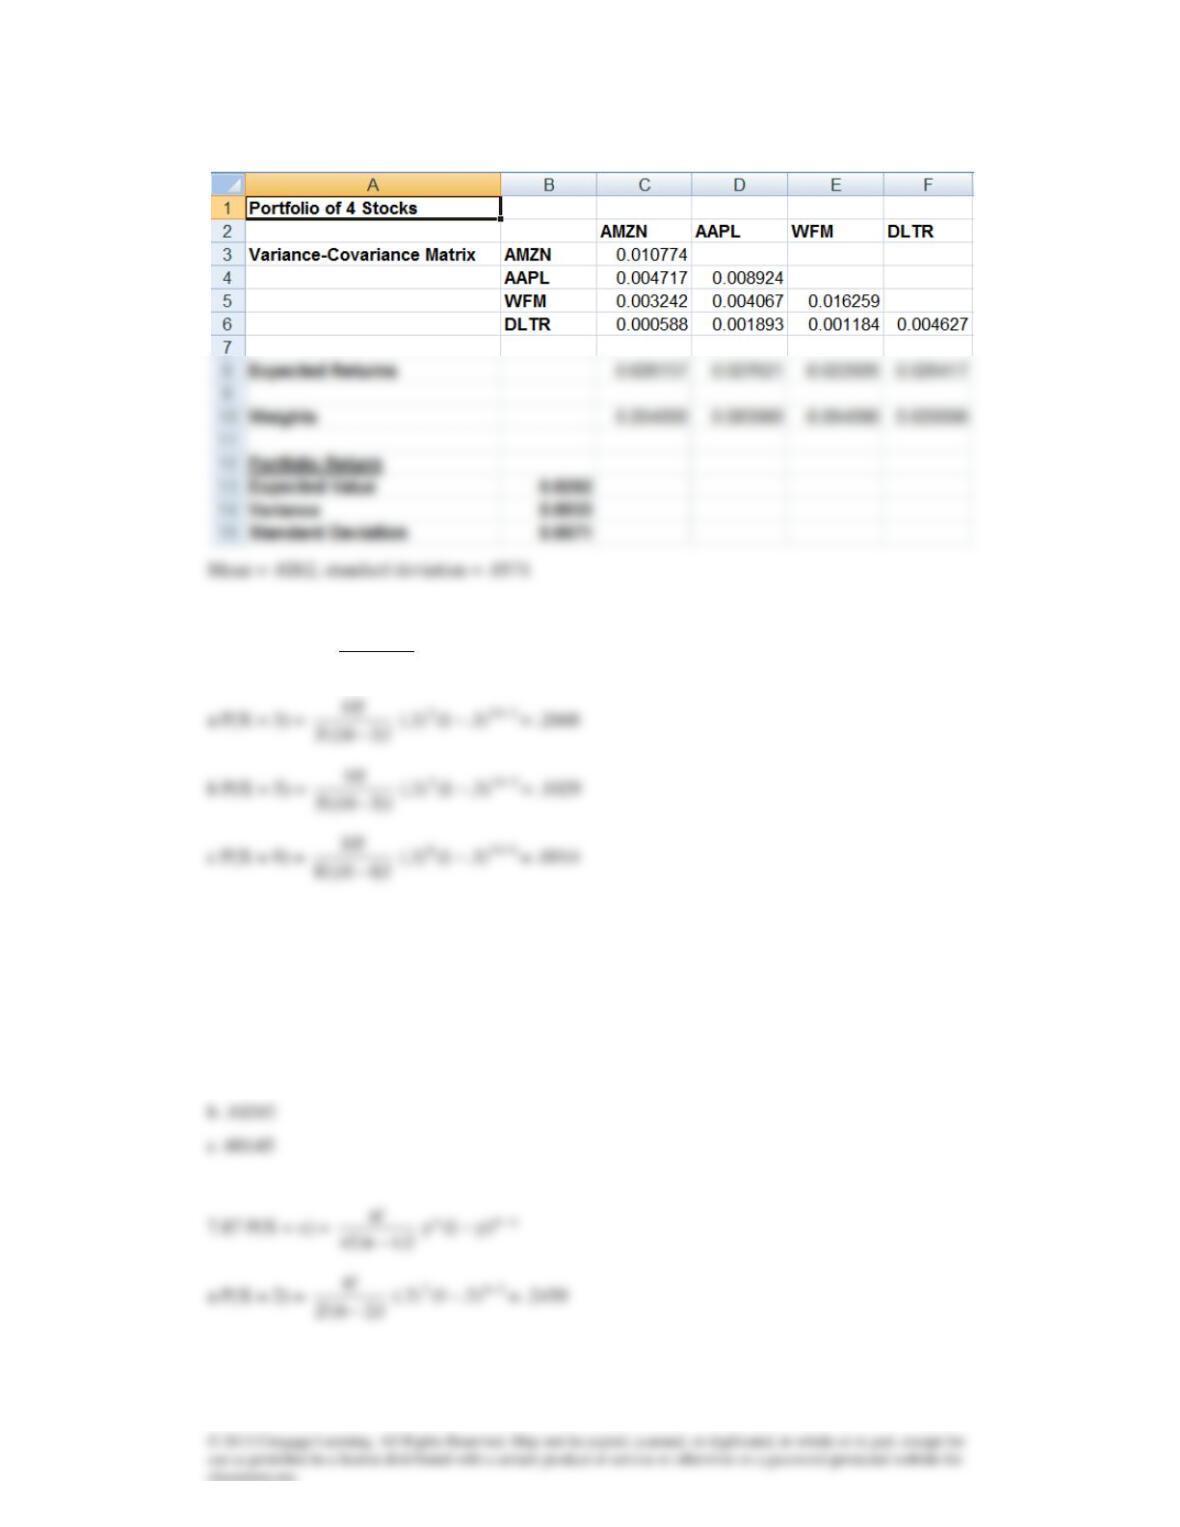
7.83
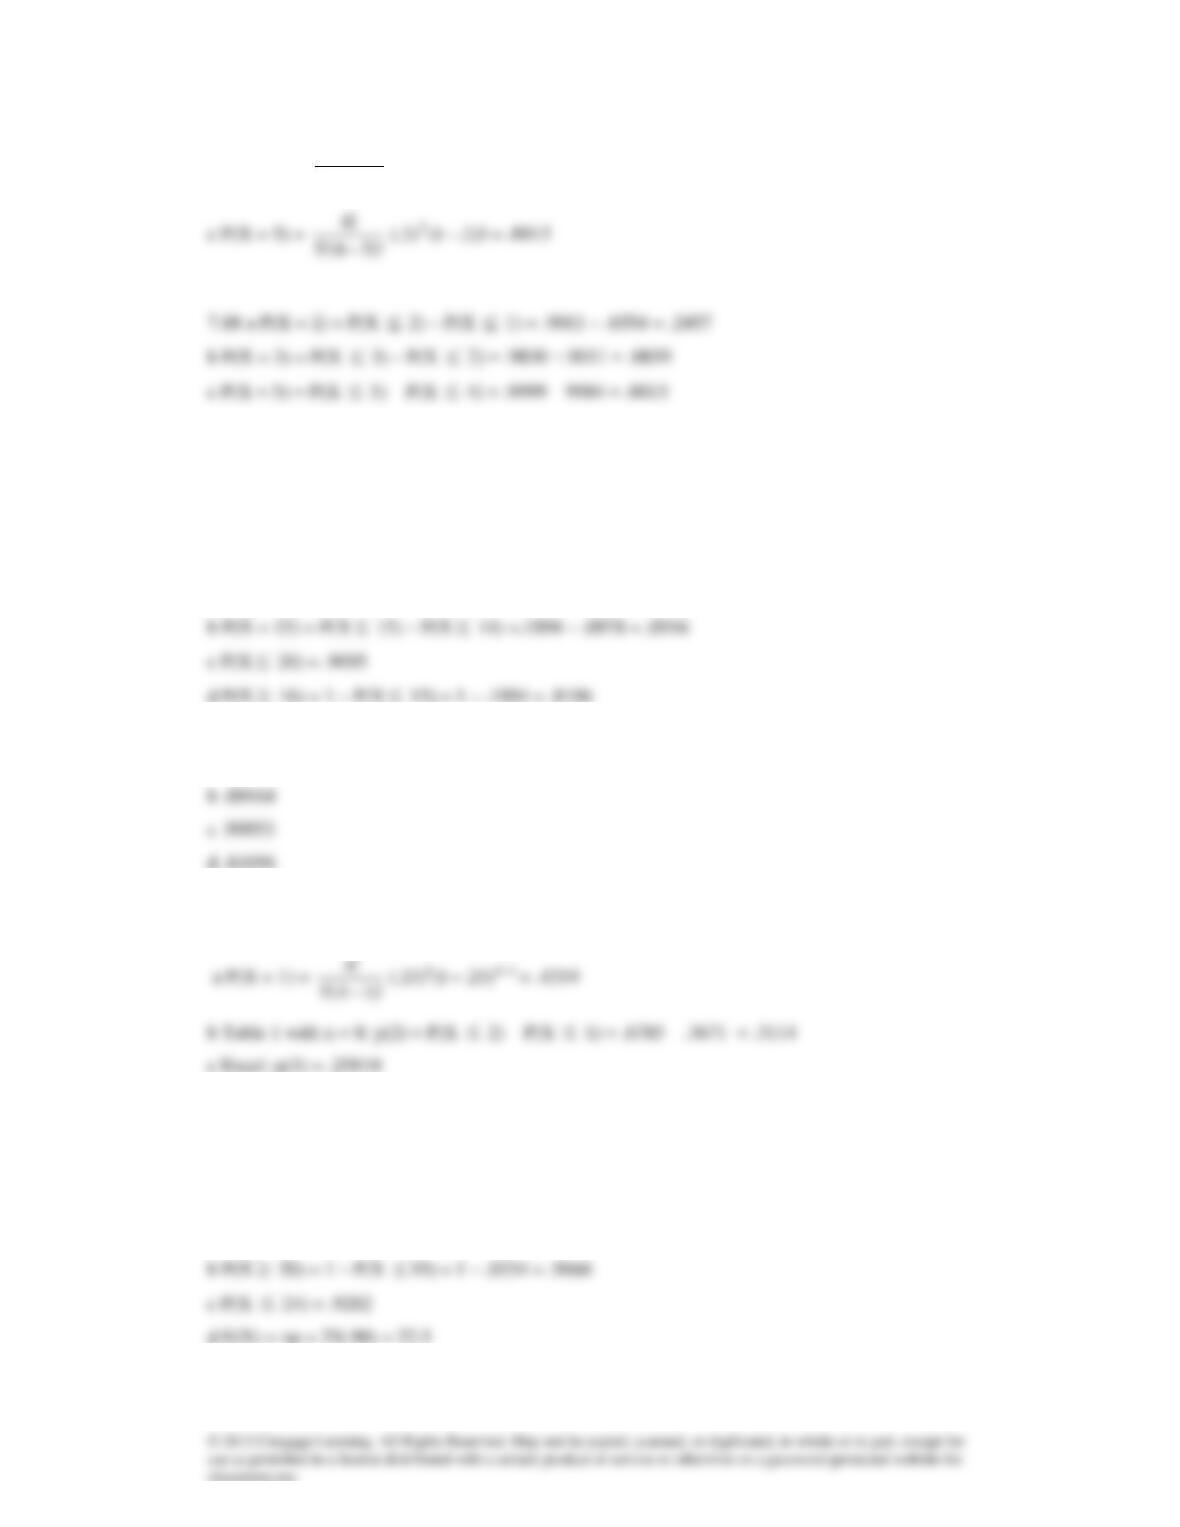
7.84 P(X = x) =
)!xn(!x
!n
−
xnx )p1(p −
−
7.85 a P(X = 3) = P(X
3) – P(X
2) = .6496 – .3828 = .2668
b P(X = 5) = P(X
5) – P(X
4) = .9527 – .8497 = .1030
c P(X = 8) = P(X
8) – P(X
7) = .9999 – .9984 = .0015
7.86 a .26683
)!xn(!x
!n
−
xnx )p1(p −
−
b P(X = 3) =
)!36(!3
!6
−
363 )2.1()2(. −
−
= .0819
)!56(!5
!6
−
7.89 a .24576
b .08192
c .00154
7.90 a P(X = 18) = P(X
18) – P(X
17) = .6593 – .4882 = .1711
7.91 a .17119
7.92 Binomial distribution with p = .25
7.93 Table 1 with n = 25 and p = .3: P(X
10) = .9022
7.94 Table 1 with n = 25 and p = .90
a P(X = 20) = P(X
20) – P(X
19) = .0980 – .0334 = .0646
7.95 Table 1 with n = 25 and p = .75: P(X
15) = 1 – P(X
14) = 1 – .0297 = .9703
7.97 Table 1 with n = 25 and p = .10
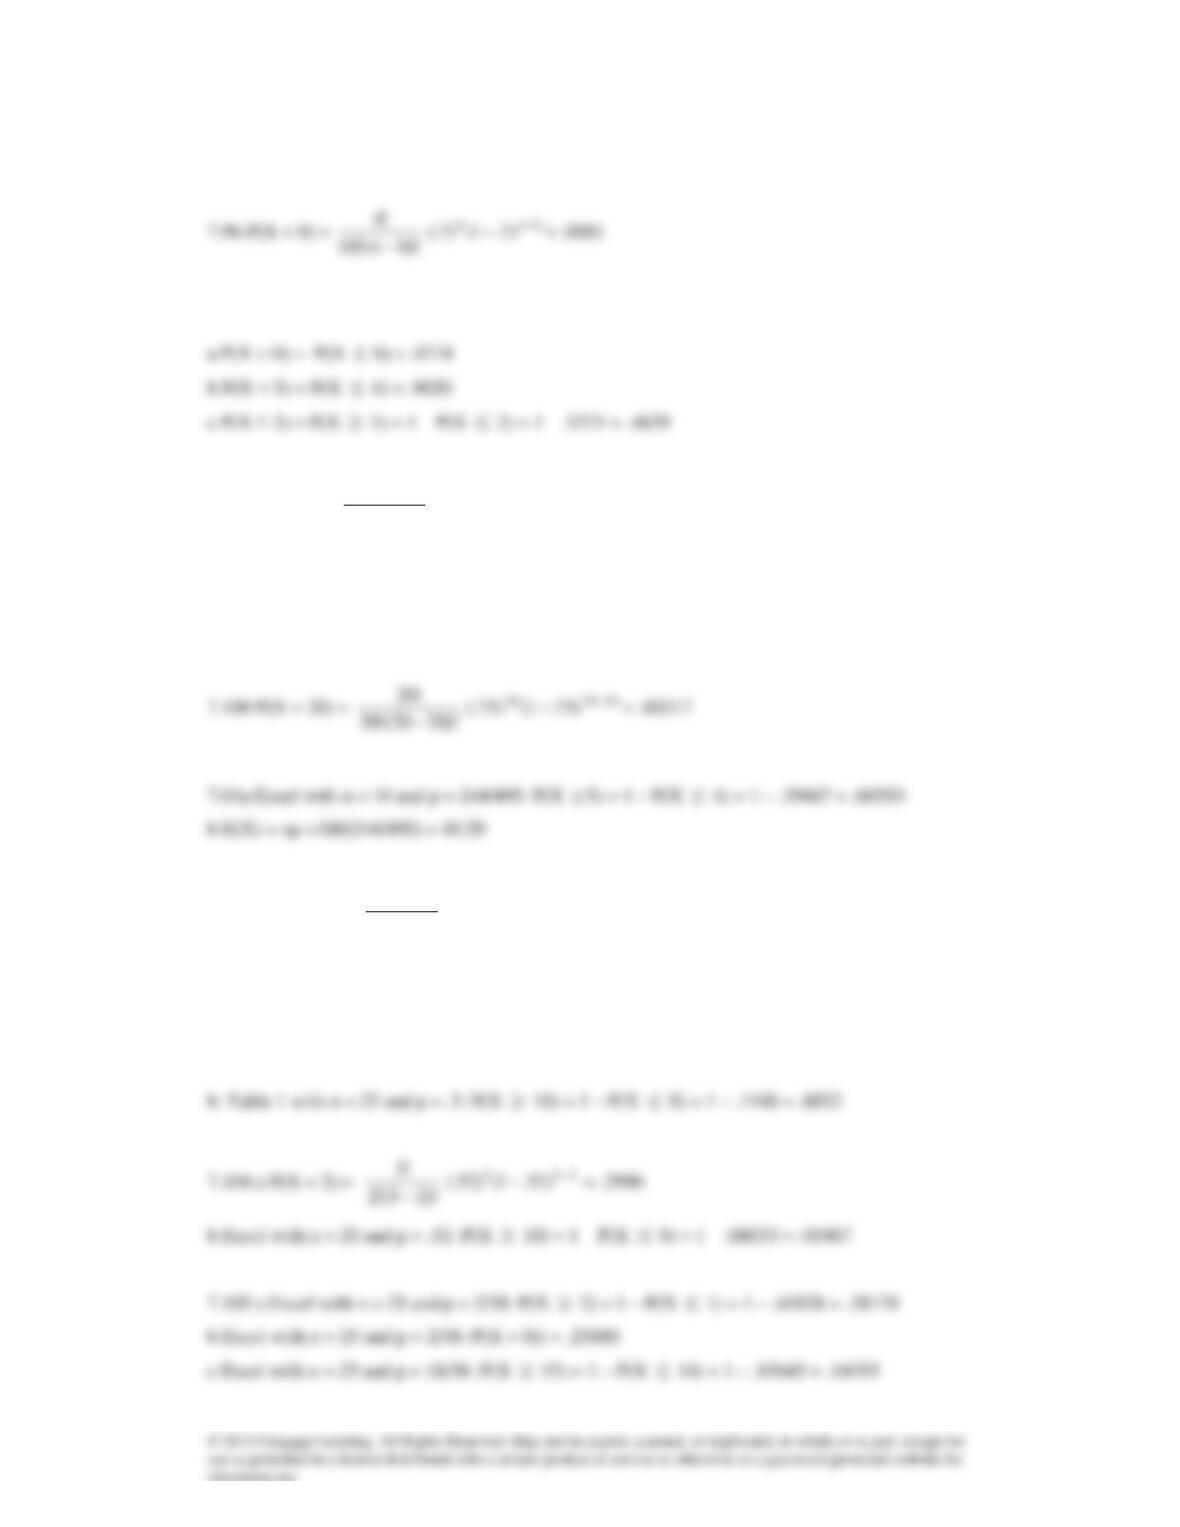
7.98 P(X = 0) =
)!025(!0
!25
−
0250)08.1()08(. −
−
= .1244
7.99 Excel with n = 100 and p = .20: P(X > 25) = P(X
26) = 1 – P(X
25) = 1 – .91252
= .08748
7.102 a P(X = 2) =
)!25(!2
!5
−
252 )45.1()45(. −
−
= .3369
b Excel with n = 25 and p = .45: P(X
10) = 1 – P(X
9) = 1 – .24237 = .75763
7.103 a Table 1 with n = 5 and p = .5: P(X = 2) = P(X
2) – P(X
1) = .5 – .1875 = .3125
d Excel with n = 25 and p = 18/38: P(X
10) = .29680
7.107 Excel with n = 20 and p = .38: P(X
10) = 1 – P(X
9) = 1 – .81032 = .18968
7.108a. Excel with n = 10 and p = .23: P(X
5) = 1 – P(X
4) = 1 – .94308 = .05692
b. Excel with n = 25 and p = .23: P(X
5) = .47015
!x
e
x
−
!x
e
x
−
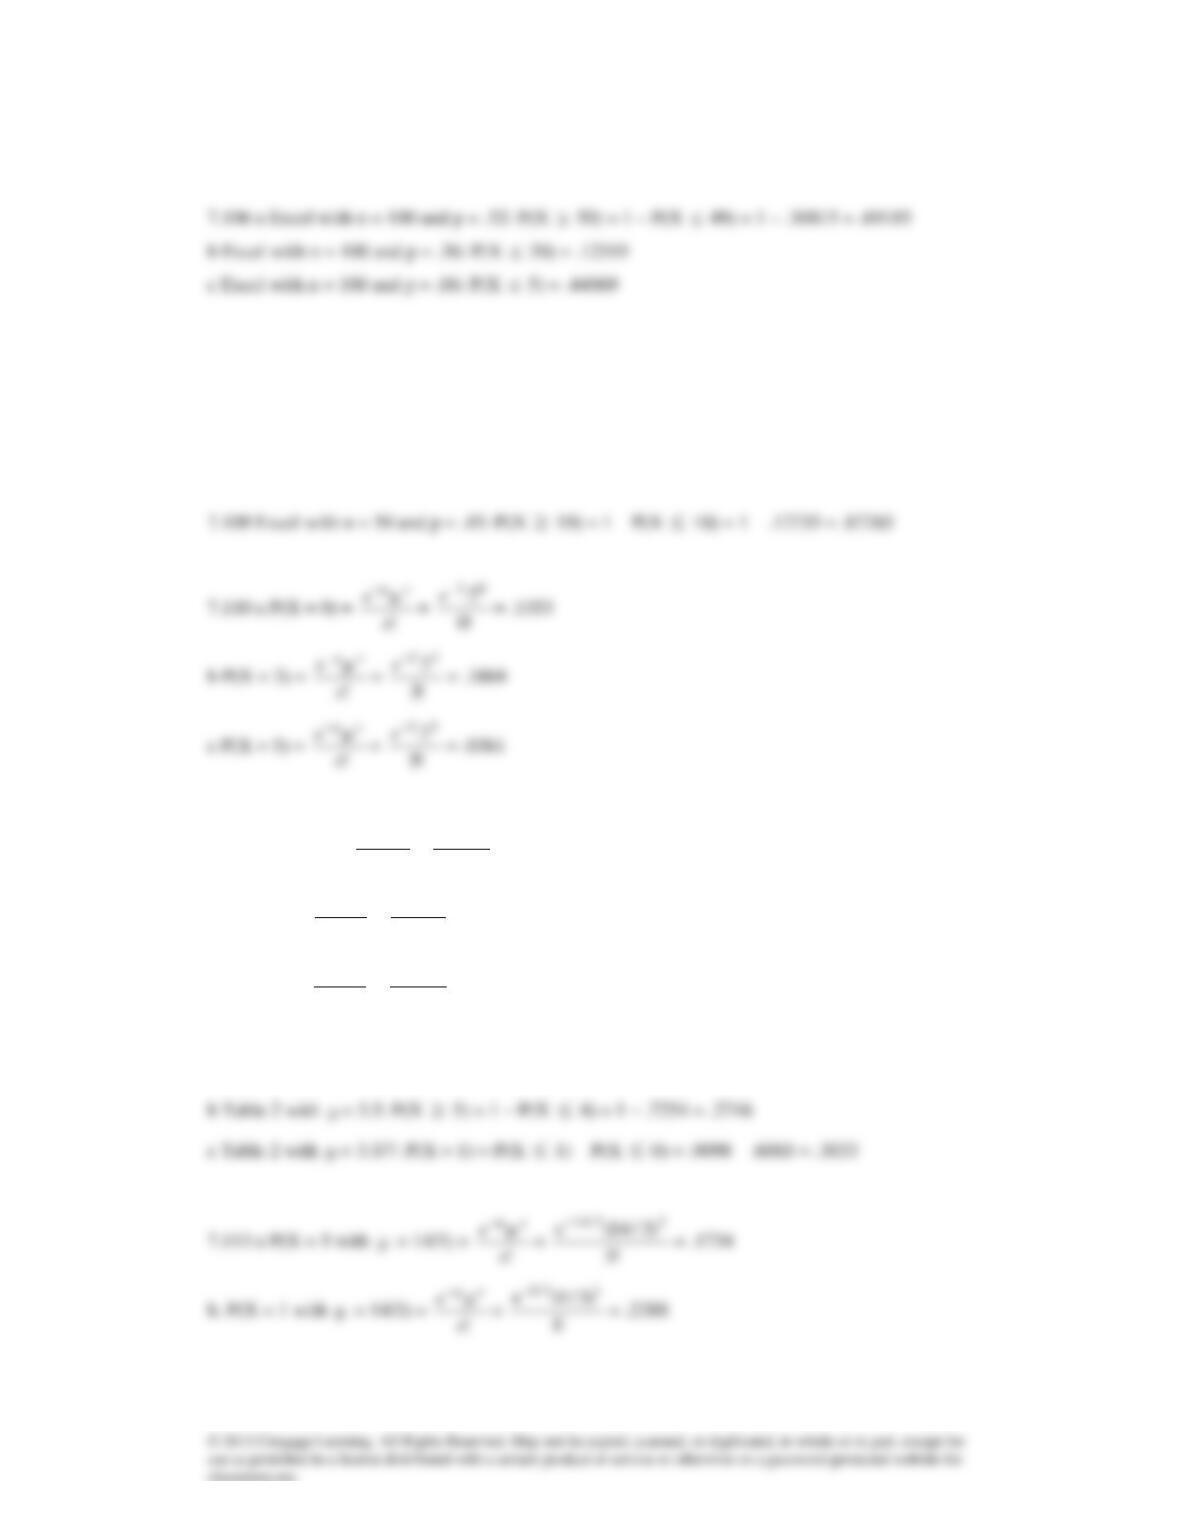
7.111a P(X = 0) =
!x
ex
−
=
!0
5.e 05.−
= .6065
b P(X = 1) =
!x
e
x
−
=
!1
5.e 15.−
= .3033
c P(X = 2) =
!x
e
x
−
=
!2
5.e 25.−
= .0758
7.112 a Table 2 with
= 3.5: P(X = 0) = P(X
0) = .0302
!x
e
x
−
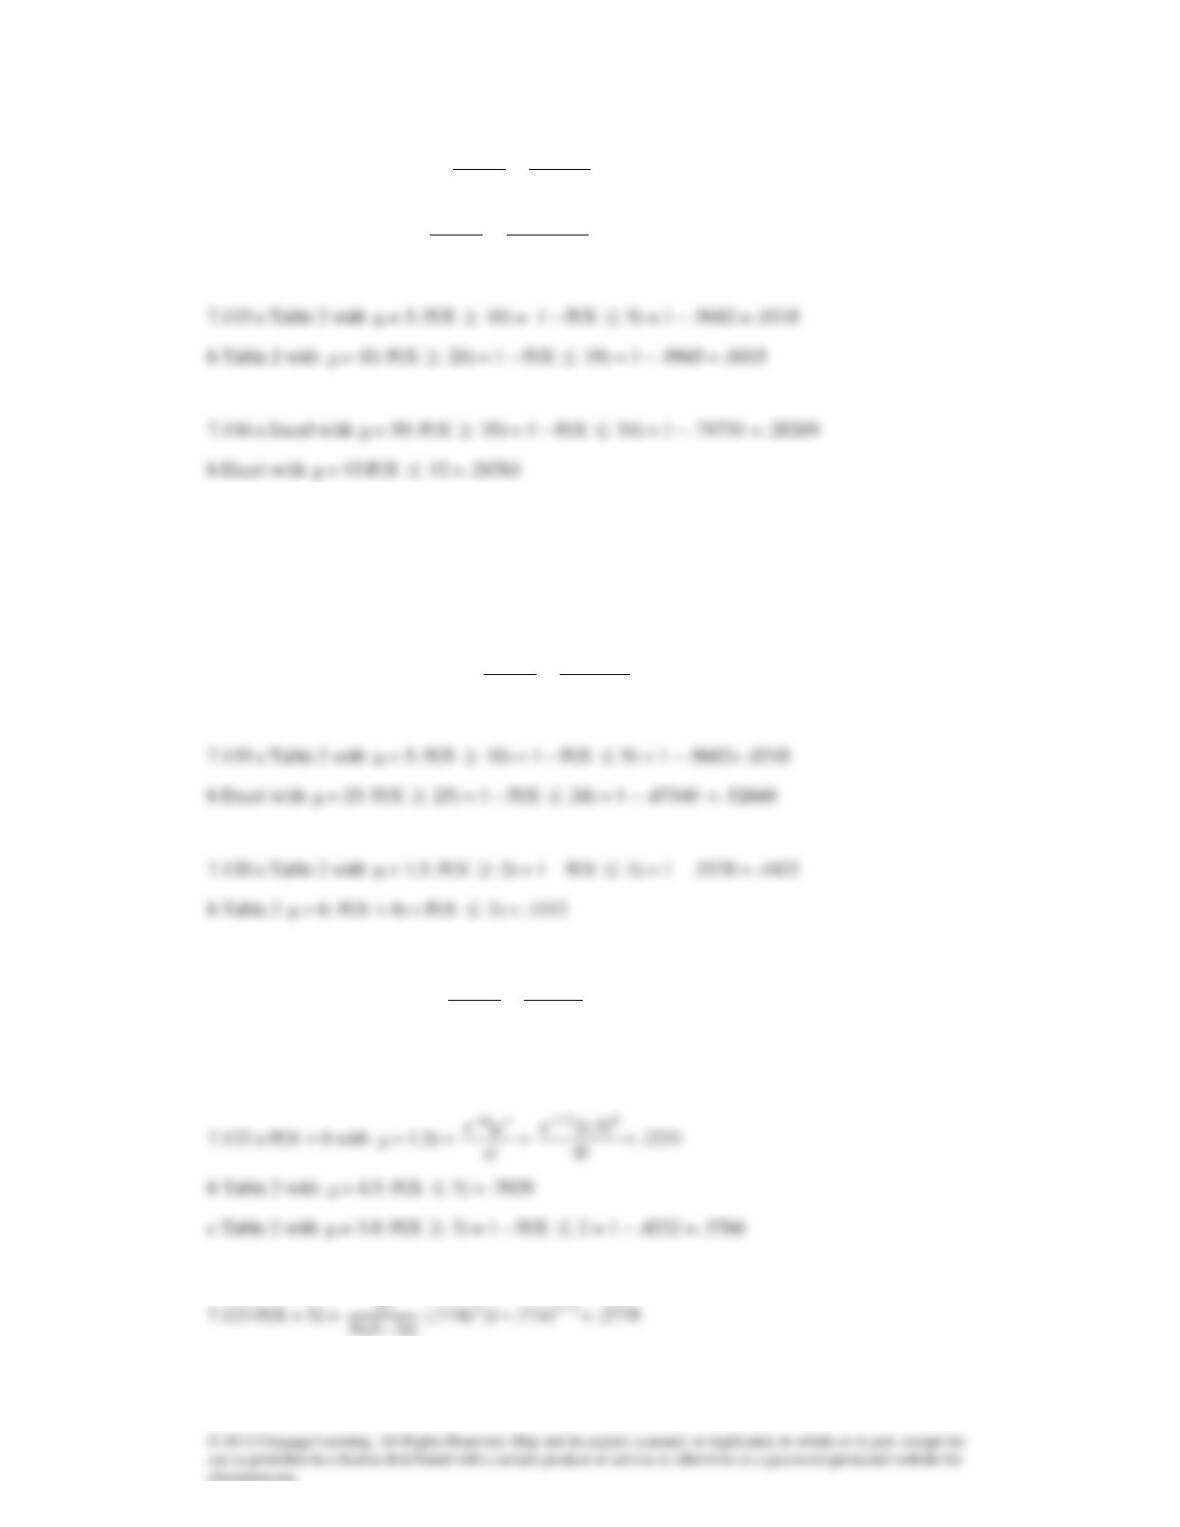
7.114 a P(X = 0 with
= 2) =
!x
e
x
−
=
!0
)2( 02−
e
= .1353
b P(X = 10 with
= 14) =
!x
e
x
−
=
!10
)14(1014−
e
= .0663
7.117 a Excel with
= 1.8: P(X
3) = 1 – P(X
2) = 1 – .73062 = .26938
b Table 2 with
= 9: P(10
X
15) = P(X
15) – P(X
9) = .9780 – .5874 = .3906
7.118 P(X = 0 with
= 80/200) =
!x
e
x
−
=
!0
)4(. 04.−
e
=.6703
7.121 a P(X = 1 with
= 5) =
!x
e
x
−
=
!1
)5( 15−
e
= .0337
b Table 2 with
= 15: P(X > 20) = P(X
21) = 1 – P(X
20) = 1 – .9170 = .0830
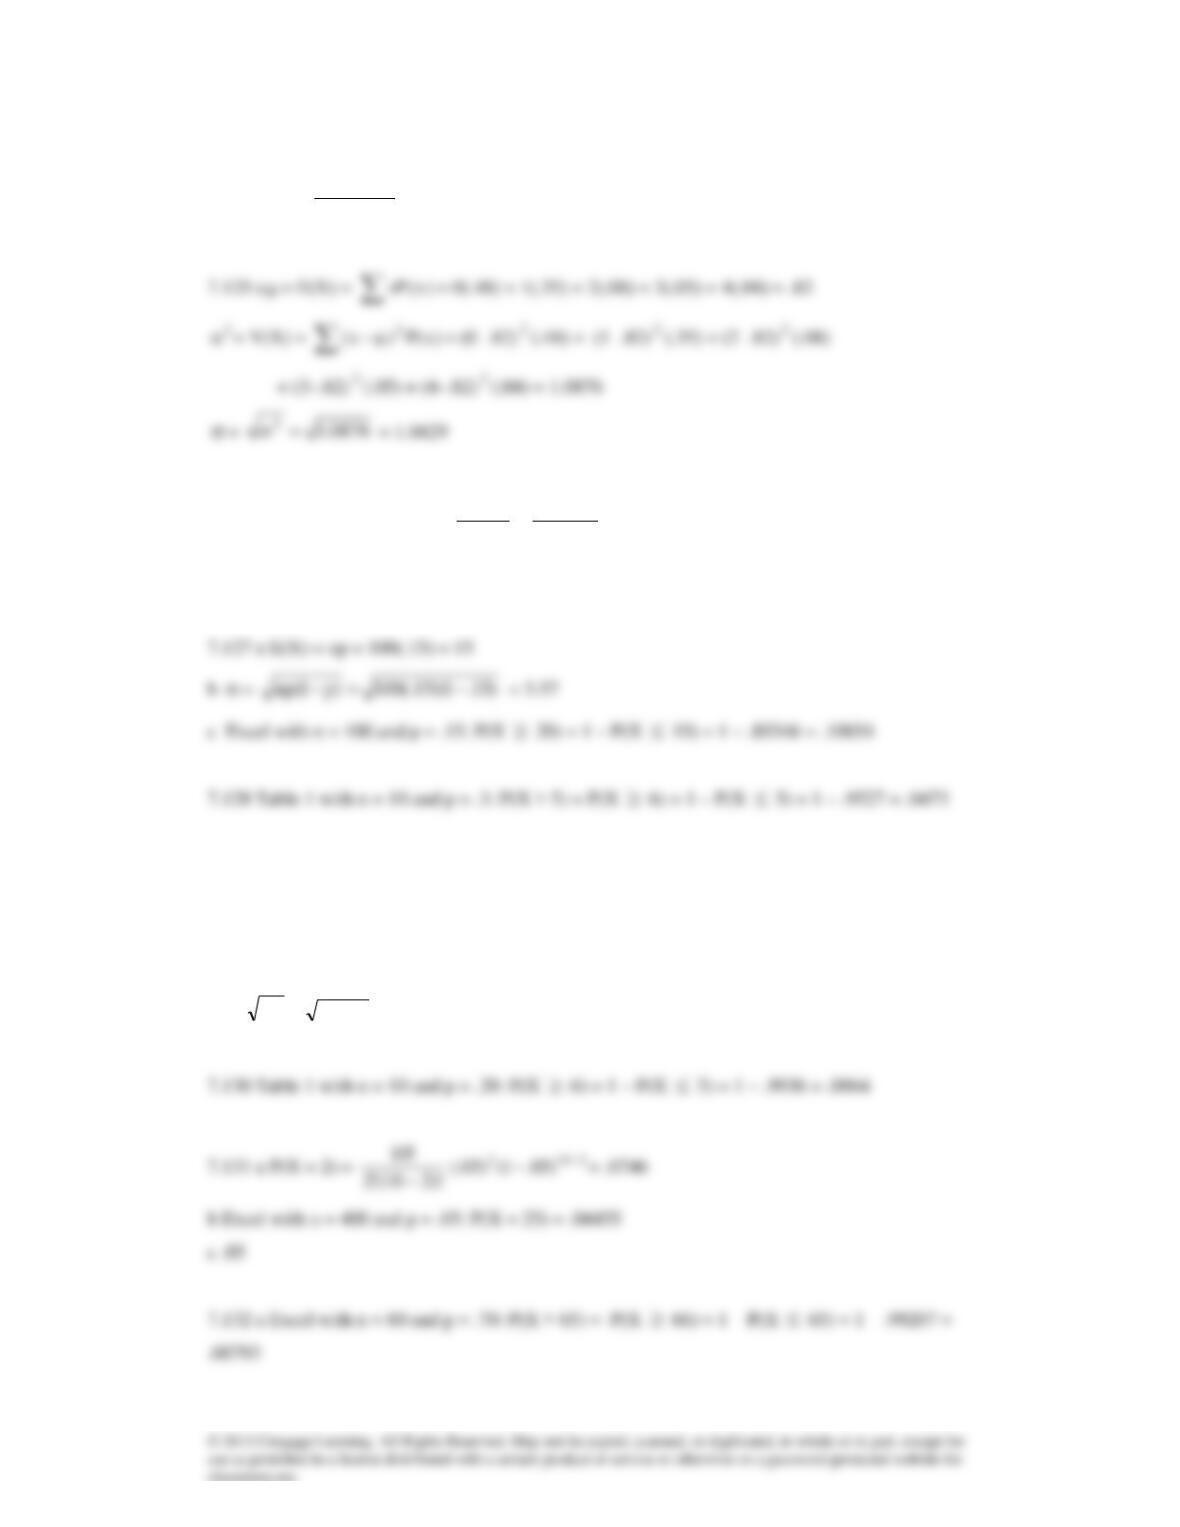
7.124 a E(X) = np = 40(.02) = .8
b P(X = 0) =
)!040(!0
!40
−
0400)02.1()02(. −
−
= .4457
)x(xP
2
2
2
2
2
2
7.126 a P(X = 10 with
= 8) =
!x
e
x
−
=
!10
)8( 108−
e
= .0993
b Table 2 with
= 8: P(X > 5) = P(X
6) = 1 – P(X
5) = 1 – .1912 = .8088
c Table 2 with
= 8: P(X < 12) = P(X
11) = .8881
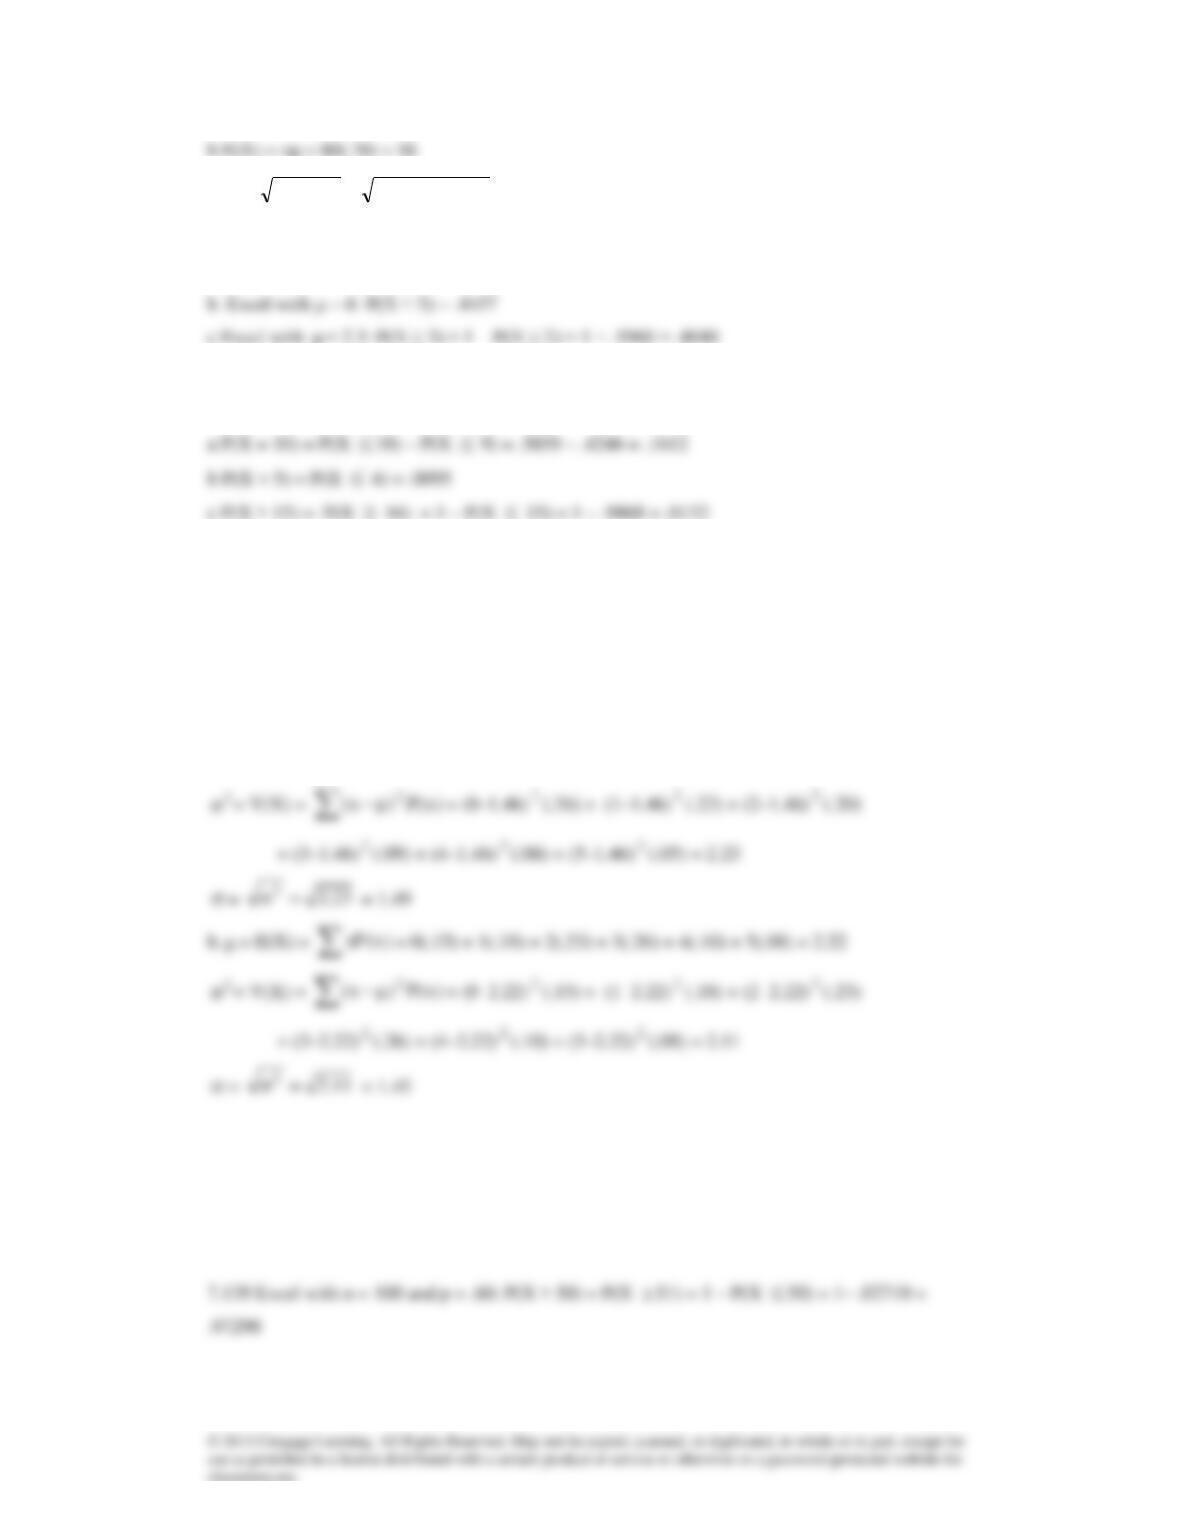
7.129 a
= E(X) =
)x(xP
= 0(.05) + 1(.16) + 2(.41) + 3(.27) + 4(.07) + 5(.04) = 2.27
2
= V(X) =
− )x(P)x( 2
= (0–2.27)
2
(.05) + (1–2.27)
2
(.16) + (2–2.27)
2
(.41)
+ (3–2.27)
2
(.27) + (4–2.27)
2
(.07) + (5–2.27)
2
(.04) = 1.1971
=
1971.1
2=
= 1.0941
c
=
)70.1)(70(.80)p1(np −=−
= 4.10
7.133 a Excel with
= 9.6: P(X ≥ 10) = 1 – P(X ≤ 9) = 1 − .5089 = .4911
7.134 Table 1 with n = 25 and p = .40:
7.135 Excel with n = 100 and p = .45:
a P(X > 50) = P(X
49) = 1 – P(X
50) = 1 – .86542 = .13458
b P(X < 44) = P(X
43) = .38277
c P(X = 45) = .07999
7.136 a.
= E(X) =
)x(xP
= 0(.36) + 1(.22) + 2(.20) + 3(.09) + 4(.08) + 5(.05) = 1.46
)x(xP
7.137 Excel with n = 25 and p = 1/3: P(X
10) = 1 – P(X
9) = 1– .69560 = .30440
7.138 p = .08755 because P(X
1) = 1– P(X = 0 with n = 10 and p = .08755) = 1– .40 = .60
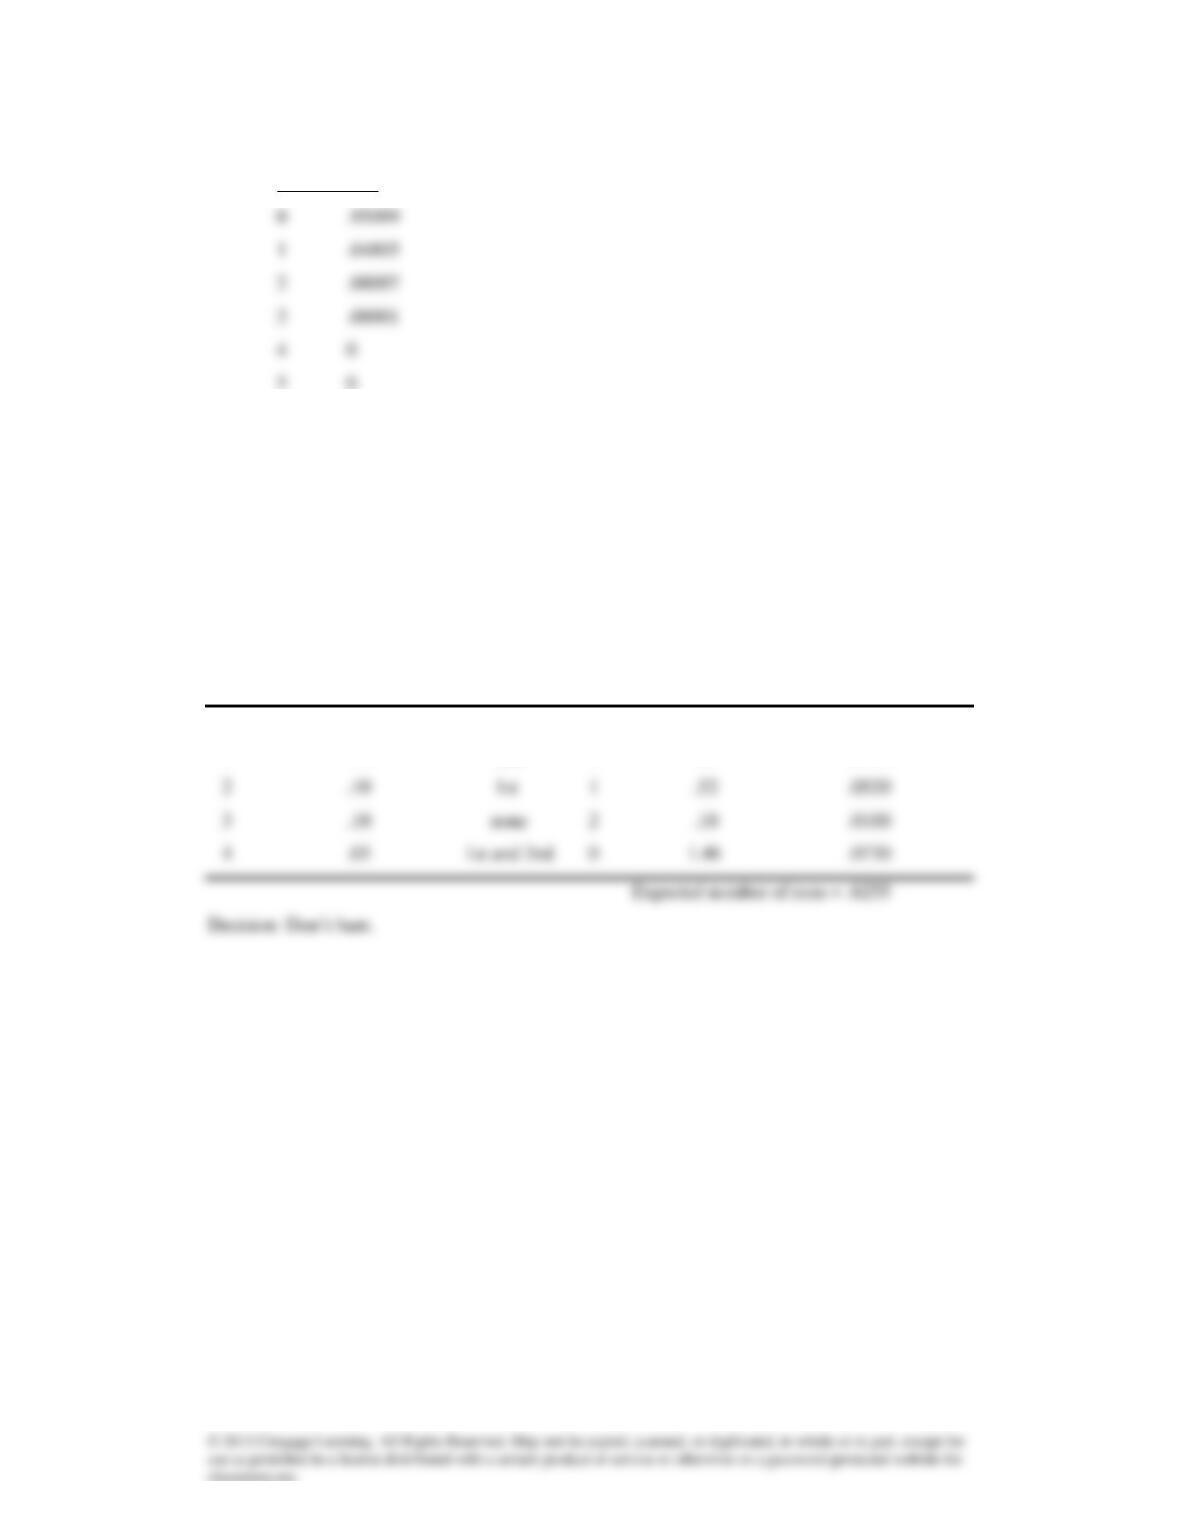
7.140 Binomial with n = 5 and p = .01. (using Excel)
x p(x)
Case 7.1
Expected number of runs without bunting = .85.
If batter bunts:
Bases Expected Number
Outcome Probability Occupied Outs of Runs
1 .75 2nd 1 .69 .5175