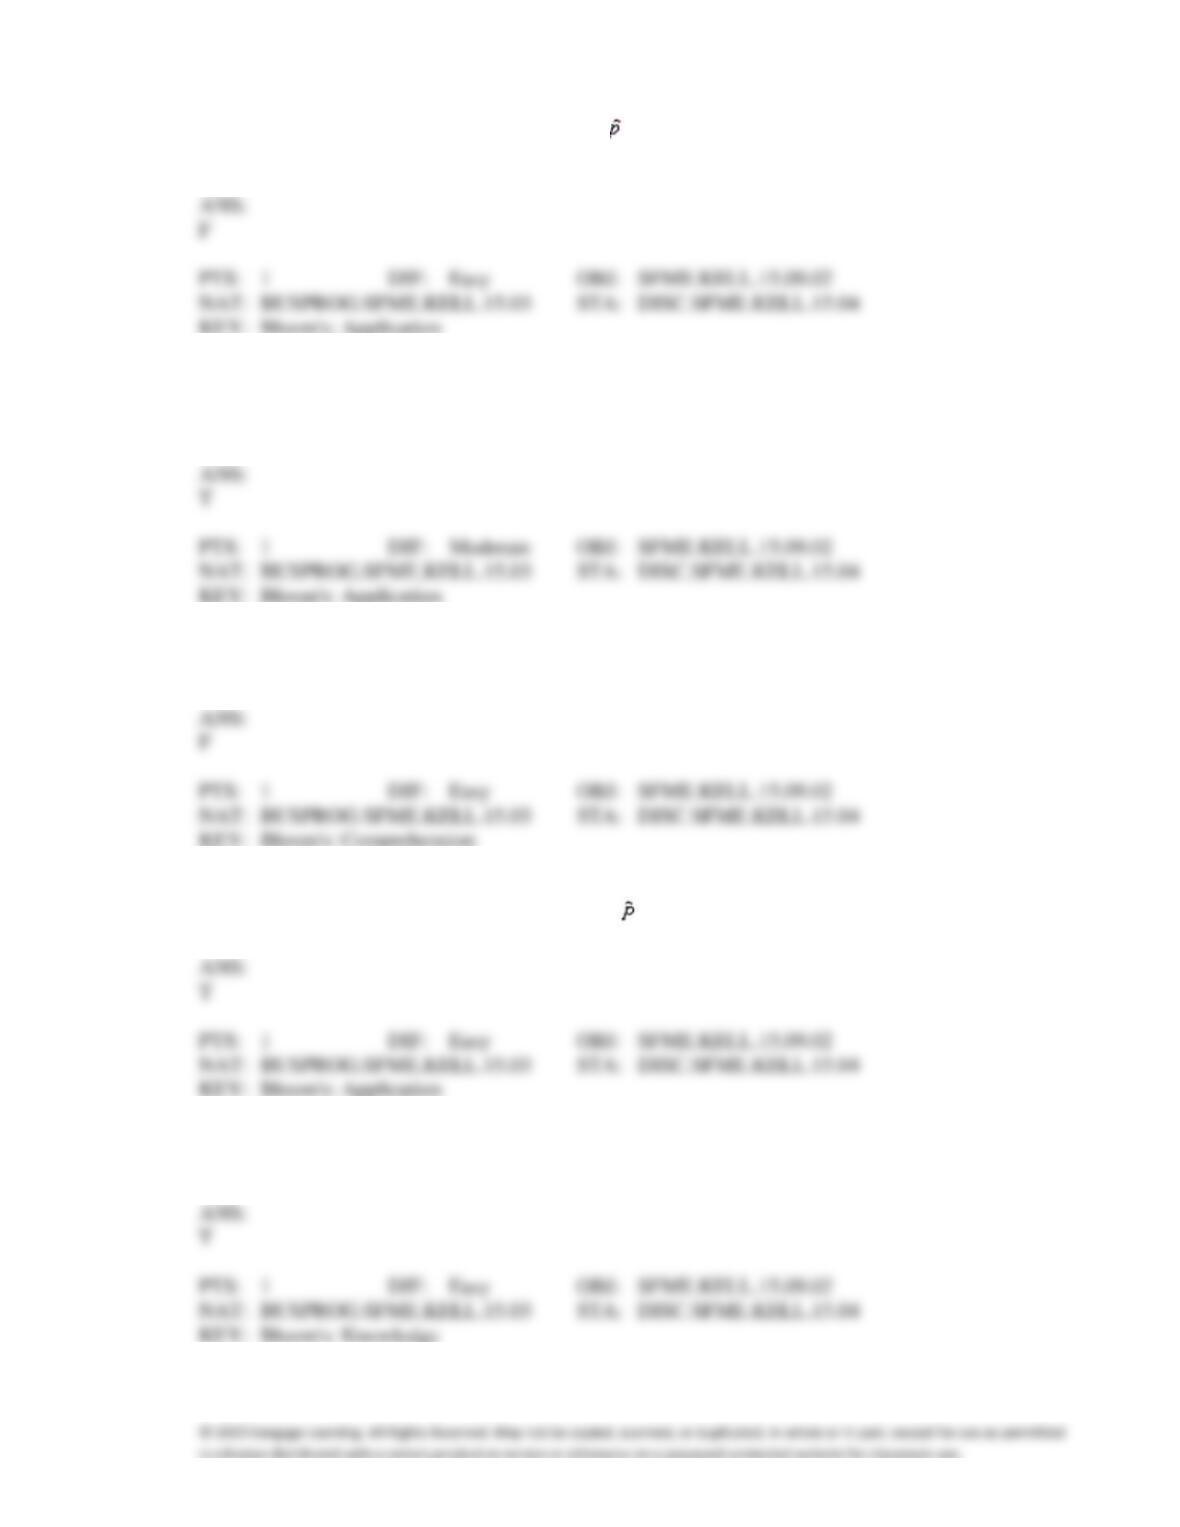
33. Recall the rule of thumb used to indicate when the normal distribution is a good approximation of the
sampling distribution for the sample proportion . For the combination n = 50, p = 0.05, the rule is
satisfied.
34. In an effort to identify the true proportion of college freshman who are under 18 years of age, a
random sample of 500 freshmen was taken. Fifty of them were under the age of 18. The value 0.10 is a
point estimate of the true proportion of freshman under age 18.
35. As a general rule, the normal distribution is used to approximate the sampling distribution of the
sample proportion only if the sample size n is greater than or equal to 30.
36. If a simple random sample of 300 observations is taken from a population whose proportion p = 0.6,
then the expected value of the sample proportion is 0.60.
37. In general, the binomial probability P(X = x) is approximated by the area under a normal curve
between x − .5 and x + .5.
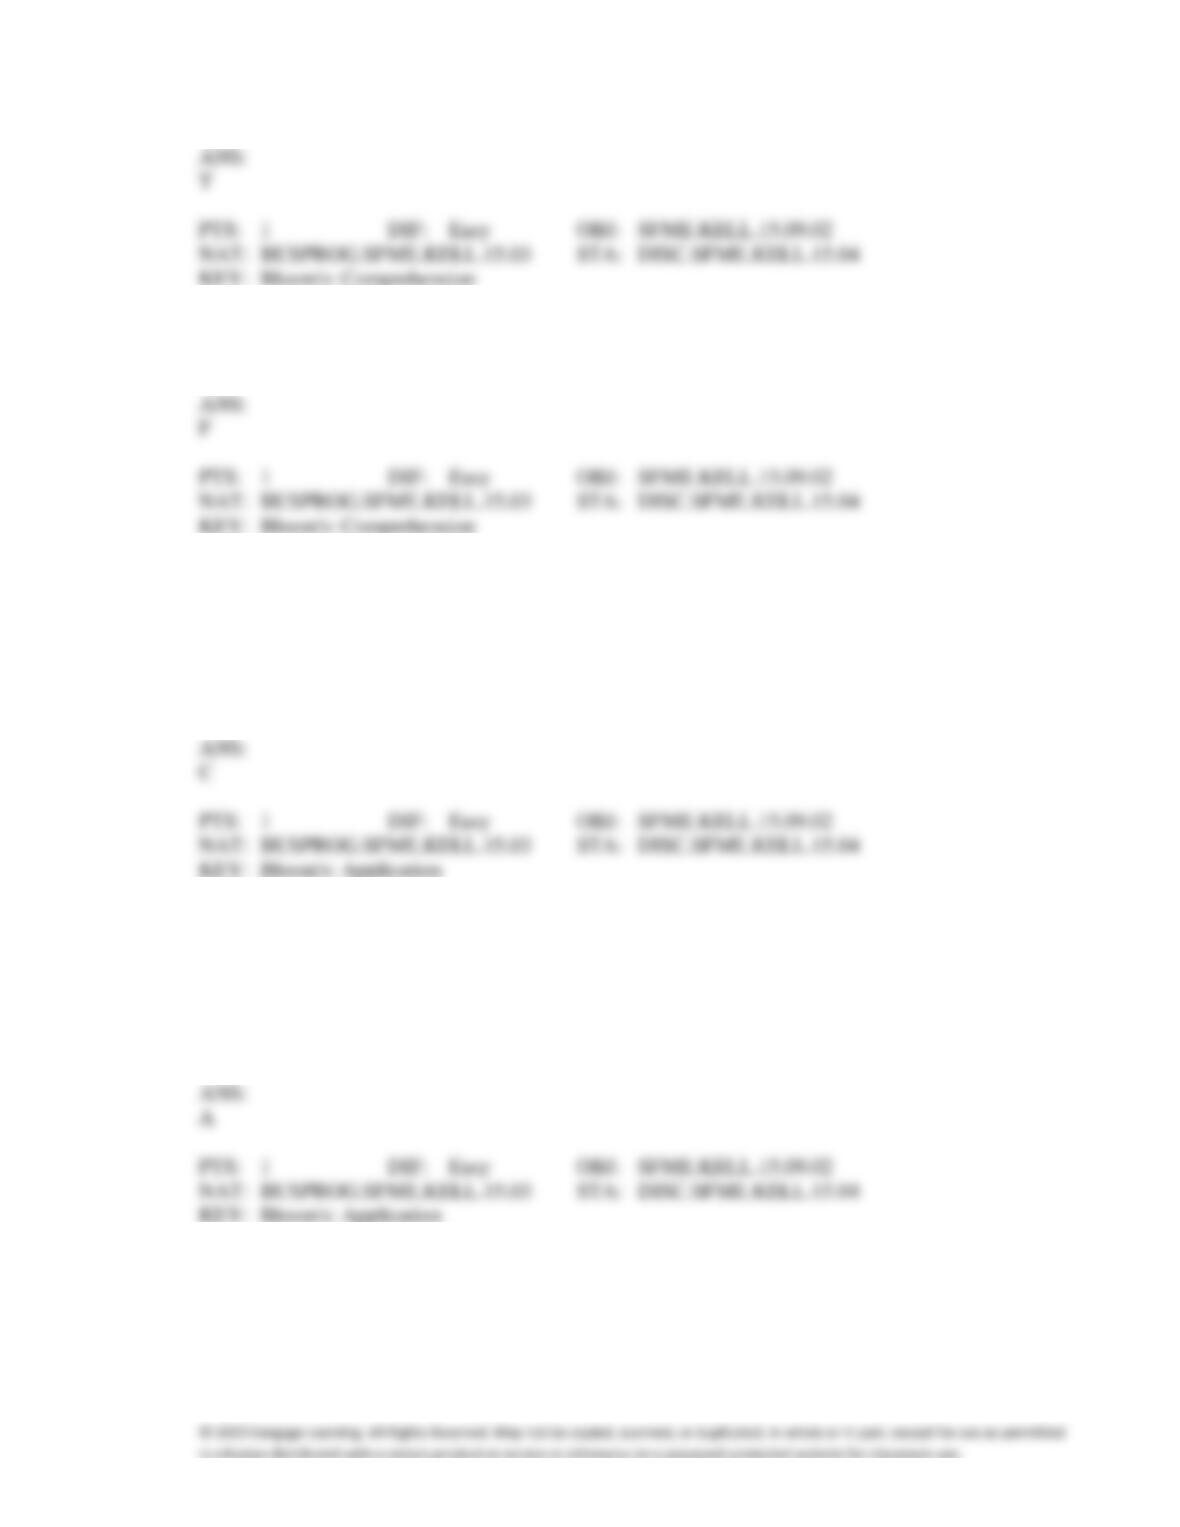
38. In general, the binomial probability P(X x) is approximated by the area under the normal curve to the
left of x + .5.
39. In general, the binomial probability P(X x) is approximated by the area under the normal curve to the
left of x − .5.
40. Given that X is a binomial random variable with very large n, the binomial probability P(X = 5) is
approximated by the area under a normal curve between
a.
5 and 5
b.
4 and 6
c.
4.5 and 5.5
d.
None of these choices.
41. Given that X is a binomial random variable with very large n, the binomial probability P(X 5) is
approximated by the area under a normal curve to the right of
a.
4.5
b.
5.5
c.
4
d.
6
42. Given that X is a binomial random variable with very large n, the binomial probability P(X 5) is
approximated by the area under a normal curve to the left of
a.
5
b.
−5
c.
5.5
d.
4.5
43. As a general rule, the normal distribution is used to approximate the sampling distribution of the
sample proportion only if:
a.
the sample size n is greater than 30.
b.
the population proportion p is close to 0.50.
c.
the underlying population is normal.
d.
np and n(1 − p) are both greater than or equal to 5.
44. Given a binomial distribution with n trials and probability p of a success on any trial, a conventional
rule of thumb is that the normal distribution will provide an adequate approximation of the binomial
distribution if
a.
np 5 and n(1 − p) 5
b.
np 5 and np(1 − p) 5
c.
np 5 and n(1 − p) 5
d.
None of these choices.
45. A sample of size 200 is taken at random from an infinite population. Given that the population
proportion is 0.60, the probability that the sample proportion is greater than 0.58 is:
a.
0.281
b.
0.719
c.
0.580
d.
0.762
46. A sample of size 200 is taken at random from an infinite population. Given that the population
proportion is 0.60, the probability that the sample proportion is less than 0.58 is
a.
0.281
b.
0.719
c.
0.580
d.
0.762
47. A sample of size 200 is taken at random from an infinite population. Given that the population
proportion is 0.60, the probability that the sample proportion is between 0.58 and 0.62 is:
a.
0.4380
b.
0.0320
c.
0.0200
d.
None of these choices.
48. Suppose that the probability p of success on any trail of a binomial distribution equals 0.90. Then for
which of the following number of trials, n, would the normal distribution provide a good
approximation to the binomial distribution?
a.
35
b.
45
c.
55
d.
All of these choices are true.
49. A sample of 250 observations is selected at random from an infinite population. Given that the
population proportion is .25, the standard error of the sampling distribution of the sample proportion
is:
a.
0.0274
b.
0.5000
c.
0.0316
d.
0.0548
50. The standard error of the sample proportion gets larger as:
a.
p approaches 0
b.
p approaches 0.50
c.
p approaches 1.00
d.
None of these choices.
51. The standard deviation of is also called the:
a.
standard error of the sample proportion.
b.
standard deviation of the population.
c.
standard deviation of the binomial.
d.
None of these choices.
52. The estimator of the probability of success in a binomial distribution is: ____________________.
53. Under certain conditions where n is large enough, you can approximate the ____________________
distribution using the ____________________ distribution.
54. The continuity correction factor adds and subtracts the number ____________________ to/from x to
find P(X = x).
55. To find the binomial probability P(X 4) we calculate the area under the normal curve to the
____________________ (left/right) of the number ____________________.
56. The expected value of is ____________________.
57. The variance of is ____________________.
58. The standard deviation of is also called the ____________________ of the sample proportion.
59. is approximately normally distributed provided that ____________________ and
____________________ are both greater than or equal to 5.
60. has an approximate normal distribution provided that np and n(1 − p) are both greater than or equal
to ____________________.
61. The normal approximation to the binomial distribution gets better and better as
____________________ increases.
62. The probability of success on any trial of a binomial experiment is 20%. Find the probability that the
proportion of success in a sample of 400 is:
a.
less than 18%.
b.
more than 18%.
c.
between 18% and 22%.
0.1587
b.
0.8413
c.
0.6826
63. Suppose it is known that 60% of radio listeners at a particular college are smokers. A sample of 500
students from the college is selected at random. Approximate the probability that at least 280 of these
students are radio listeners.
KEY: Bloom’s: Application
64. What is the probability that you get more than 200 heads if you flip a coin 400 times?
Barack Obama
Bill Clinton, the former President of the United States, believes that the proportion of voters who will
vote for Barack Obama in the year 2012 presidential elections is 0.65. A sample of 500 voters is
selected at random.
65. {Barack Obama Narrative} Assume that Gore is correct and p = 0.65. What is the sampling
distribution of the sample proportion ? Explain.
66. {Barack Obama Narrative} Find the expected value and the standard deviation of the sample
proportion .
67. {Barack Obama Narrative} What is the probability that the number of voters in the sample who will
vote for Barack Obama in the year 2012 is between 340 and 350?
68. Let X be a binomial random variable with n = 100 and p = 0.7. Approximate the following
probabilities, using the normal distribution.
a.
P(X = 75)
b.
P(X 70)
c.
P(X > 70)
DVD Rental Store
A DVD rental store wants to know what proportion of its customers are under age 21. A simple
random sample of 500 customers was taken, and 375 of them were under age 21. Presume that the true
population proportion of customers under age 21 is 0.68.
69. {DVD Rental Store Narrative} Describe the shape of the sampling distribution of proportion of
customers who are under age 21.
70. {DVD Rental Store Narrative} Find the mean and standard deviation of .
71. {DVD Rental Store Narrative} What is the probability that the sample proportion is within 0.03 of
the true proportion of customers who are under age 21?
72. Given a binomial random variable with n = 15 and p = .40, find the exact probabilities of the following
events and their normal approximations.
a.
X = 6
b.
X 9
c.
X 10
Graduate Internships
The chairman of the Biology department in a certain college believes that 70% of the department’s
graduate internships are given to international students. A random sample of 50 graduate interns is
taken.
73. {Graduate Internships Narrative} Assume that the chairman is correct and p = 0.70. What is the
sampling distribution of the sample proportion ? Explain.
74. {Graduate Internships Narrative} Find the expected value and the standard error of the sampling
distribution of .
75. {Graduate Internships Narrative} What is the probability that the sample proportion is between 0.65
and 0.73?
76. {Graduate Internships Narrative} What is the probability that the sample proportion is within .05
of the population proportion p?
77. The expected value of the sampling distribution of is where
i is the mean
of population i (i = 1, 2).
78. The standard error of the difference between sample means, , is calculated by the formula
where is the variance of population i (i = 1, 2).
79. The mean of the difference is equal to the mean of the difference .
80. The standard error of the difference is equal to the standard error of the difference .
81. If two random samples of size 36 each are selected independently from two populations with variances
25 and 16, then the standard error of the sampling distribution of the sample mean difference, ,
is 5 − 4 = 1.
82. If two random samples of sizes 30 and 32 are selected independently from two populations with means
121 and 109, then the mean of the sampling distribution of the sample mean difference, ,
equals 12.
83. If two samples are selected independently from two non-normal populations, then the sampling
distribution of is only approximately normal provided that either n1 or n2 is 30 or more.
84. The standard deviation of is also called the:
a.
standard error of the difference between two sample means.
b.
standard deviation of the difference between the population means.
c.
normal approximation to the difference of two binomial random variables.
d.
None of these choices.
85. If two populations are normally distributed, the sampling distribution of the difference in the sample
means, , is:
a.
approximately normal for any sample sizes.
b.
approximately normal if both sample sizes are large.
c.
exactly normal only if both sample sizes are large.
d.
exactly normal for any sample sizes.
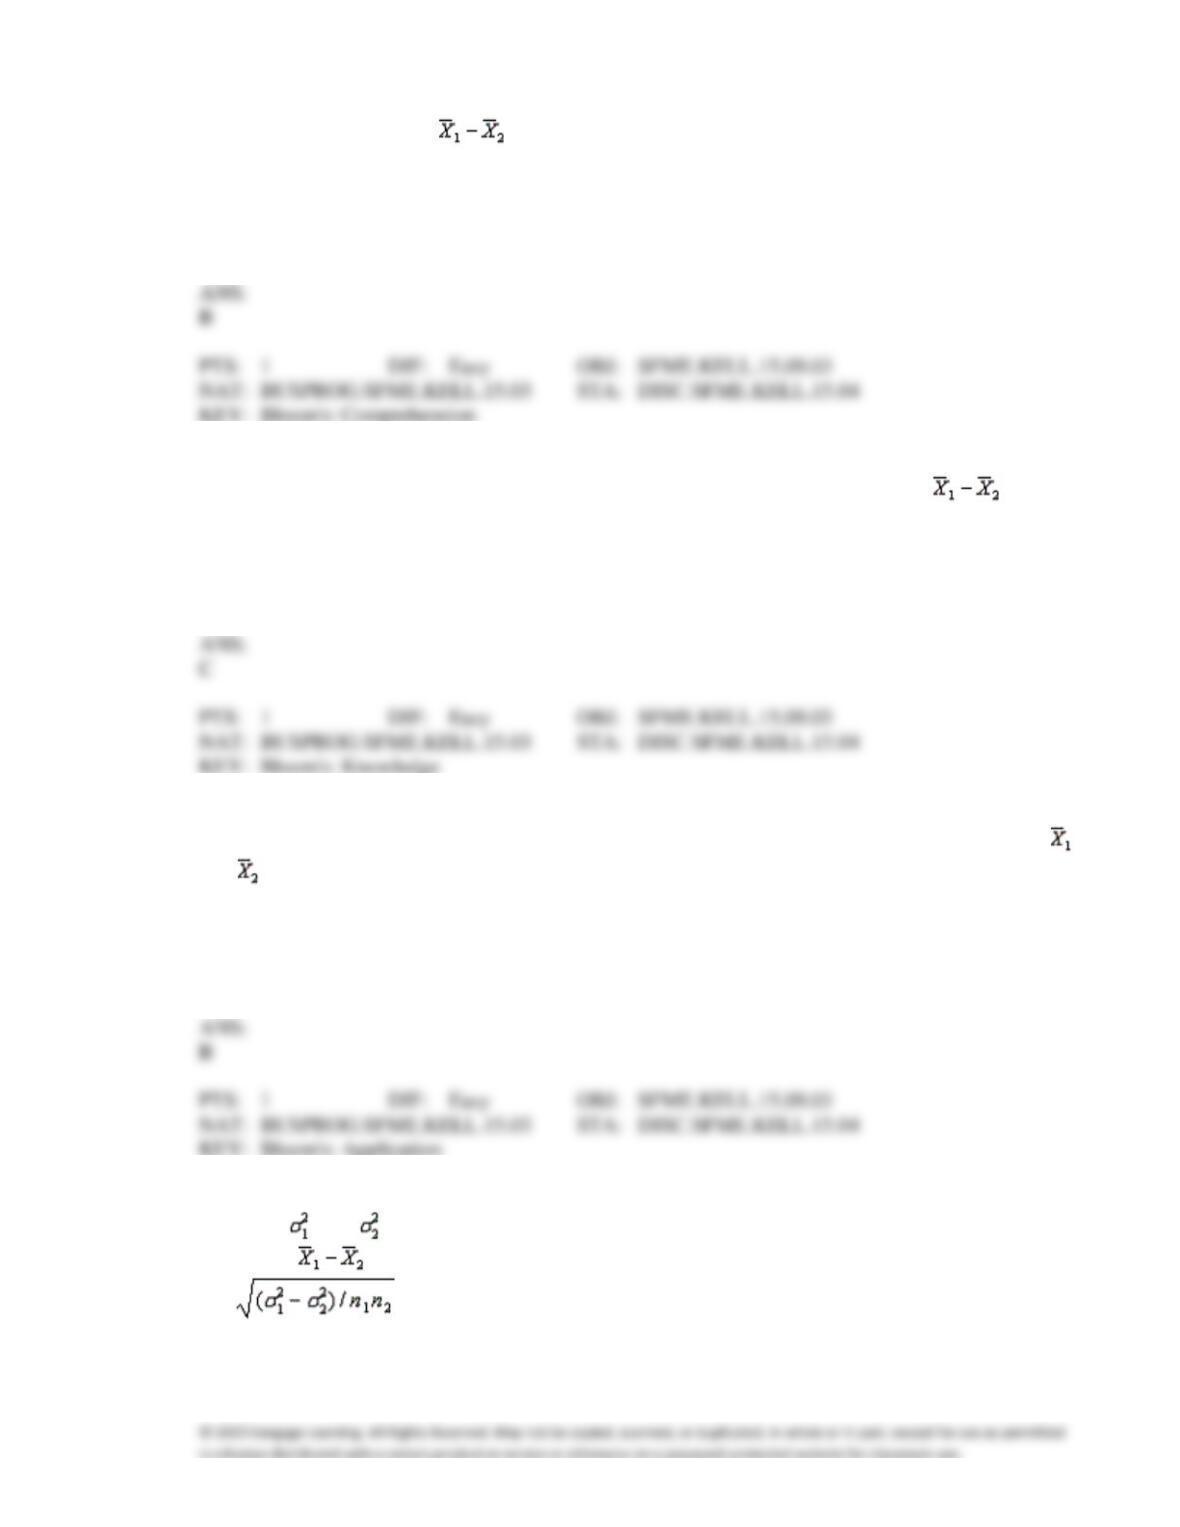
86. If two random samples of sizes n1 and n2 are selected independently from two populations with means
1 and
2, then the mean of equals:
a.
1 +
2
b.
1 −
2
c.
1 /
2
d.
1
2
87. If two random samples of sizes n1 and n2 are selected independently from two non-normally
distributed populations, then the sampling distribution of the sample mean difference, , is
a.
always non-normal
b.
always normal
c.
approximately normal only if n1 and n2 are both larger than or equal to 30
d.
approximately normal regardless of n1 and n2
88. If two random samples of sizes 30 and 36 are selected independently from two populations with means
78 and 85, and standard deviations 12 and 15, respectively, then the standard error of the difference
and is equal to:
a.
0.904
b.
3.324
c.
3.391
d.
0.833
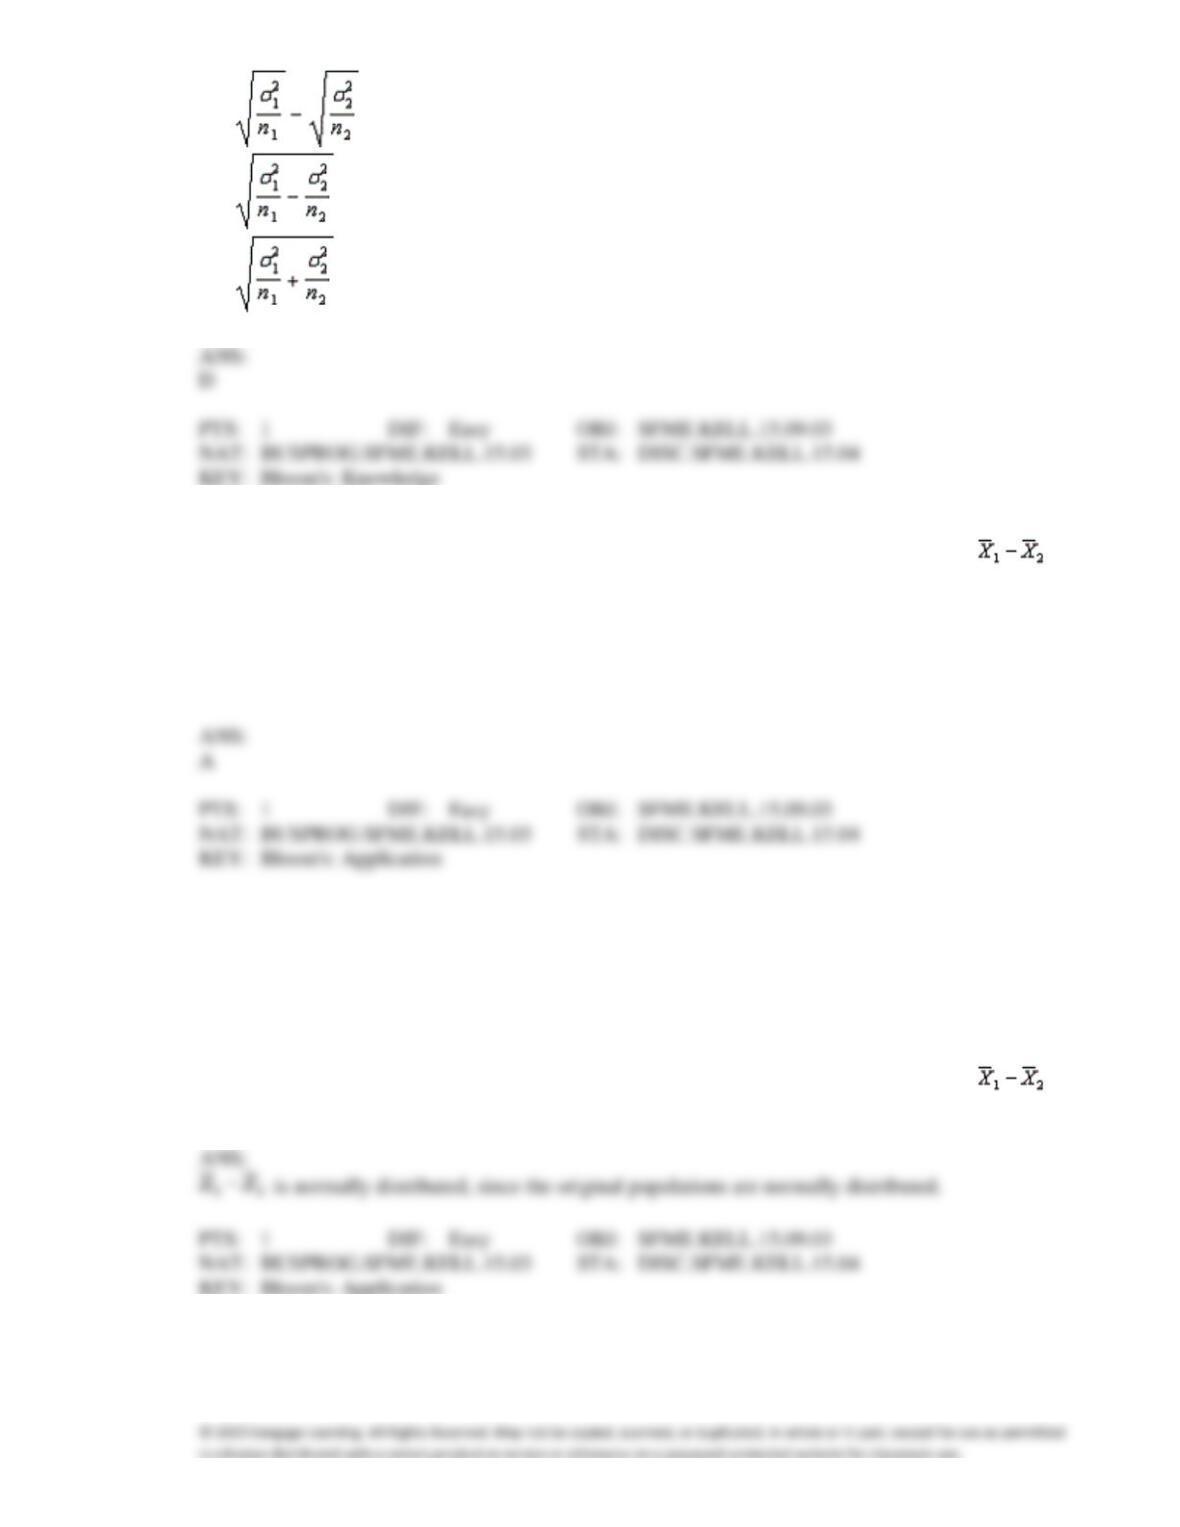
89. If two random samples of sizes n1 and n2 are selected independently from two populations with
variances and , then the standard error of the sampling distribution of the sample mean
difference, , equals:
a.
b.
c.
d.
90. If two random samples of sizes 30 and 36 are selected independently from two populations with means
78 and 85, and standard deviations 12 and 15, respectively, then the mean of the difference is
equal to:
a.
−7
b.
7
c.
(78 − 85) / (30 − 36) = 1.17
d.
78/30 − 85/36 = 0.24
CFO’s Salary
Suppose that the starting salaries of female CFO’s have a positively skewed distribution with mean of
$56,000 and a standard deviation of $12,000. The starting salaries of male CFO’s are positively
skewed with a mean of $50,000 and a standard deviation of $10,000. A random sample of 50 female
CFO’s and a random sample of 40 male CFO’s are selected.
91. {CFO’s Salary Narrative} What is the sampling distribution of the sample mean difference ?
Explain.
92. {CFO’s Salary Narrative} Find the expected value of the sample mean difference.
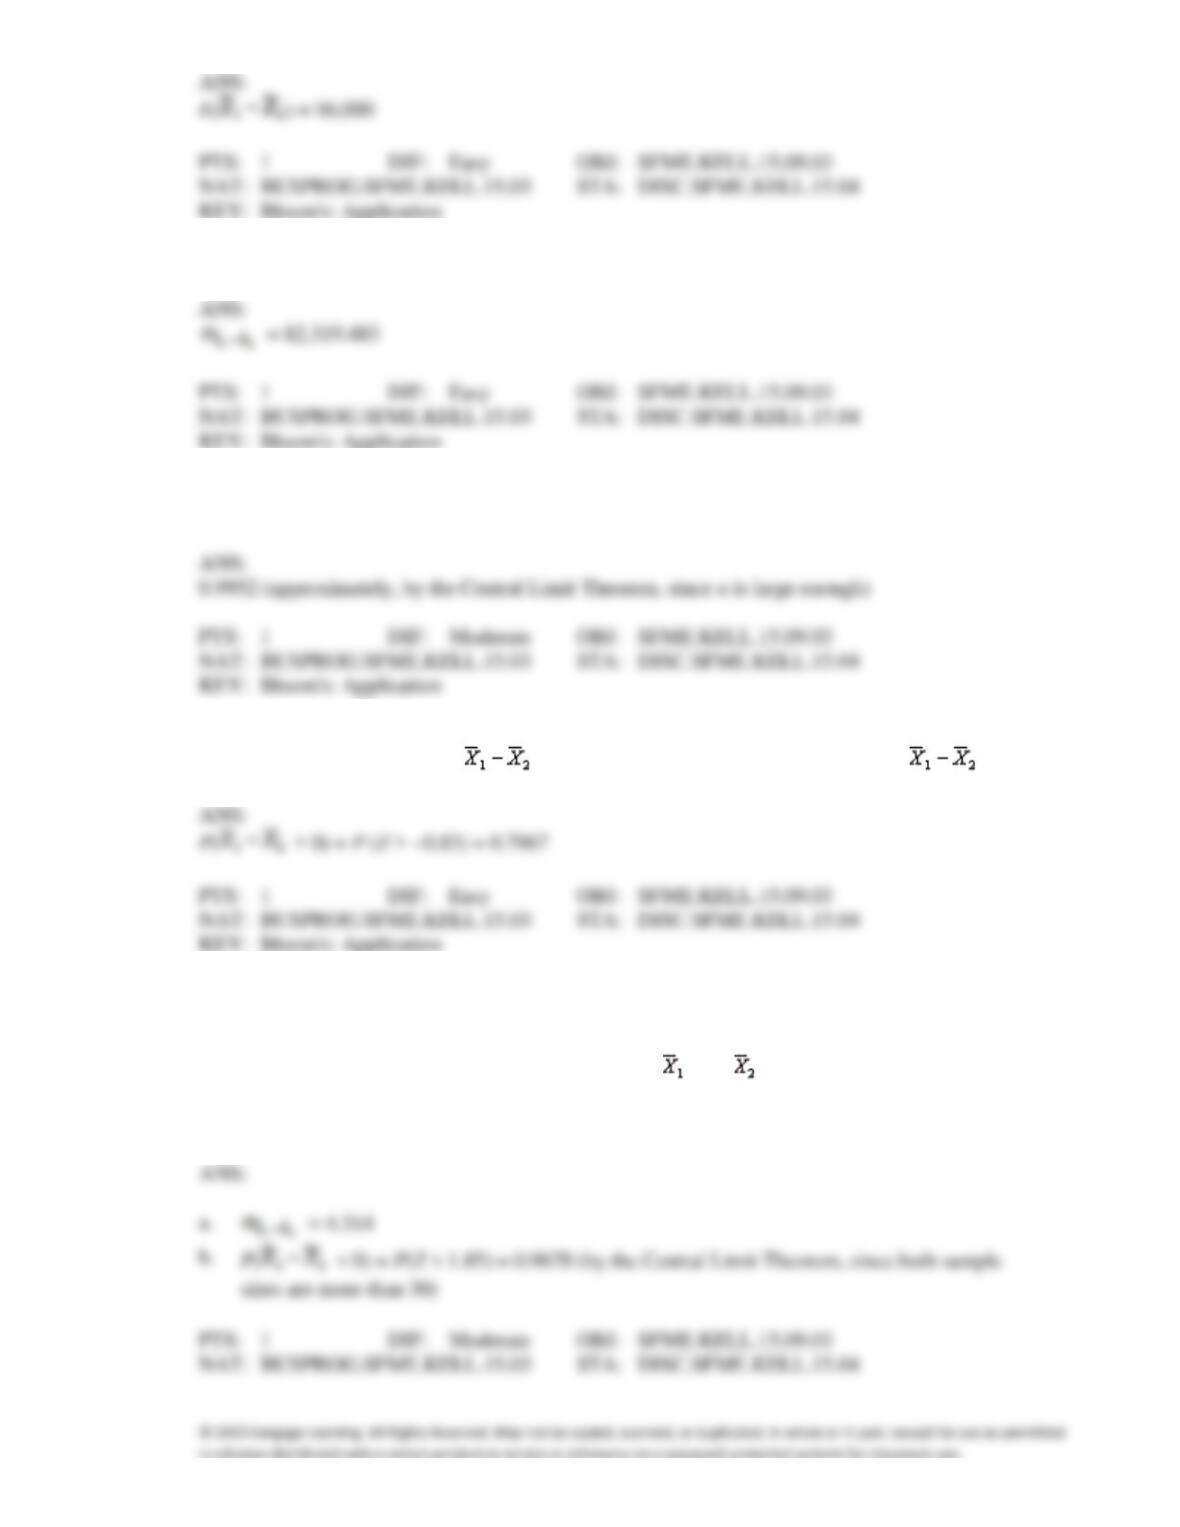
93. {CFO’s Salary Narrative} Find the standard error of the sample mean difference.
94. {CFO’s Salary Narrative} What is the probability that the sample mean salary of male CFO’s will not
exceed that of the female CFO’s?
95. Two samples are selected independently from two normal populations and the mean and standard error
of the sampling distribution of are 32 and 38.72, respectively. Calculate P( > 0).
96. Two random samples of sizes 30 and 36 are selected independently from two populations with means
80 and 88, and standard deviations 15 and 20, respectively.
a.
Find the standard error of the difference between and .
b.
Find the probability that the mean of the first sample is smaller than the mean of the
second sample.
Temporary Worker Productivity
A temporary worker productivity is normally distributed. One worker produces an average of 84 units
per day with a standard deviation of 24. Another worker produces at an average rate of 74 per day with
a standard deviation of 25.
97. {Temporary Worker Productivity Narrative} What is the probability that in any single day worker 1
will outproduce worker 2?
98. {Temporary Worker Productivity Narrative} What is the probability that during one week (5 working
days), worker 1 will outproduce worker 2 on average?