1
2
3
4
A B C D
Spearman Rank Correlation
Satisfied and Severity
Spearman Rank Correlation -0.2604
b
S0 :H
= 0
S1 :H
< 0
4
Spearman Rank Correlation -0.3846
1
2
3
A B C D
Spearman Rank Correlation
Satisfied and Days
A19.22 Chi-squared test of a contingency table
:H0
The two variables are independent
:H1
The two variables are dependent
1
2
3
4
5
A B C D E
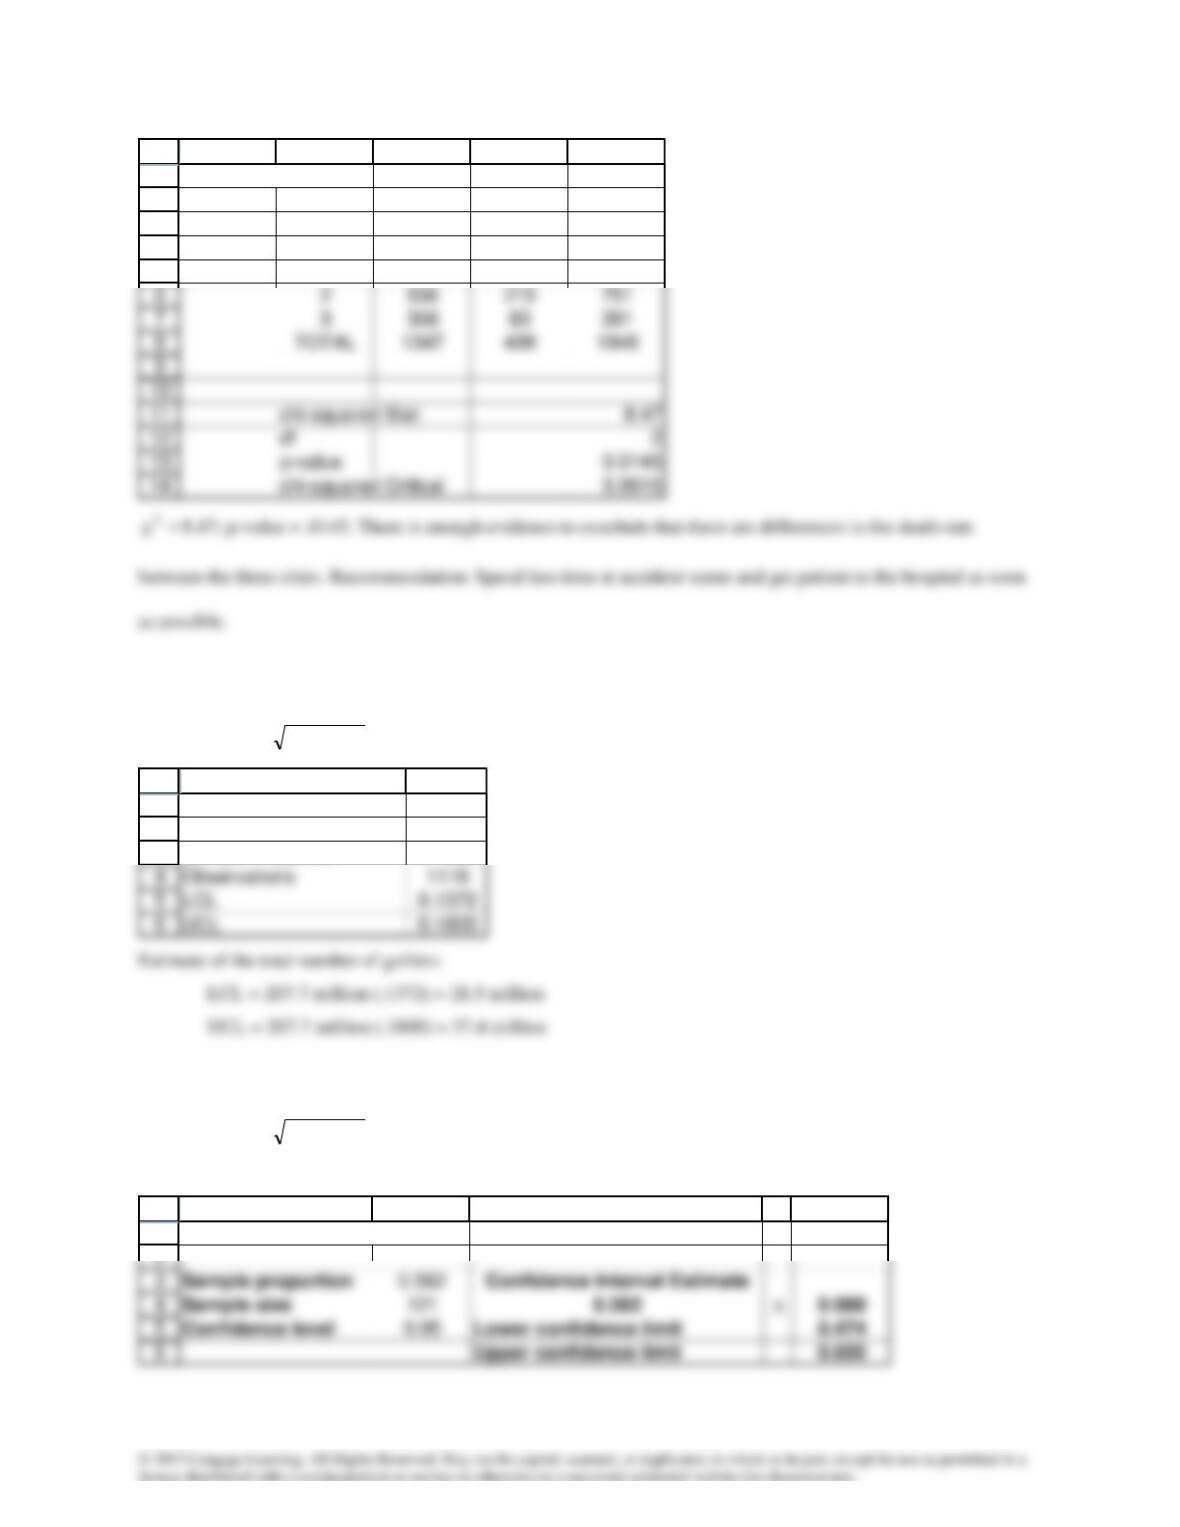
Contingency Table
City
Outcome 1 2 TOTAL
1503 201 704
A19.23 a z-estimator of p
n/)p
ˆ
1(p
ˆ
zp
ˆ2/ −
1
2
3
A B
z-Estimate: Proportion
Golfer?
Sample Proportion 0.1586
b. z-estimator of p
n/)p
ˆ
1(p
ˆ
zp
ˆ2/ −
There were 53 people in the highest income category who did not play golf and 68 who did.
Sample proportion 0.562 Confidence Interval Estimate
Sample size 121 0.562 ±0.088
1
A B C D E
z-Estimate of a Proportion
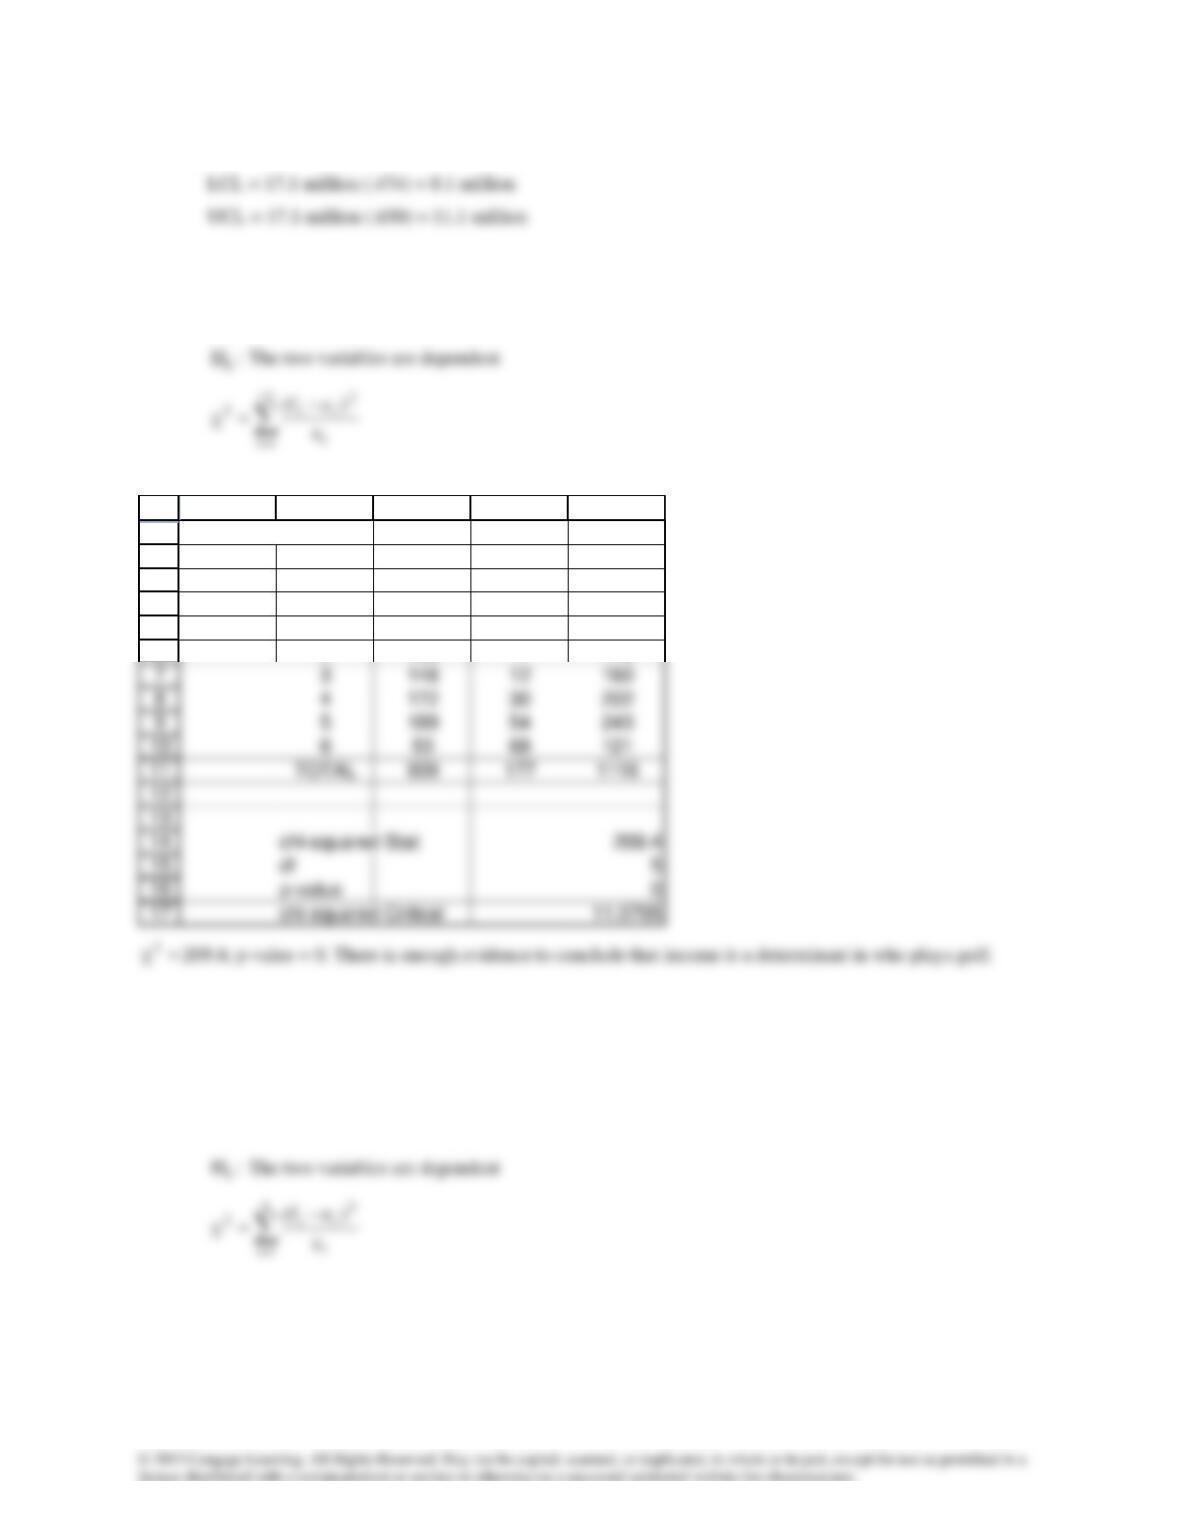
Estimate of the number of golfers who earn at least $75,000:
c Chi-squared test of a contingency table
:H0
The two variables are independent
1
2
3
4
5
6
A B C D E
Contingency Table
Income
Golfer? 1 2 TOTAL
1208 6214
2169 7176
A19.24 Chi-squared test of a contingency table
:H0
The two variables are independent
1
2
3
4
5
6
A B C D E
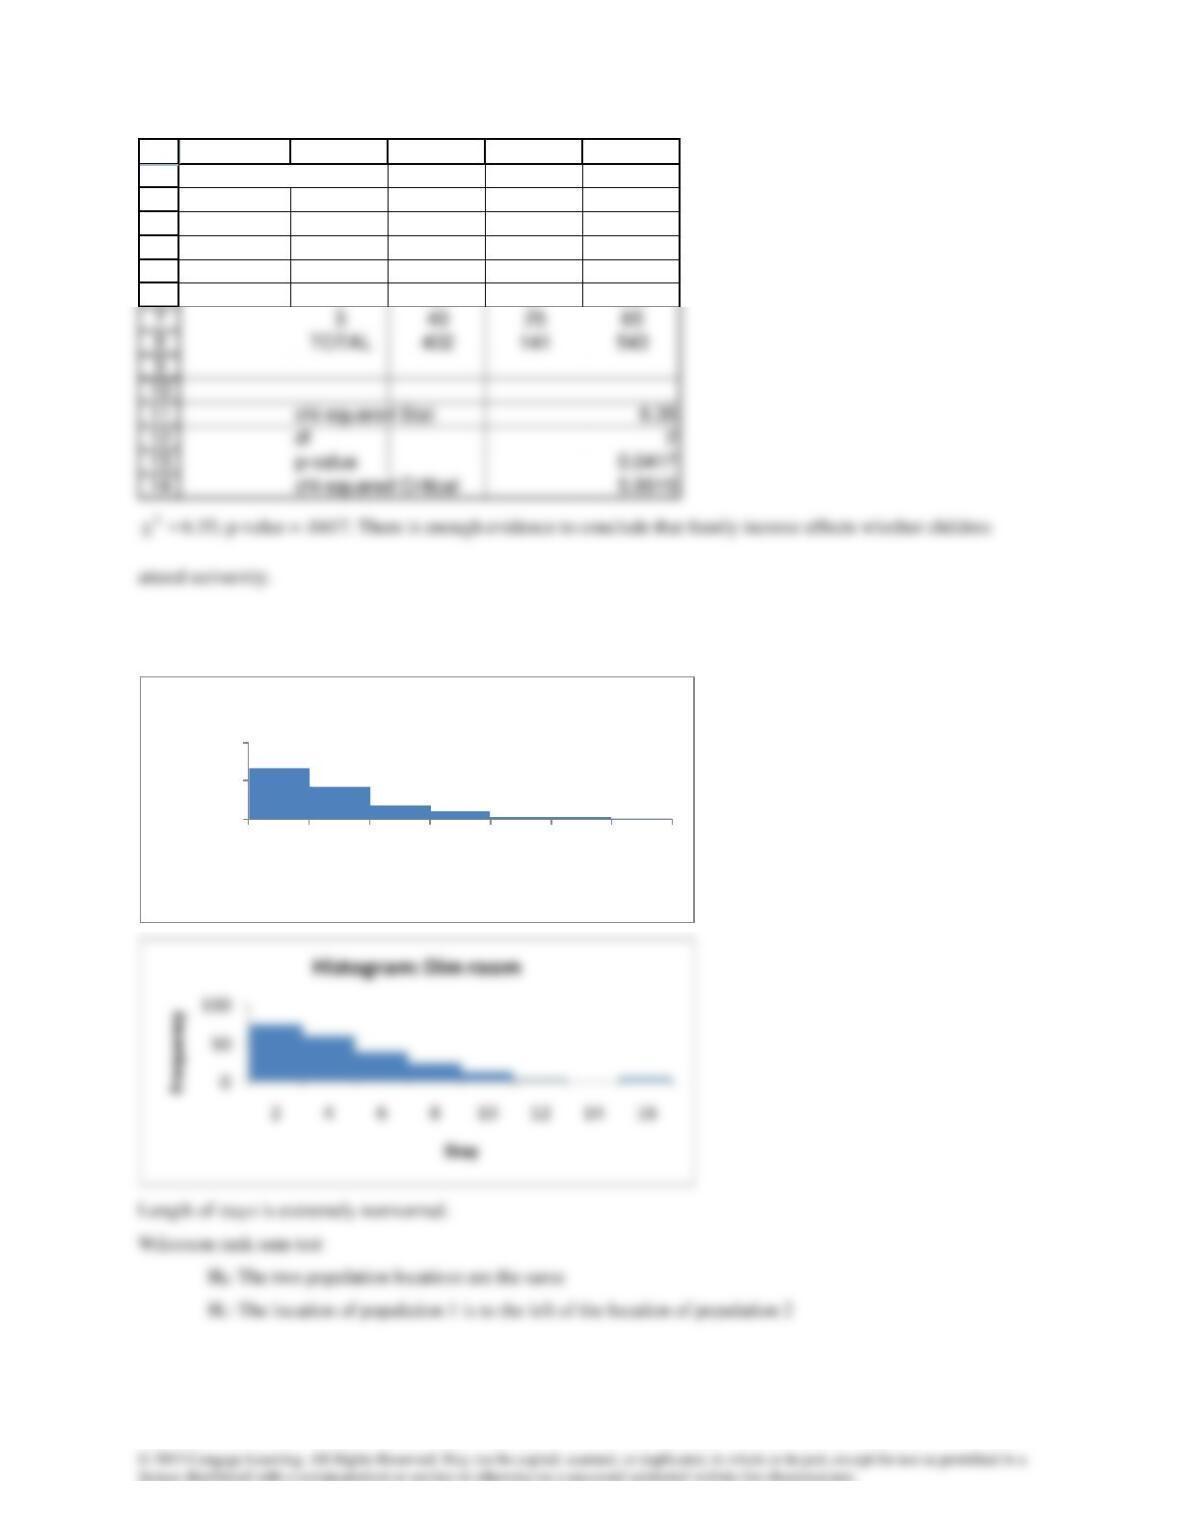
Contingency Table
Income
University? 1 2 TOTAL
1101 29 130
2261 87 348
A19.25a Histograms of stays
0
50
100
2
4
6
8
10
12
14
Frequency
Stay
Histogram:Sunny room
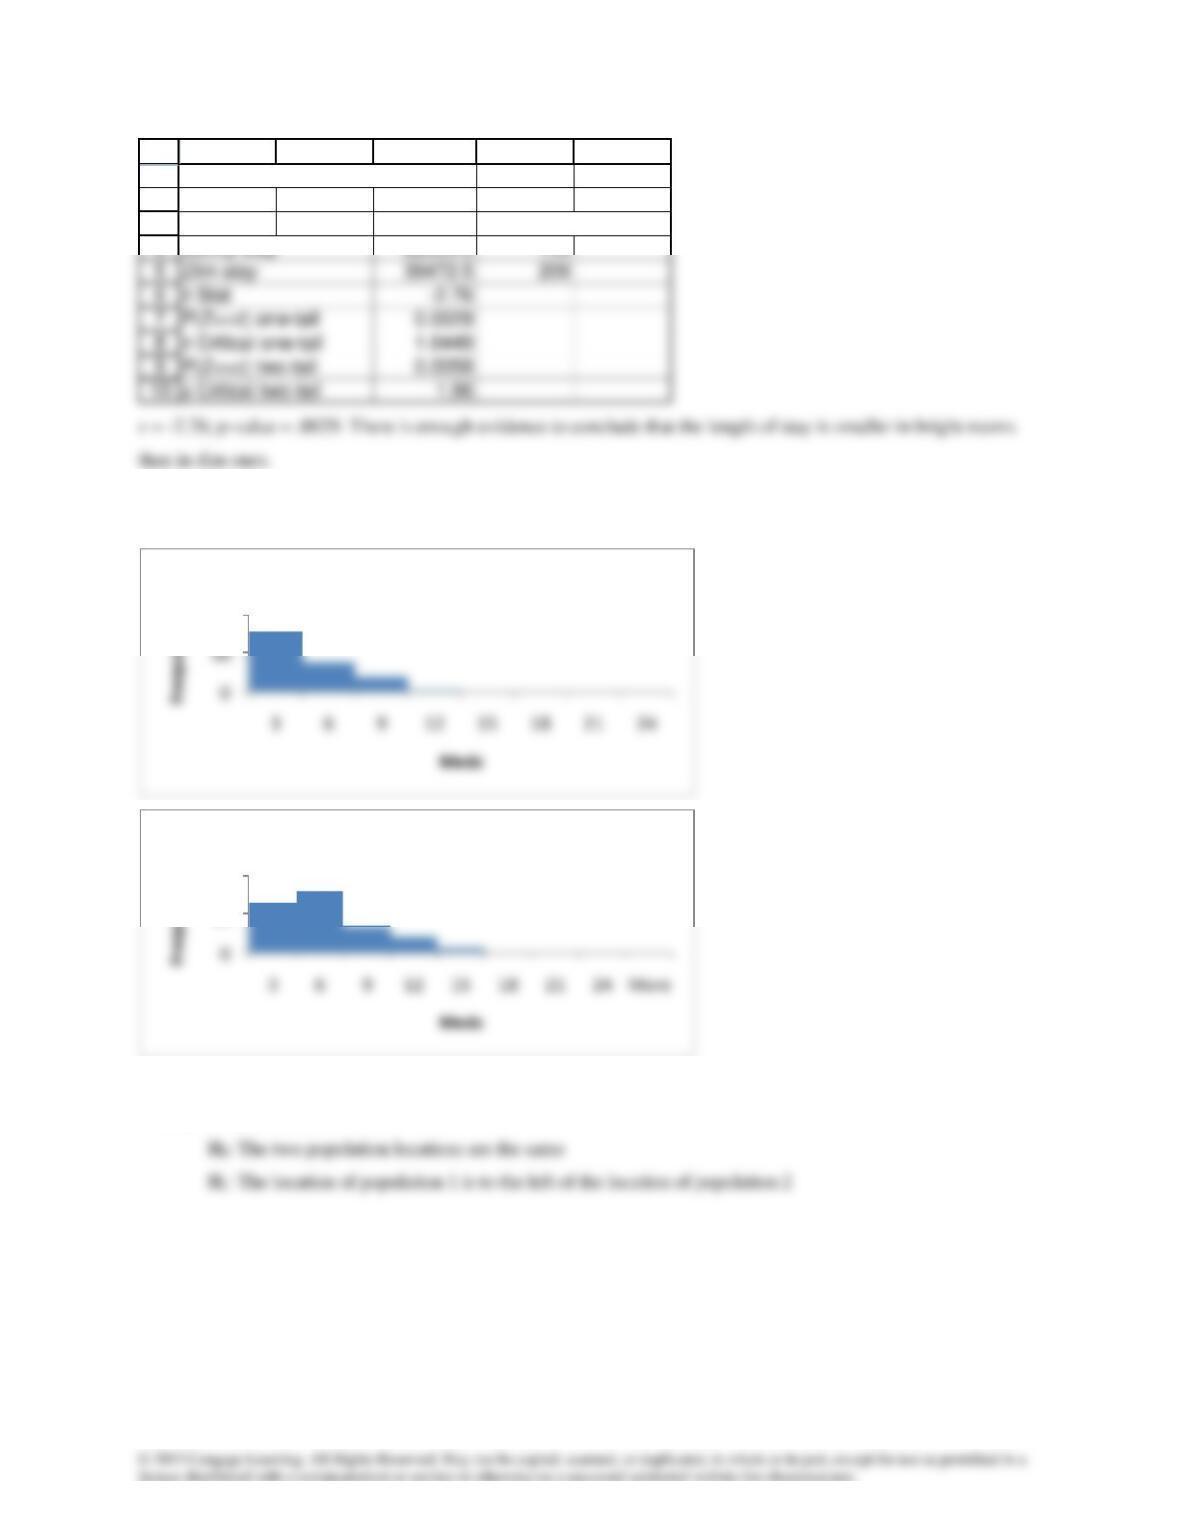
1
2
3
4
A B C D E
Wilcoxon Rank Sum Test
Rank Sum Observations
Sunny stay 22655.5 143
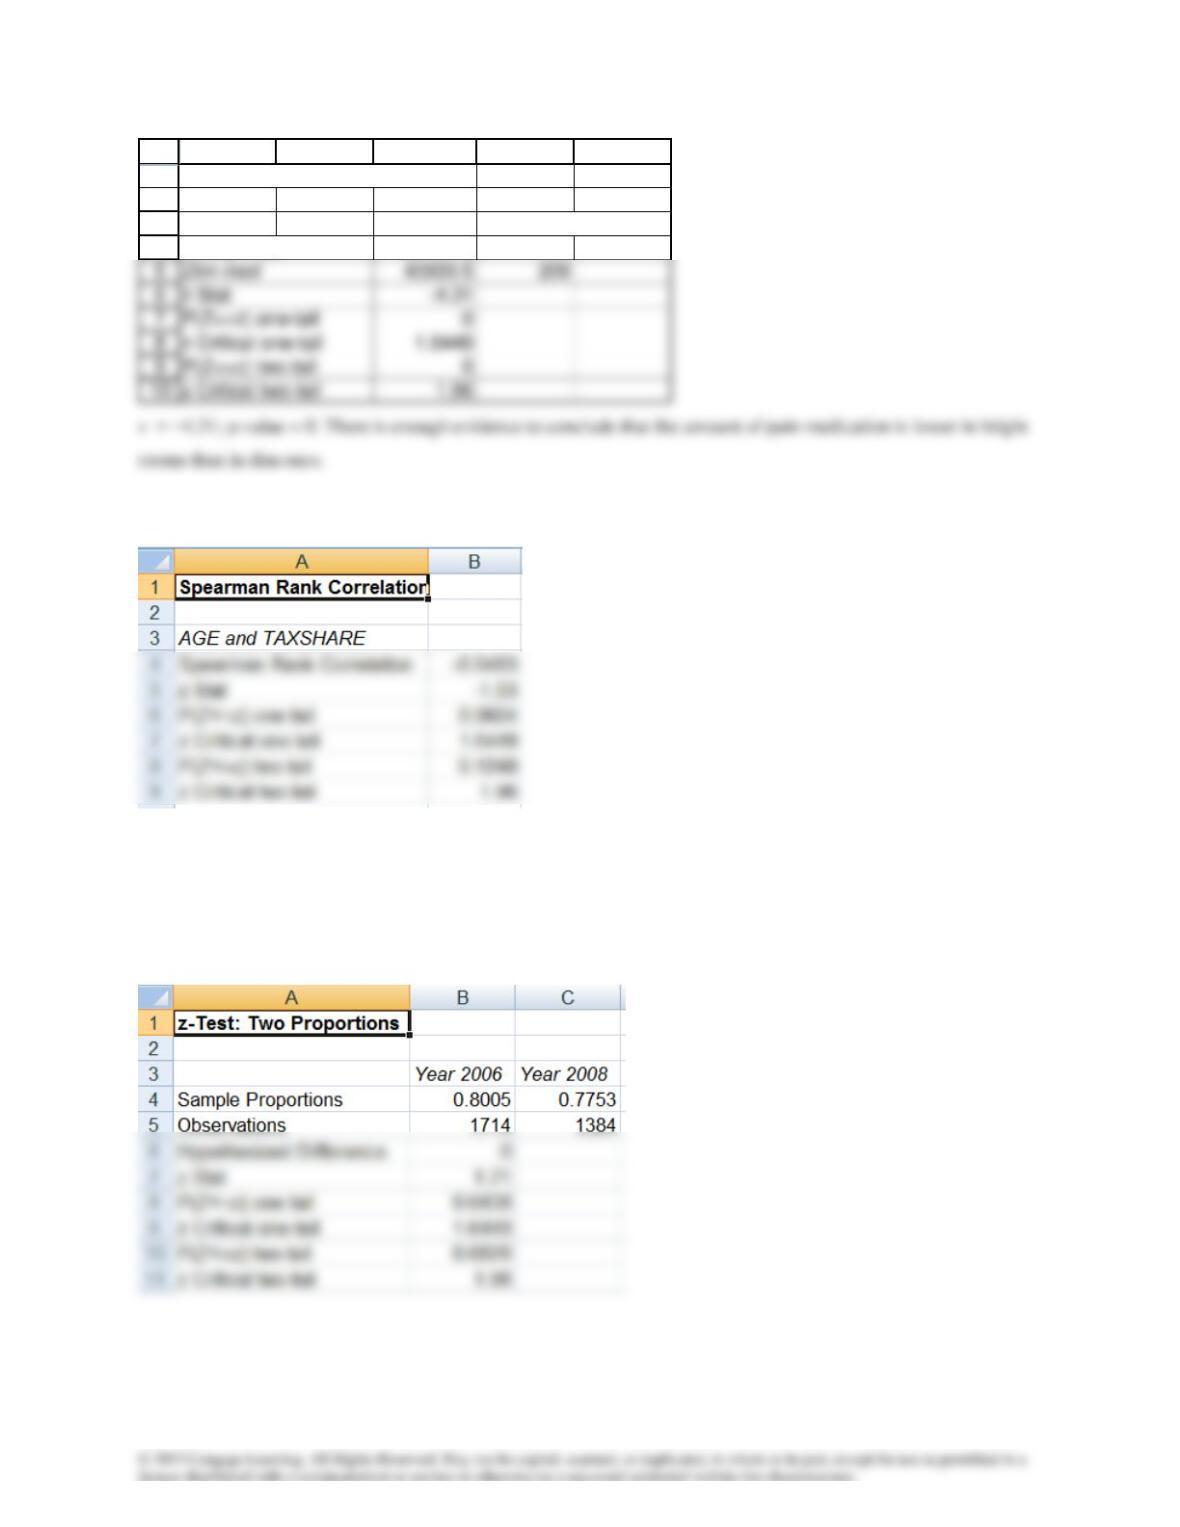
Histograms of amounts of pain medication
100
Histogram: Sunny room
50
100
Histogram:Dim room
b. Amount of pain medication is extremely nonnormal.
Wilcoxon rank sum test
1
2
3
4
A B C D E
Wilcoxon Rank Sum Test
Rank Sum Observations
Sunny med 21197.5 143
A19.26
A19.27
A19.28
A19.29
A19.30
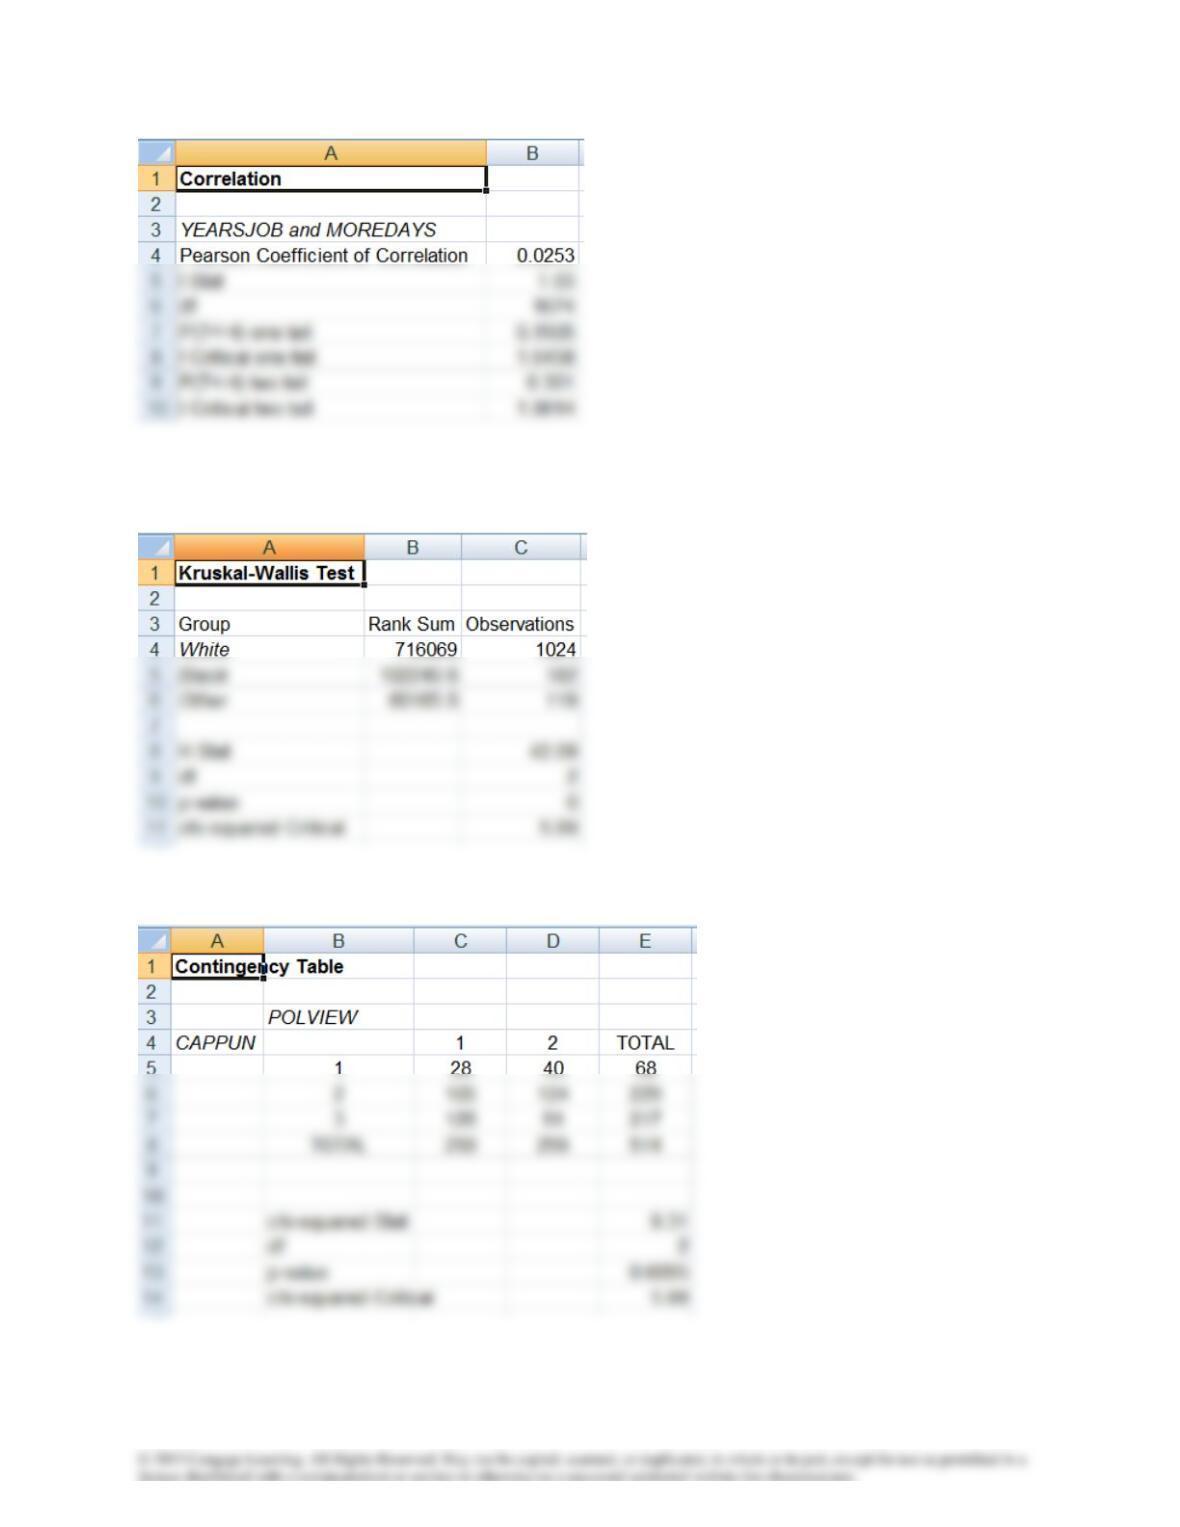
Histograms reveal that CUREMPYR is not normally distributed. The appropriate technique is Kruskal-Wallis test.
A19.32
A19.33
A19.34
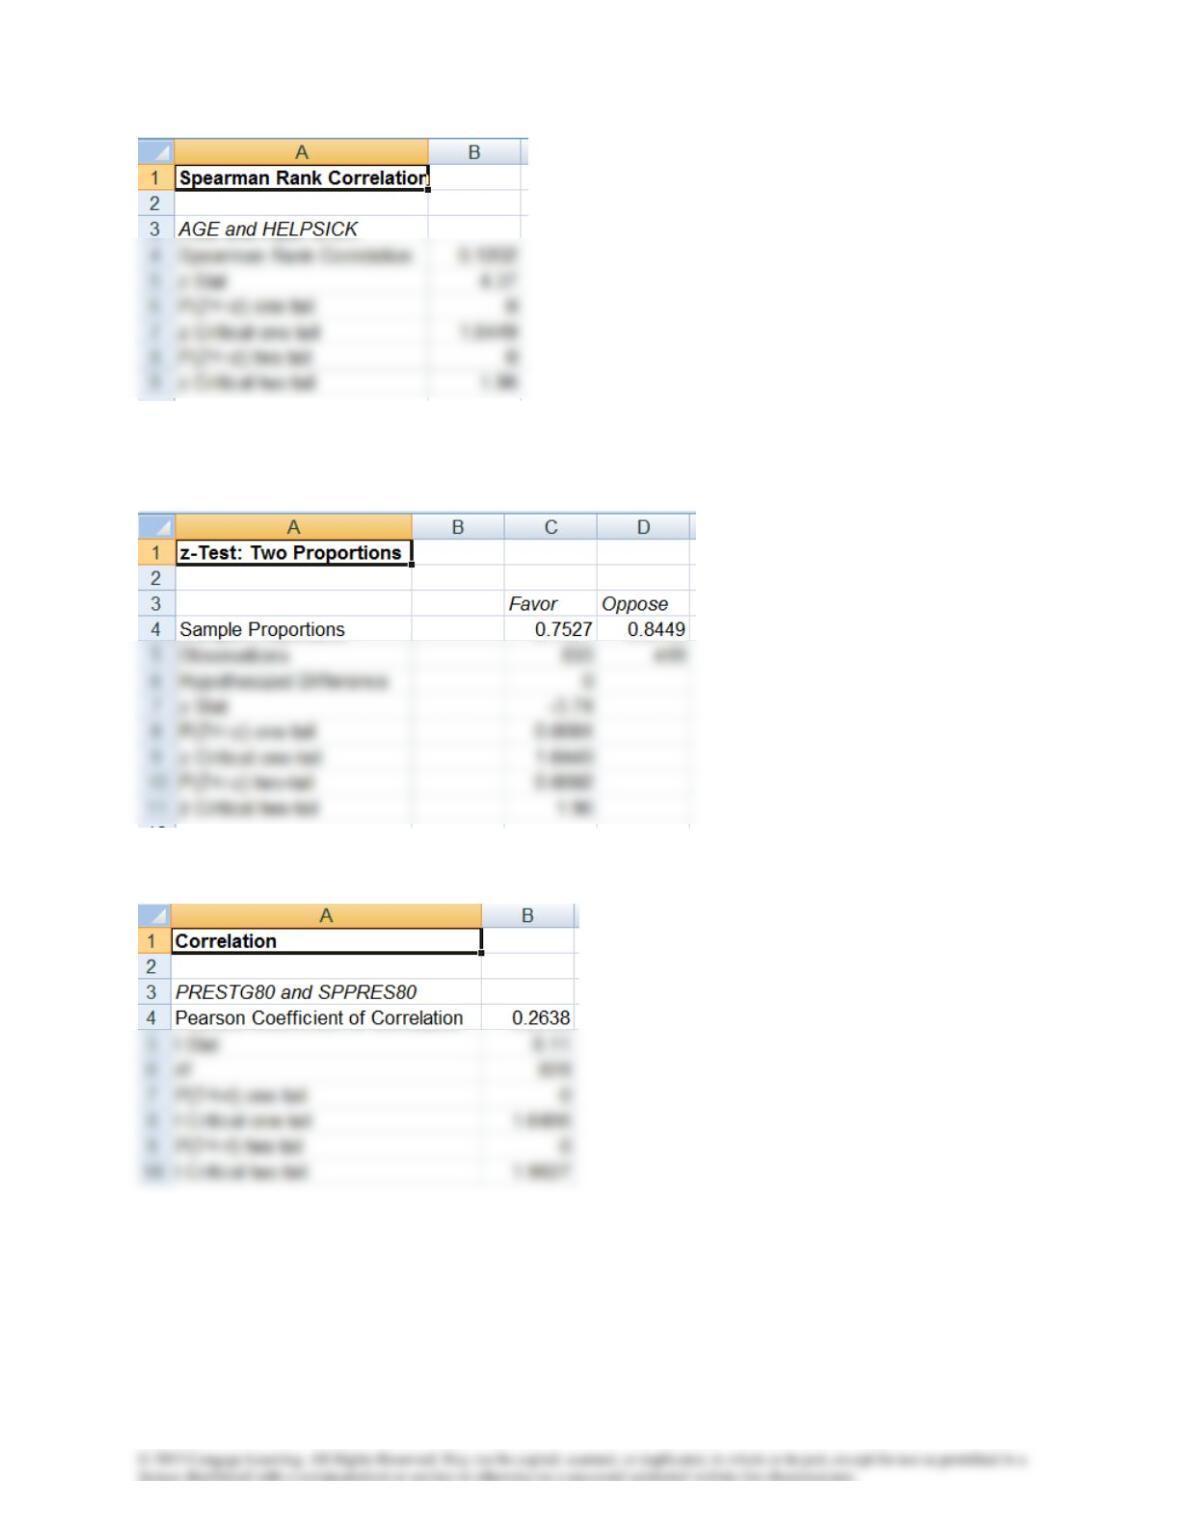
A19.35
A19.36
A19.37 Histograms are approximately bell shaped.
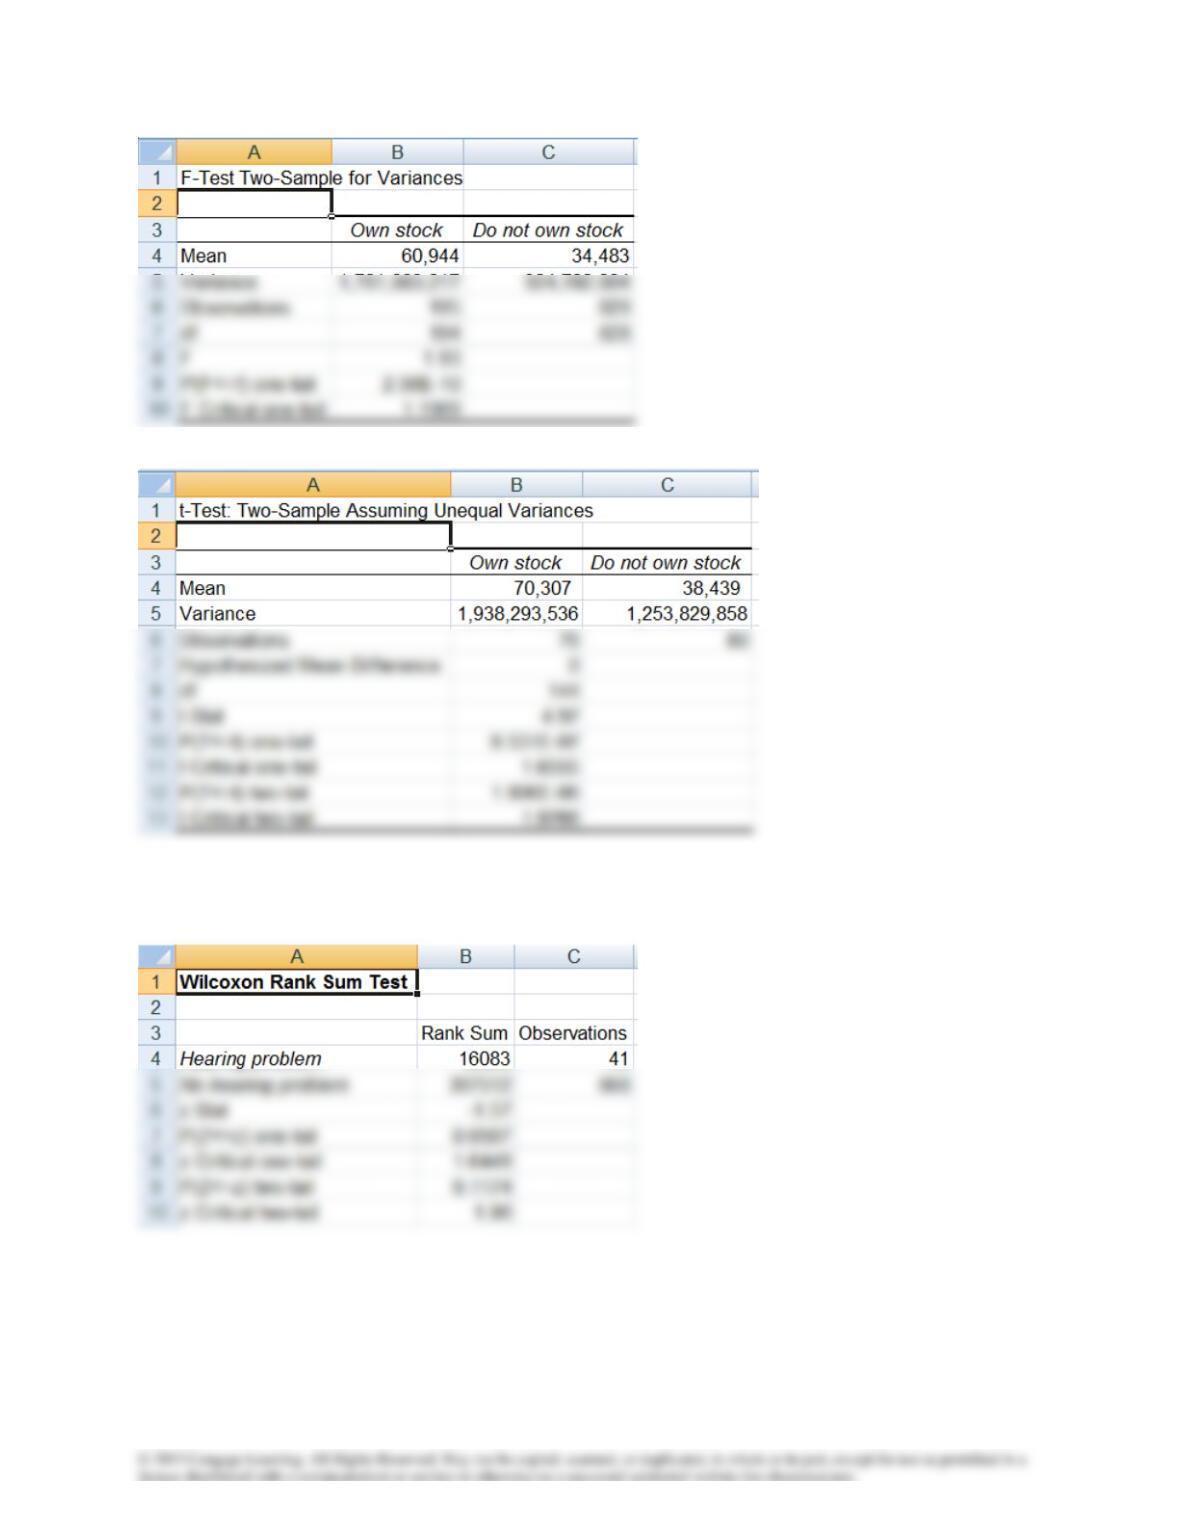
A19.38
A19.39
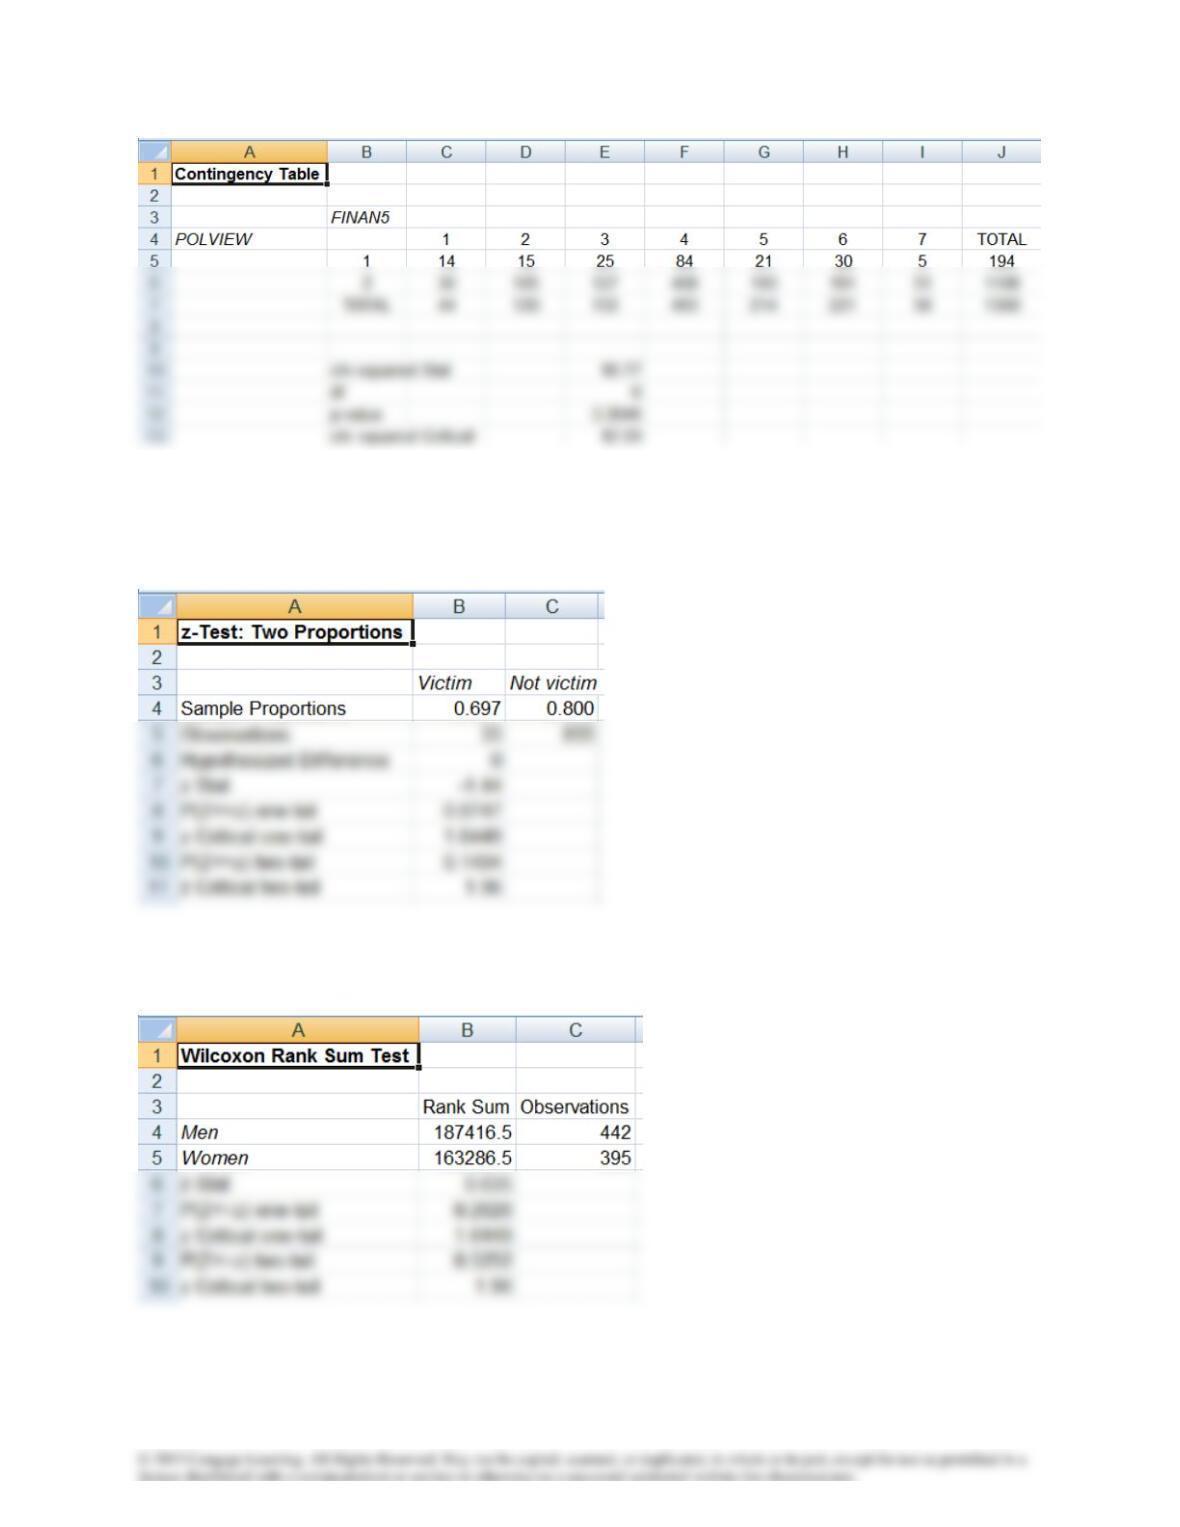
A19.40
A19.41
A19.42
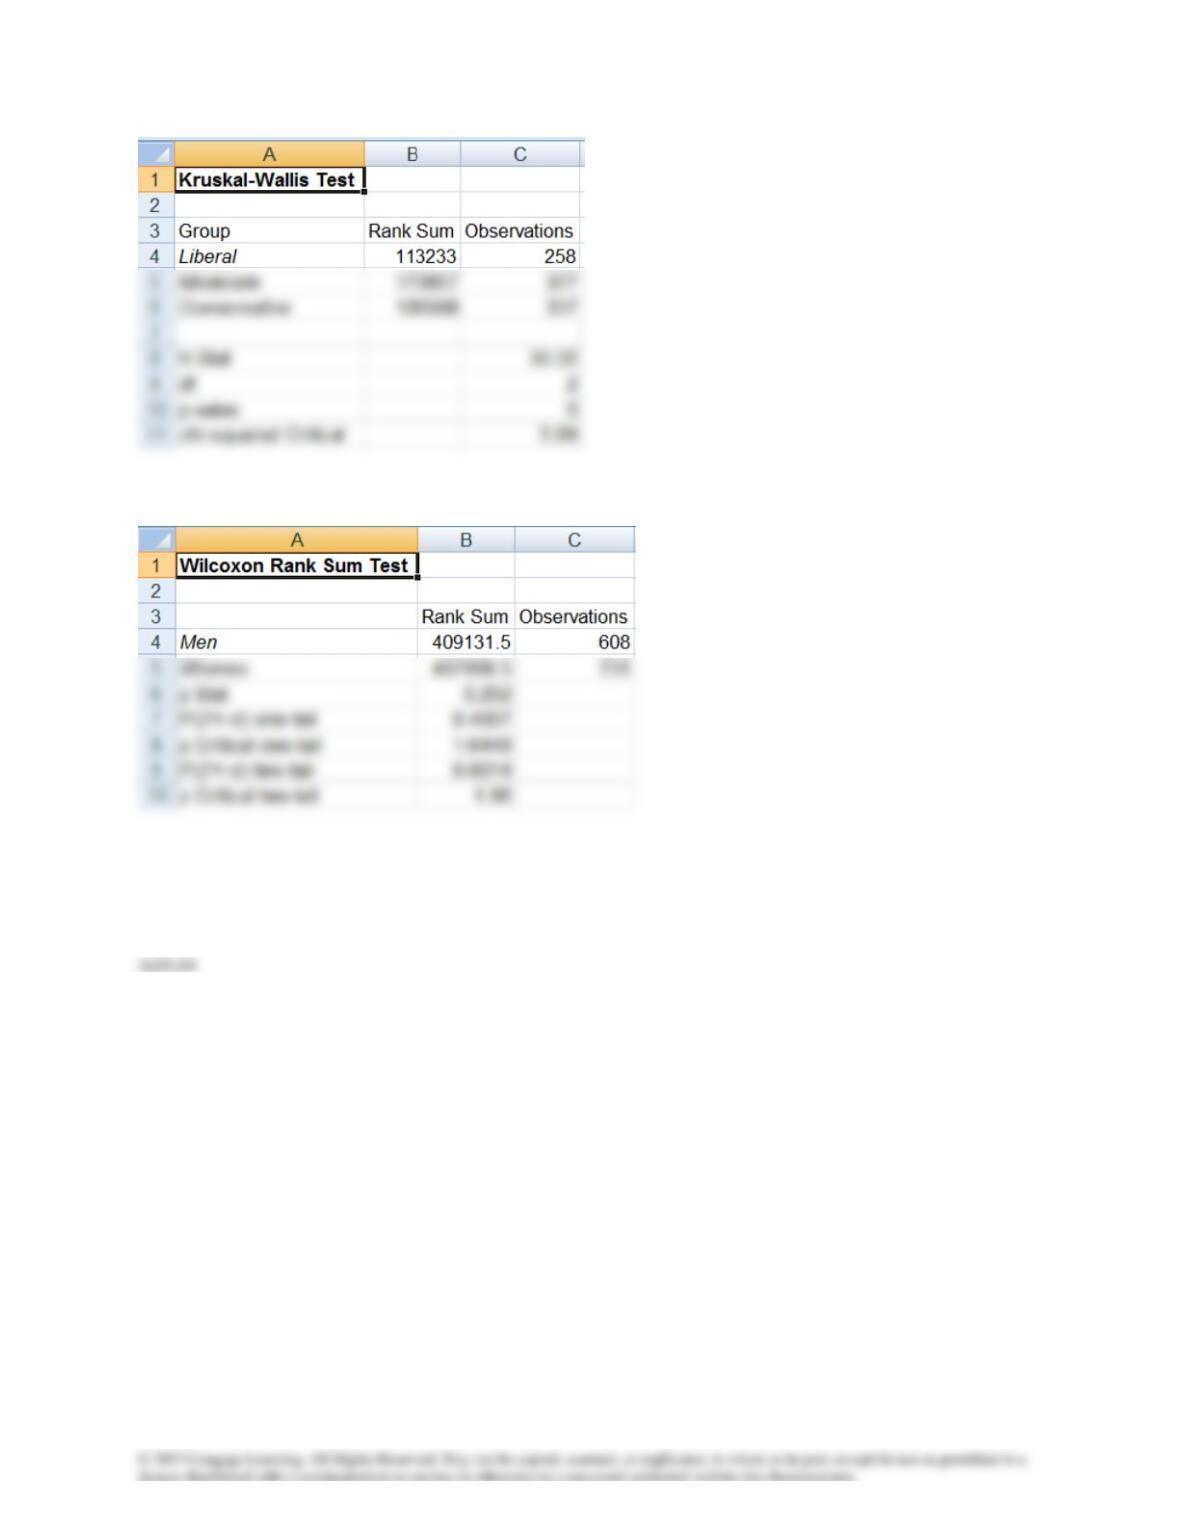
A19.43
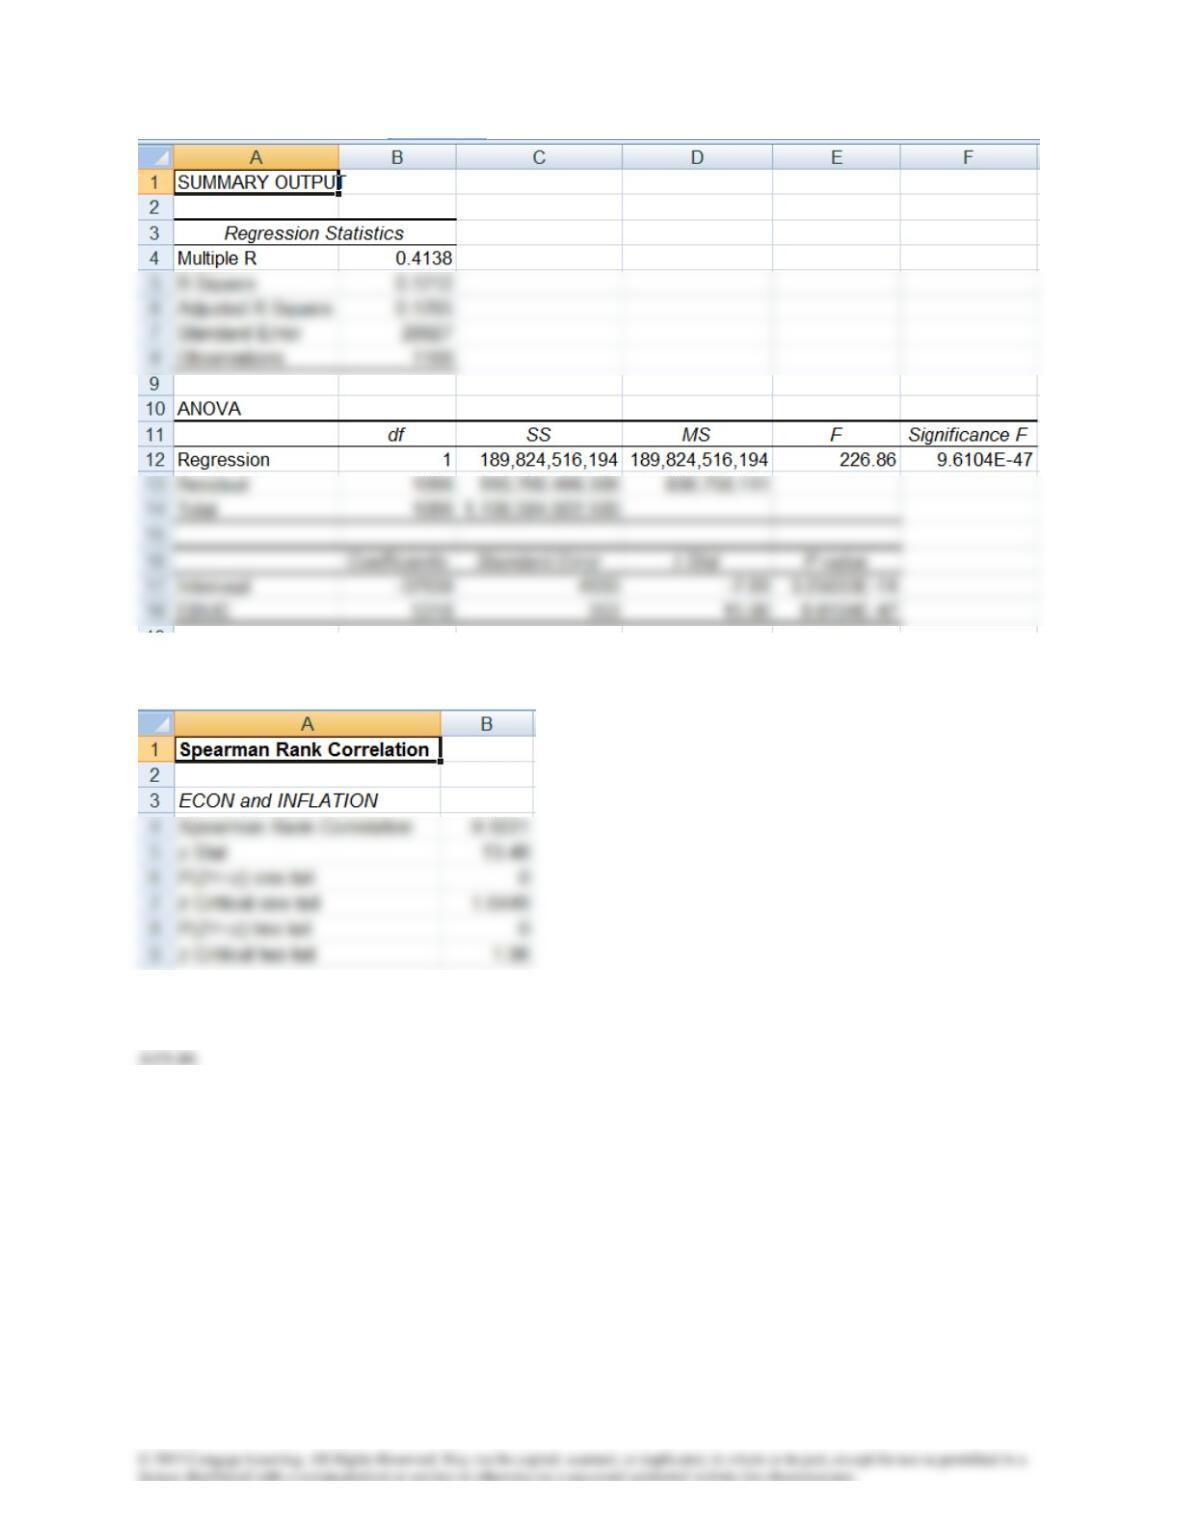
A19.45
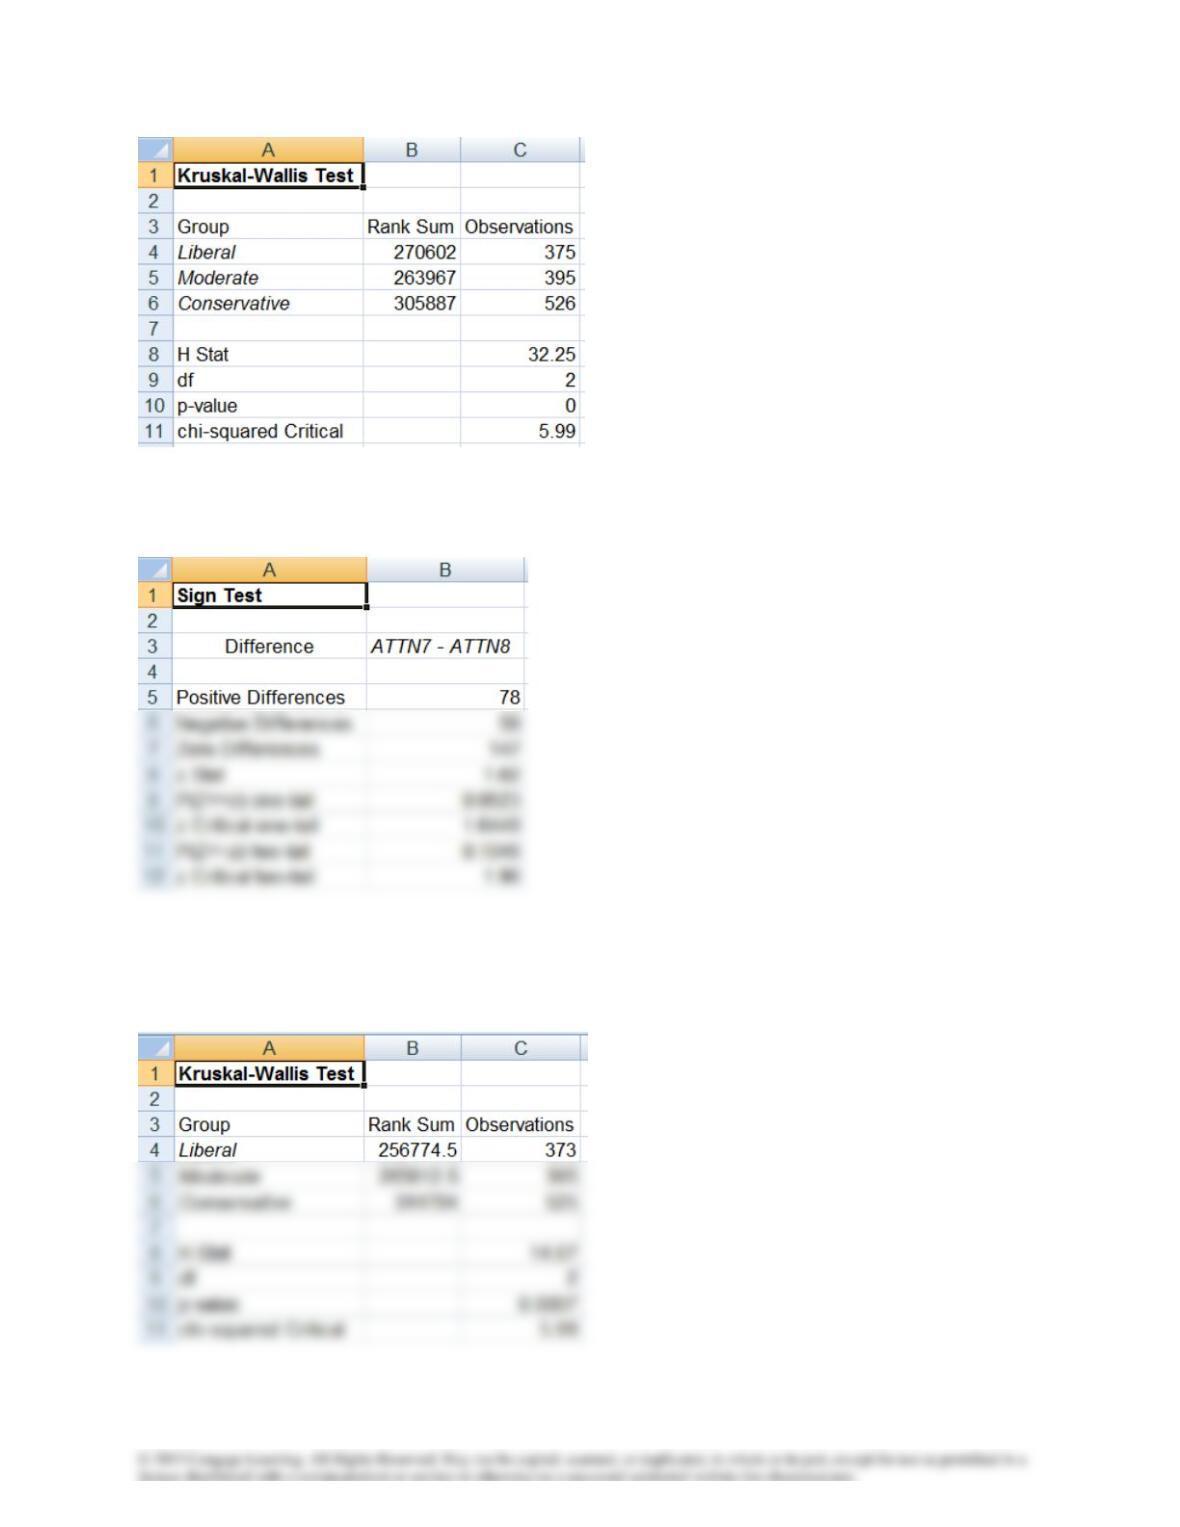
A19.47
A19.48
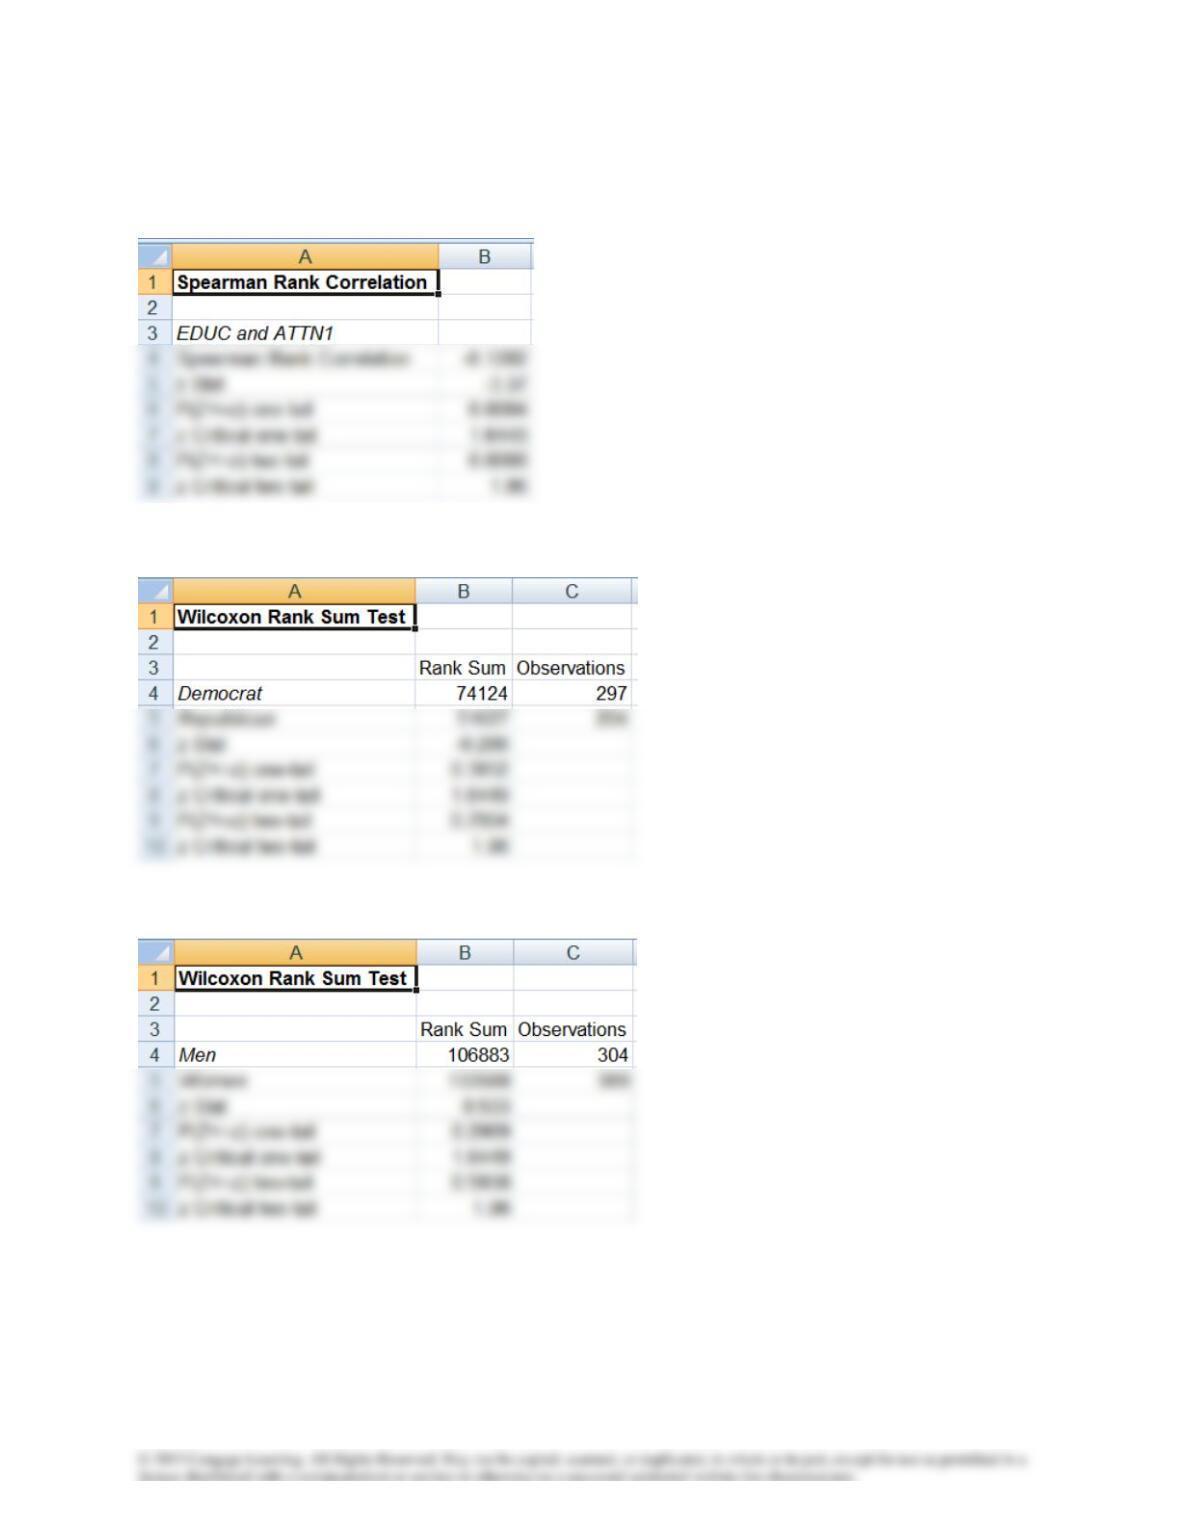
A19.49
Test negative
A19.50
A19.51