CHAPTER 9: SAMPLING DISTRIBUTIONS
TRUE/FALSE
1. The Central Limit Theorem permits us to draw conclusions about a population based on a sample
alone, without having any knowledge about the distribution of that population. And this works no
matter what the sample size is.
2. When a great many simple random samples of size n are drawn from a population that is normally
distributed, the sampling distribution of the sample mean is normal regardless of the sample size n.
3. Consider an infinite population with a mean of 100 and a standard deviation of 20. A random sample
of size 64 is taken from this population. The standard deviation of the sample mean equals 2.50.
4. If all possible samples of size n are drawn from an infinite population with standard deviation 8, then
the standard error of the sample mean equals 1.0 if the sample size is 64.
5. A sample of size n is selected at random from an infinite population. As n increases, the standard error
of the sample mean increases.
6. A sample of size 25 is selected from a population of size 500. The finite population correction is
needed to find the standard error of .
7. A sample of size 25 is selected from a population of size 75. The finite population correction needed to
find the standard error of .
8. The amount of time it takes to complete a final examination is negatively skewed distribution with a
mean of 70 minutes and a standard deviation of 8 minutes. If 64 students were randomly sampled, the
probability that the sample mean of the sampled students exceeds 73.5 minutes is approximately 0.
9. If all possible samples of size n are drawn from a normal population, the probability distribution of the
sample mean is an normal distribution.
10. If the sample size increases, the standard error of the mean also increases.
11. The amount of bleach a machine pours into bottles has a mean of 50 ounces with a standard deviation
of 0.25 ounces. We take a random sample of 36 bottles filled by this machine. The sampling
distribution of the sample mean has a mean of 50 ounces.
12. If the population distribution is skewed, in most cases the sampling distribution of the sample mean
can be approximated by the normal distribution if the samples contain at least 30 observations.
13. A sampling distribution is a probability distribution for a statistic, not a parameter.
14. A sampling distribution is defined as the probability distribution of means from all possible sample
sizes that are taken from a given population.
15. If the population distribution is unknown, in most cases the sampling distribution of the mean can be
approximated by the normal distribution if the samples contain at least 30 observations.
16. The amount of bleach a machine pours into bottles has a mean of 50 ounces with a standard deviation
of 0.25 ounces. Suppose we take a random sample of 36 bottles filled by this machine. The sampling
distribution of the sample mean has a standard error of 0.25 ounces.
17. As the size of the sample is increased, the standard error of decreases.
18. As the size of the sample is increased, the mean of increases.
19. In inferential statistics, the standard error of the sample mean assesses the uncertainty or error of
estimation.
MULTIPLE CHOICE
1. The standard deviation of the sampling distribution of is also called the:
a.
central limit theorem.
c.
finite population correction factor.
b.
population standard deviation.
d.
standard error of the sample mean.
2. Random samples of size 49 are taken from an infinite population whose mean is 300 and standard
deviation is 21. The mean and standard error of the sample mean, respectively, are:
a.
300 and 21
c.
300 and 0.43
b.
300 and 3
d.
None of these choices.
3. Given an infinite population with a mean of 75 and a standard deviation of 12, the probability that the
mean of a sample of 36 observations, taken at random from this population, is less than 78 is:
a.
0.9332
c.
1.5000
b.
0.5987
d.
None of these choices.
4. An infinite population has a mean of 40 and a standard deviation of 15. A sample of size 100 is taken
at random from this population. The standard error of the sample mean equals:
a.
15
c.
15/100
b.
15/100
d.
None of these choices.
5. If all possible samples of size n are drawn from an infinite population with a mean of 15 and a
standard deviation of 5, then the standard error of the sample mean equals 1.0 for samples of size:
a.
5
c.
25
b.
15
d.
None of these choices.
6. As a general rule in computing the standard error of the sample mean, the finite population correction
factor is used only if the:
a.
sample size is smaller than 5% of the population size.
b.
sample size is greater than 5% of the sample size.
c.
sample size is more than half of the population size.
d.
None of these choices.
7. Consider an infinite population with a mean of 160 and a standard deviation of 25. A random sample
of size 64 is taken from this population. The standard deviation of the sample mean equals:
a.
25
c.
25/64
b.
25/64
d.
None of these choices.
8. The Central Limit Theorem states that, if a random sample of size n is drawn from a population, then
the sampling distribution of the sample mean :
a.
is approximately normal if n < 30.
b.
is approximately normal if n > 30.
c.
is approximately normal if the underlying population is normal.
d.
None of these choices.
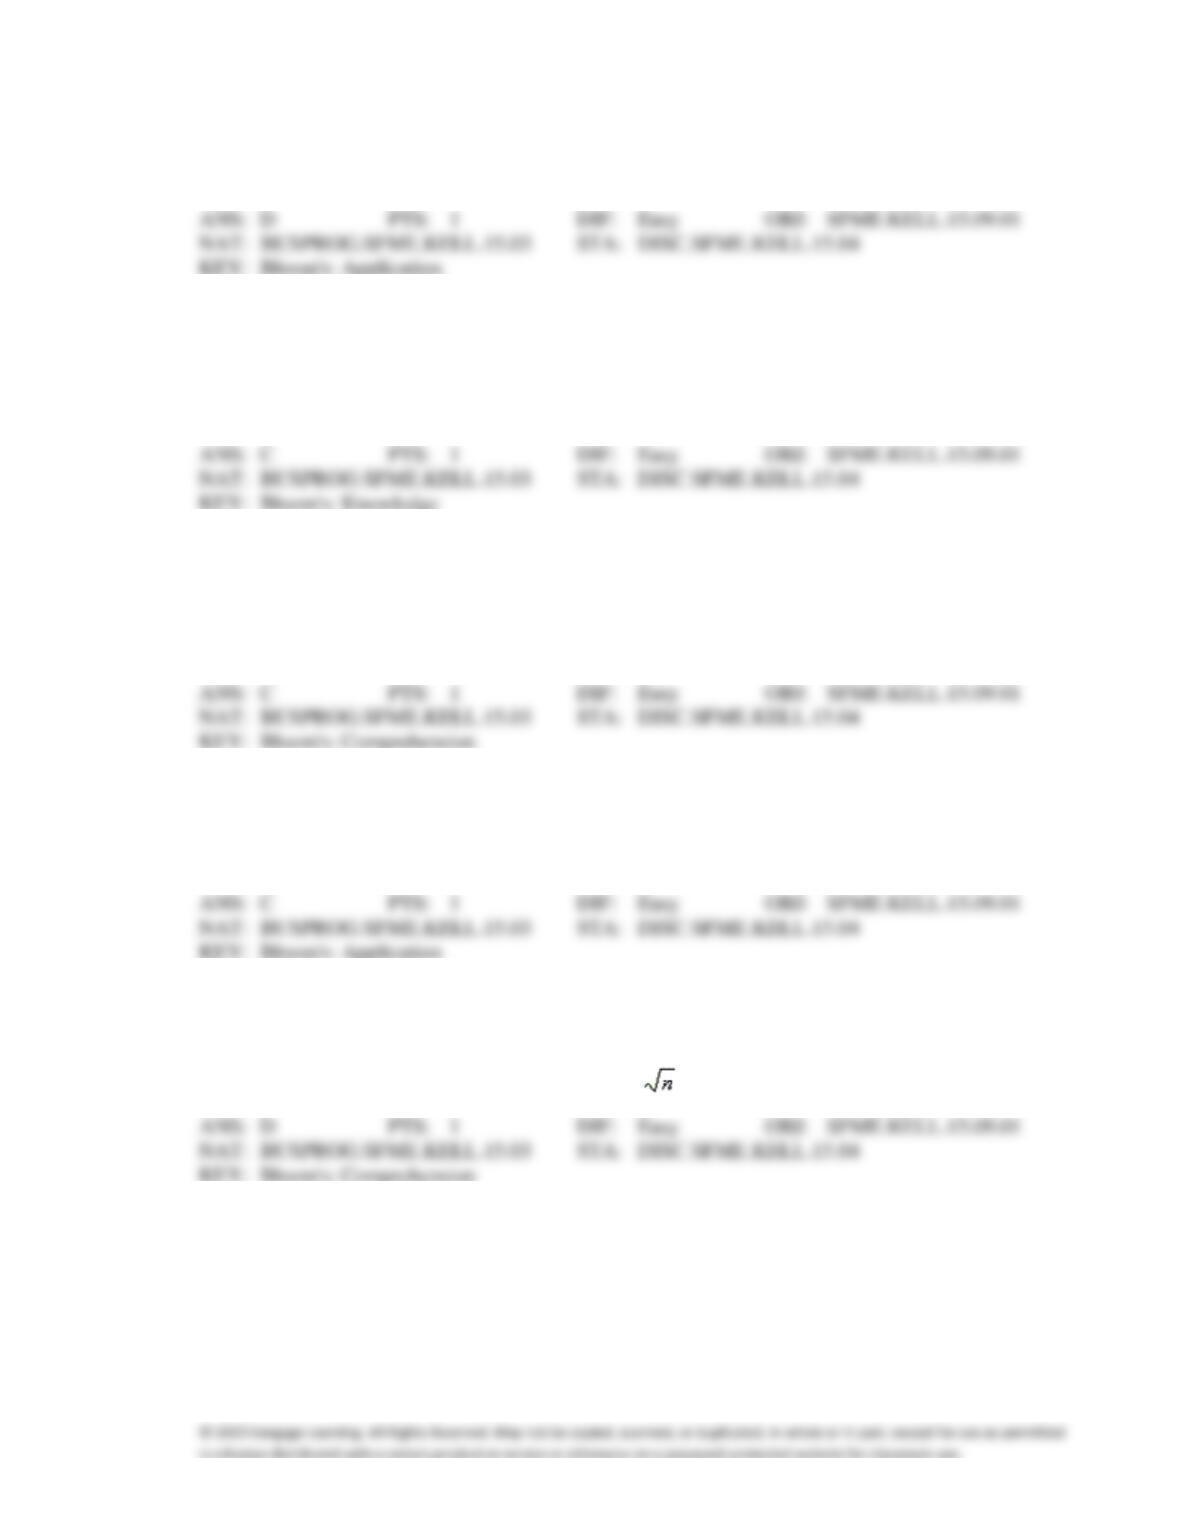
9. A sample of size 40 is taken from an infinite population whose mean and standard deviation are 68 and
12, respectively. The probability that the sample mean is larger than 70 equals
a.
P(Z > 70)
c.
P(Z > 0.17)
b.
P(Z > 2)
d.
P(Z > 1.05)
10. The finite population correction factor should be used:
a.
whenever we are sampling from an infinite population.
b.
whenever we are sampling from a finite population.
c.
whenever the sample size is large compared to the population size.
d.
whenever the sample size is small compared to the population size.
11. Random samples of size 81 are taken from an infinite population whose mean and standard deviation
are 45 and 9, respectively. The mean and standard error of the sampling distribution of the sample
mean are:
a.
45 and 9
c.
45 and 9/81
b.
45/81 and 9/81
d.
45/81 and 9/81
12. A sample of size 25 is selected at random from a finite population. If the finite population correction
factor is 0.63, then the population size is:
a.
25
c.
41
b.
66
d.
None of these choices.
13. If all possible samples of size n are drawn from an infinite population with a mean of
and a standard
deviation of
, then the standard error of the sample mean is inversely proportional to:
a.
c.
n
b.
d.
14. A sample of size n is selected at random from an infinite population. As n increases, which of the
following statements is true?
a.
The population standard deviation decreases.
b.
The standard error of the sample mean decreases.
c.
The population standard deviation increases.
d.
The standard error of the sample mean increases.
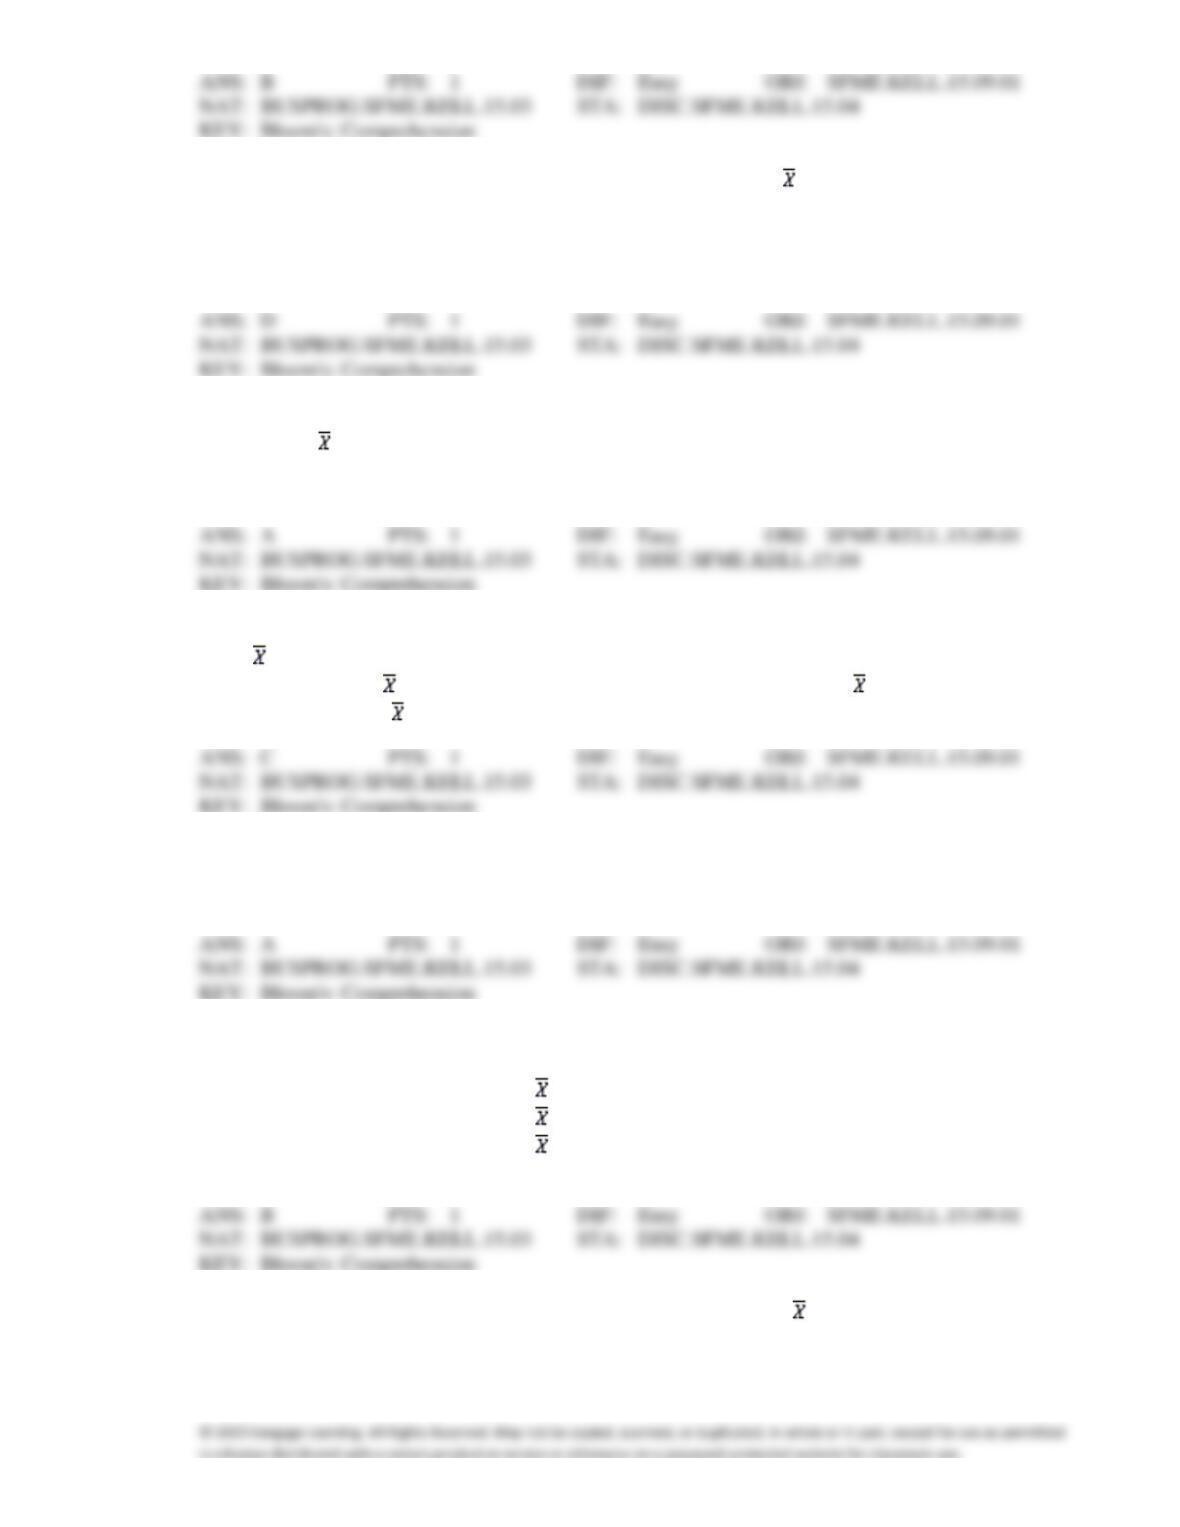
15. The expected value of the sampling distribution of the sample mean equals the population mean
:
a.
only when the population is normally distributed.
b.
only when the sample size is large.
c.
only when the population is infinite.
d.
for all populations.
16. If a random sample of size n is drawn from a normal population, then the sampling distribution of the
sample mean will be:
a.
normal for all values of n.
c.
approximately normal for all values of n.
b.
normal only for n > 30.
d.
approximately normal only for n > 30.
17. If all possible samples of size n are drawn from a population, the probability distribution of the sample
mean is called the:
a.
standard error of .
c.
sampling distribution of .
b.
expected value of .
d.
normal distribution.
18. Sampling distributions describe the distributions of:
a.
sample statistics.
c.
both parameters and statistics
b.
population parameters.
d.
None of these choices.
19. Suppose X has a distribution that is not normal. The Central Limit Theorem is important in this case
because:
a.
it says the sampling distribution of is approximately normal for any sample size.
b.
it says the sampling distribution of is approximately normal if n is large enough.
c.
it says the sampling distribution of is exactly normal, for any sample size.
d.
None of these choices.
20. Which of the following statements about the sampling distribution of is NOT true?
a.
It is generated by taking all possible samples of size n and computing their sample means.
b.
Its mean is equal to the population mean
.
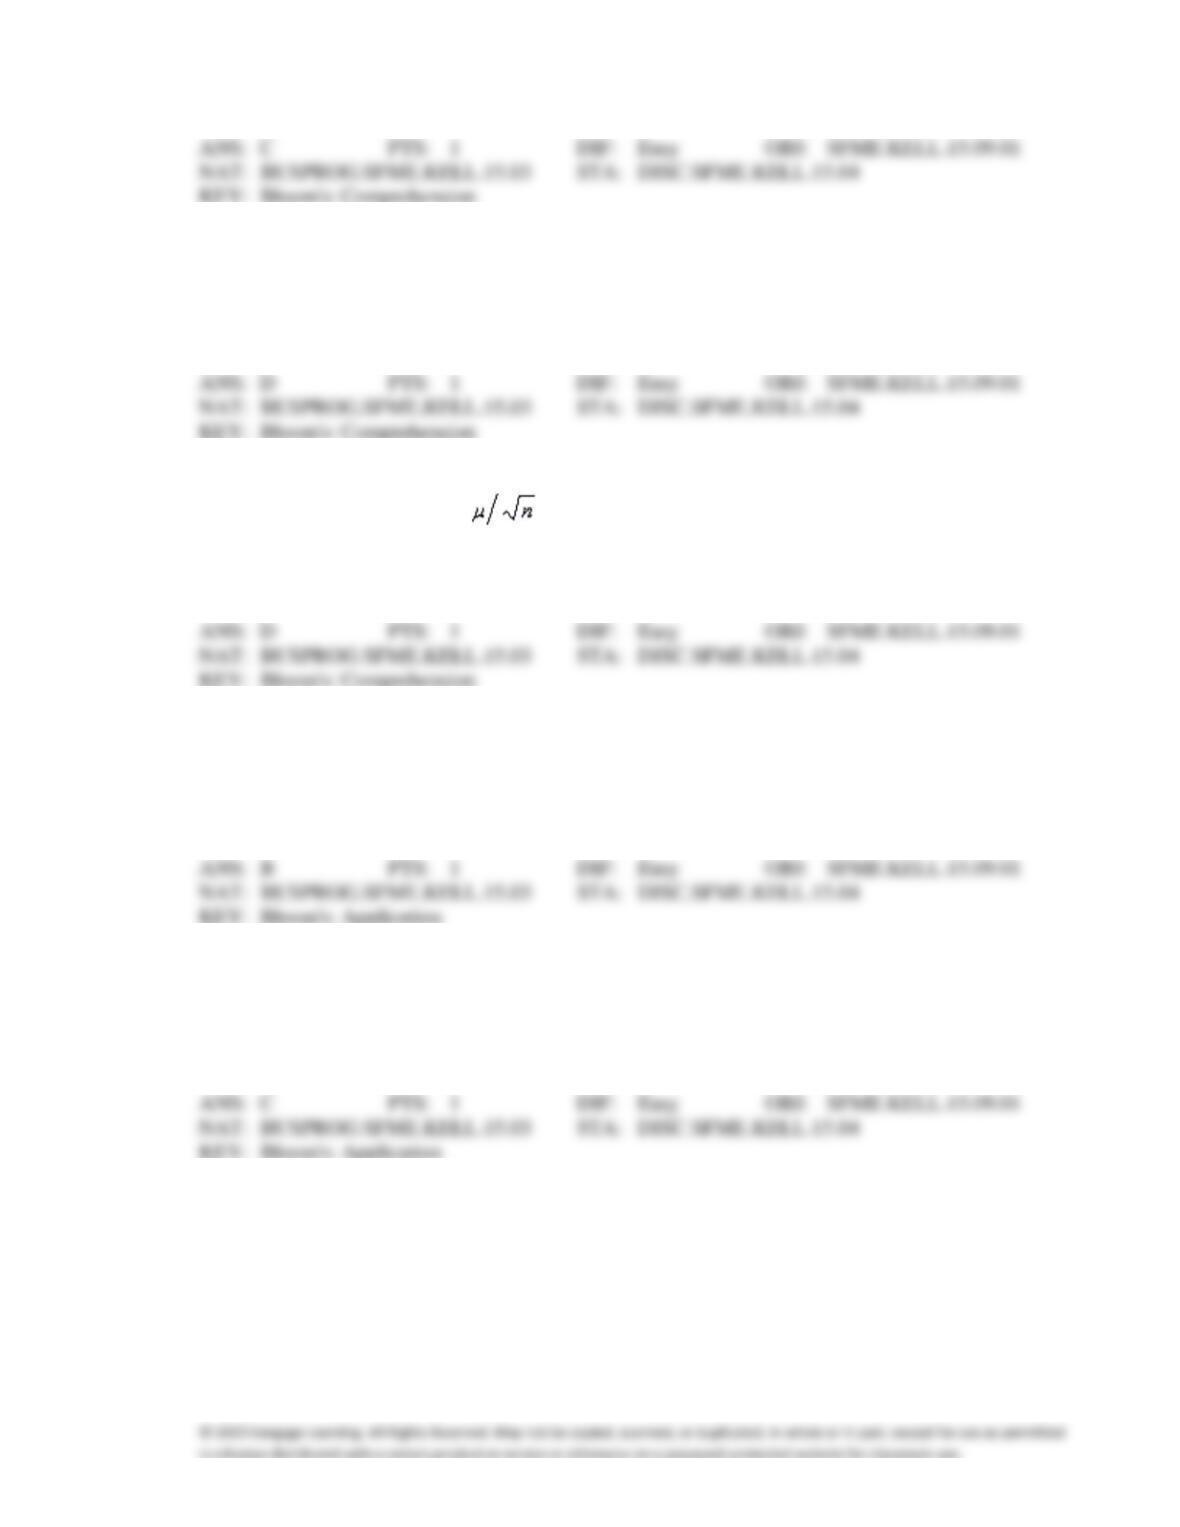
c.
Its standard deviation is equal to the population standard deviation
.
d.
All of these choices are true.
21. The standard error of the mean:
a.
is never larger than the standard deviation of the population.
b.
decreases as the sample size increases.
c.
measures the variability of the mean from sample to sample.
d.
All of these choices are true.
22. Which of the following is true about the sampling distribution of the sample mean?
a.
Its mean is always equal to
b.
Its standard error is always equal to the population standard deviation
.
c.
Its shape is exactly normal if n is large enough.
d.
None of these choices.
23. The owner of a meat market has an assistant who has determined that the weights of roasts are
normally distributed, with a mean of 3.2 pounds and standard deviation of 0.8 pounds. If a sample of
25 roasts yields a mean of 3.6 pounds, what is the Z-score for this sample mean?
a.
−2.50
c.
−0.50
b.
2.50
d.
None of these choices.
24. The owner of a fish market has an assistant who has determined that the weights of catfish are
normally distributed, with a mean of 3.2 pounds and standard deviation of 0.84 pounds. If a sample of
16 fish is taken, what is the standard error of the mean weight?
a.
0.840
c.
0.210
b.
0.053
d.
None of these choices.
25. Suppose the ages of students in your program follow a positively skewed distribution with mean of 24
years and a standard deviation of 4 years. If we randomly sampled 100 students, which of the
following statements about the sampling distribution of the sample mean age is NOT true?
a.
The mean of the sampling distribution of sample mean is equal to 24 years.
b.
The standard deviation of the sampling distribution of sample mean is equal to 4 years.
c.
The shape of the sampling distribution of sample mean is approximately normal.
d.
All of these choices are true.
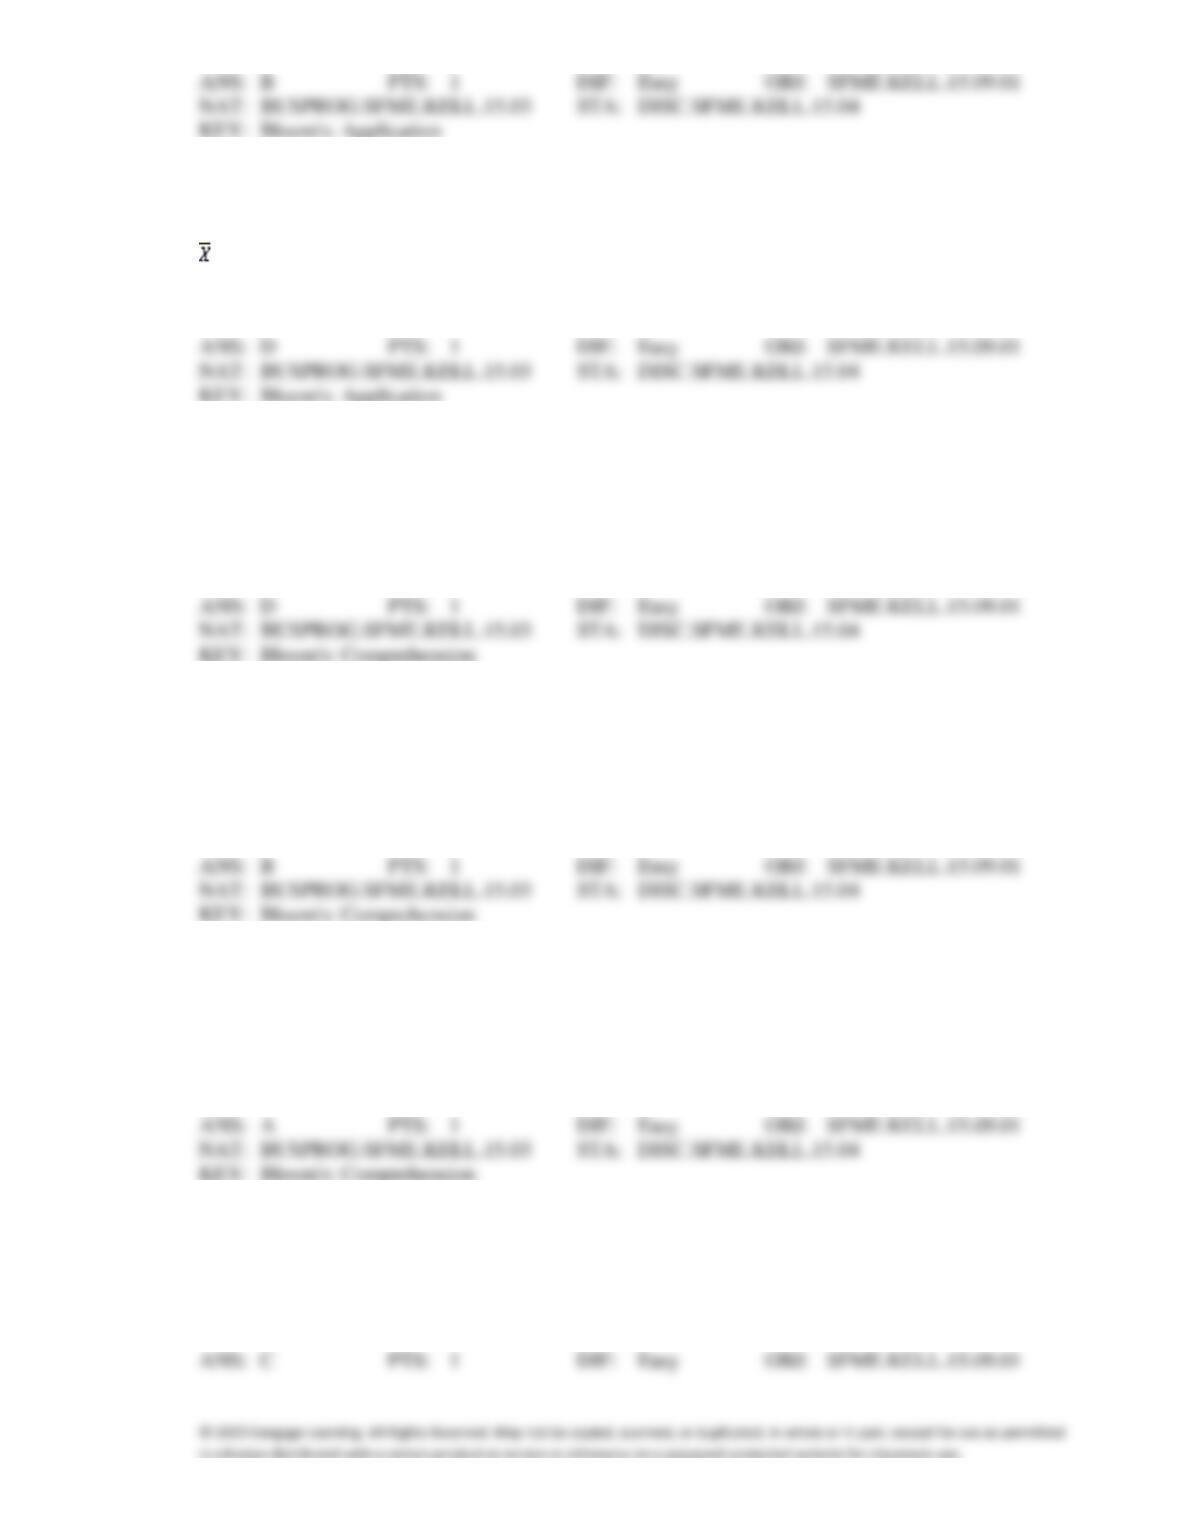
26. Suppose that 100 items are drawn from a population of manufactured products and the weight, X, of
each item is recorded. Prior experience has shown that the weight has a non-normal probability
distribution with
= 8 ounces and
= 3 ounces. Which of the following is true about the sampling of
?
a.
Its mean is 8 ounces.
c.
Its shape is approximately normal.
b.
Its standard error is 0.3 ounces.
d.
All of these choices are true.
27. The standard error of the mean for a sample of 100 is 25. In order to cut the standard error of the mean
in half (to 12.5) we must:
a.
increase the sample size to 200.
b.
decrease the sample size to 50.
c.
keep the sample size at 100 and change something else.
d.
None of these choices.
28. Which of the following is true regarding the sampling distribution of the mean for a large sample size?
Assume the population distribution is not normal.
a.
It has the same shape, mean and standard deviation as the population.
b.
It has the same mean as the population, but a different shape and standard deviation.
c.
It the same mean and standard deviation as the population, but a different shape.
d.
It has the same shape and mean as the population, but a different standard deviation.
29. For sample sizes greater than 30, the sampling distribution of the mean is approximately normally
distributed:
a.
regardless of the shape of the population.
b.
only if the shape of the population is symmetric.
c.
only if the population is normally distributed.
d.
None of these choices.
30. For a sample size of 1, the sampling distribution of the mean is normally distributed:
a.
regardless of the shape of the population.
b.
only if the population values are larger than 30.
c.
only if the population is normally distributed.
d.
None of these choices.
COMPLETION
1. Because the value of the ____________________ varies randomly from sample to sample, we can
regard it as a new random variable created by sampling.
2. The variance of the sampling distribution of is ____________________ the variance of the
population we’re sampling from for all sample sizes.
3. A randomly selected value of is likely to be ____________________ to(than) the mean of the
population than is a randomly selected value of X.
4. As the number of throws of a fair die increases, the probability that the sample mean is close to (the
number) ____________________ increases.
5. The width of the sampling distribution of gets ____________________ as the sample size
increases.
6. As n gets ____________________, the shape of the sampling distribution of becomes increasingly
bell shaped.
7. As n gets larger, the sampling distribution of becomes increasingly bell shaped. This phenomenon
is due to the ____________________.
8. The accuracy of the approximation of with a normal distribution depends on the probability
distribution of the ____________________ and on the sample ____________________.
9. If the population is normal, then is normally distributed for __________________ values of n.
10. The finite population correction is not needed if the population size is large relative to the sample size.
As a rule of thumb, we will treat any population that is at least ____________________ times larger
than the sample size as large.
SHORT ANSWER
Heights of Fences
1. {Heights of Fences Narrative} Find the probability that one randomly selected fence is under 54
inches.
2. {Heights of Fence Narrative} Find the probability that two randomly selected fences are both under 54
inches.
3. {Heights of Fence Narrative} Find the probability that the mean height of 4 randomly selected fences
is under 54 inches.
Average Annual Revenue
Suppose that the average annual revenue of a small business is $150,000 with a standard deviation of
$40,000. Assume that the revenue distribution is normal.
4. {Average Annual Revenue Narrative} What is the probability that one business selected at random
makes less than $120,000?
5. {Average Annual Revenue Narrative} What is the probability that the average annual revenue of a
random sample of 4 businesses is less than $120,000?
6. {Average Annual Revenue Narrative} Why are your answers to the previous two questions different?
7. {Average Annual Revenue Narrative} Could you have used a normal distribution to find an
(approximate) probability for the average of 4 revenues if the population of revenues did not have a
normal distribution?
Mean Salary
In order to estimate the mean salary for a population of 500 employees, the president of a certain
company selected at random a sample of 40 employees.
8. {Mean Salary Narrative} Would you use the finite population correction factor in calculating the
standard error of the sample mean in this case? Explain.
9. {Mean Salary Narrative} If the population standard deviation is $800, compute the standard error both
with and without using the finite population correction factor.
Retirees
A sample of 50 retirees is drawn at random from a normal population whose mean age and standard
deviation are 75 and 6 years, respectively.
10. (Retirees Narrative} Describe the shape of the sampling distribution of the sample mean in this case.
11. (Retirees Narrative} Find the mean and standard error of the sampling distribution of the sample mean.
12. {Retirees Narrative} What is the probability that the mean age exceeds 73 years?
13. {Retirees Narrative} What is the probability that the mean age is at most 73 years?
14. {Retirees Narrative} What is the probability that two randomly selected retirees are over 73 years of
age?
ANS:
Heights of Men
15. {Heights of Men Narrative} What is the probability that a randomly selected man is taller than 70
inches?
16. {Heights of Men Narrative} A random sample of five men is selected. What is the probability that the
sample mean is greater than 70 inches?
17. {Heights of Men Narrative} What is the probability that the mean height of a random sample of 36
men is greater than 70 inches?
18. {Heights of Men Narrative} If the population of men’s heights is not normally distributed, which, if
any, of the previous questions can you answer?
Poker Time
The amount of time spent by American adults playing Poker per week is normally distributed with a
mean of 4 hours and standard deviation of 1.25 hours.
19. {Poker Time Narrative} Find the probability that a randomly selected American adult plays Poker for
more than 5 hours per week.
20. {Poker Time Narrative} Find the probability that if four American adults are randomly selected, their
average number of hours spent playing Poker is more than 5 hours per week.
21. {Poker Time Narrative} Find the probability that if four American adults are randomly selected, all
four play Poker for more than 5 hours per week.
Number of Fish Tanks
The following data give the number of fish tanks owned for a population of 4 families.
Family
A
B
C
D
Number of Fish Tanks Owned
2
1
4
3
22. {Number of Fish Tanks Narrative} Find the mean and the standard deviation for the population.
23. {Number of Fish Tanks Narrative} A sample of size 2 is drawn at random from the population. Use
the formulas and to calculate the mean and the standard deviation of the
sampling distribution of the sample means.
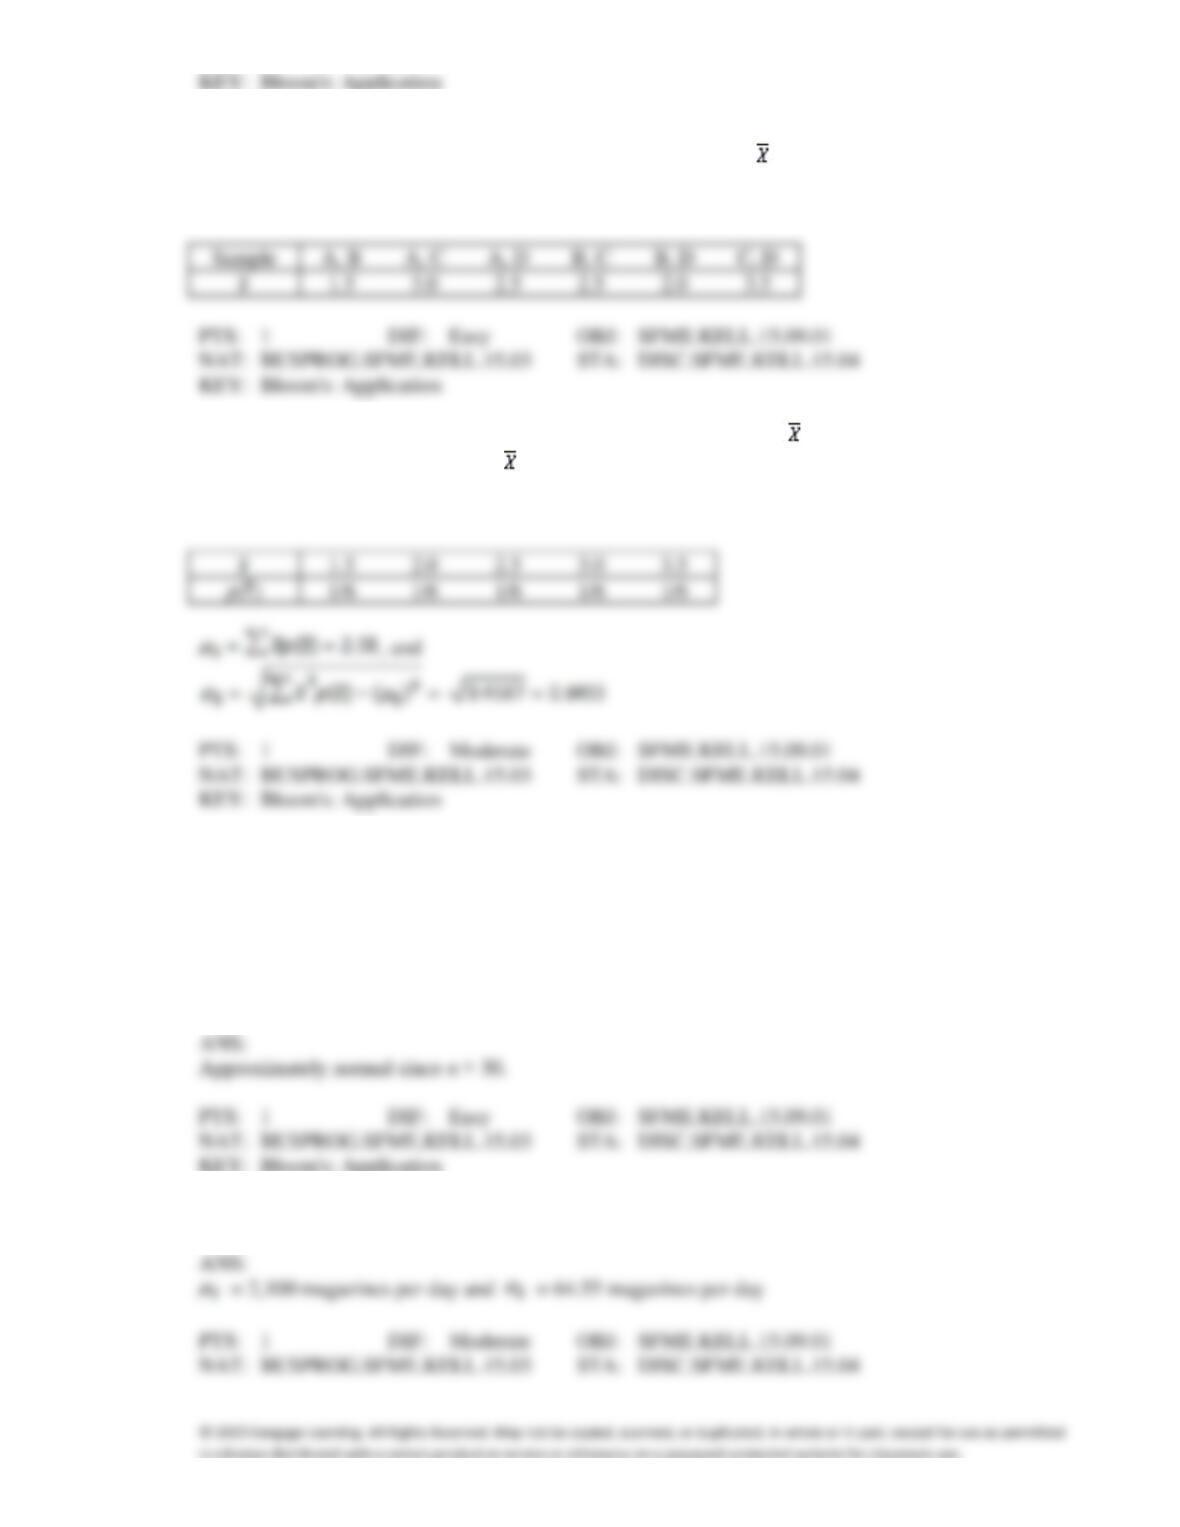
24. {Number of Fish Tanks Narrative} List all possible samples of 2 families that can be selected without
replacement from this population, and compute the sample mean for each sample.
ANS:
25. {Number of Fish Tanks Narrative} Find the sampling distribution of , and use it to calculate the
mean and the standard deviation of .
ANS:
Magazines
A local magazine store sells an average of 2,100 magazines per day, with a standard deviation of 500
magazines. Consider a sample of 60 days of operation.
26. {Magazines Narrative} What is the shape of the sampling distribution of the sample mean number of
magazines sold per day? Why?
27. {Magazines Narrative} Find the expected value and the standard error of the sample mean.
28. {Magazines Narrative} What is the probability that the sample mean is between 2,000 and 2,300
magazines?
29. In a given year, the average annual salary of a NHL hockey player was $205,000 with a standard
deviation of $24,500. If a simple random sample of 50 players was taken, what is the probability that
the sample mean will exceed $210,000?
30. A CPA knows from past history that the average accounts receivable for a company is $521.72 with a
standard deviation of $584.64. If the auditor takes a simple random sample of 100 accounts, what is
the probability that the mean of the sample is within $120 of the population mean?
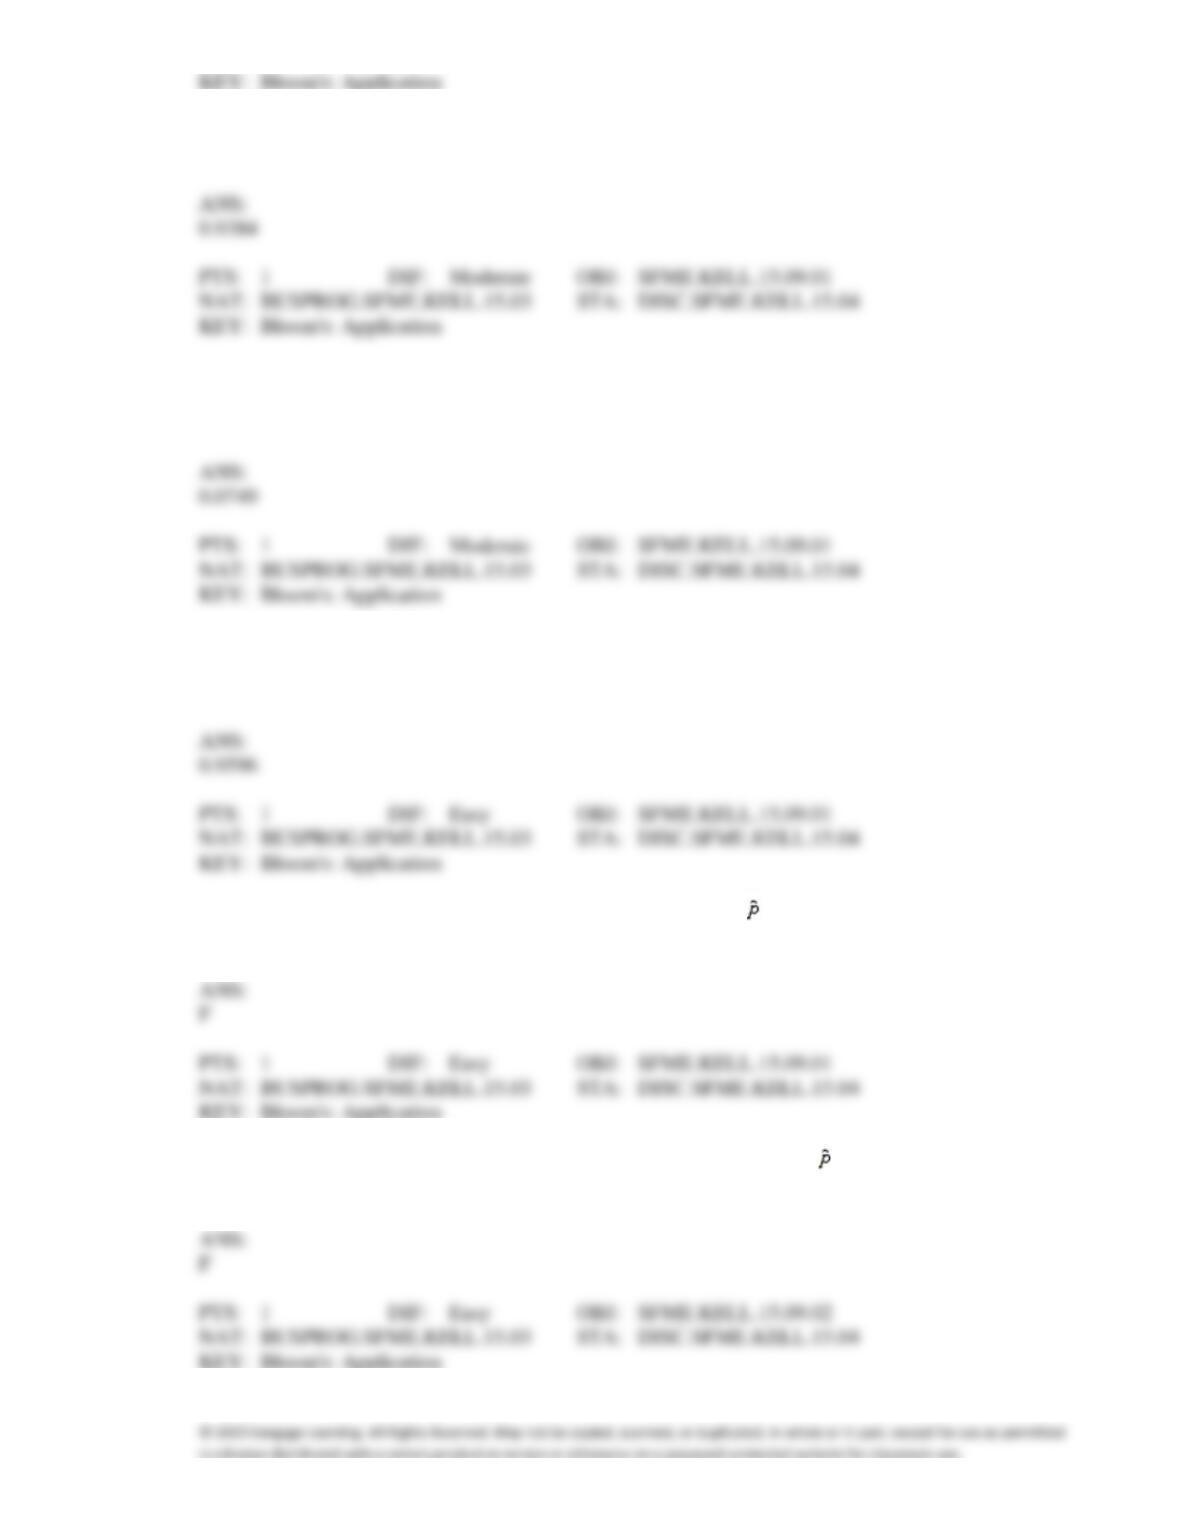
31. The mean of the sampling distribution of the sample proportion , when the sample size n = 100 and
the population proportion p = 0.92, is 92.0.
32. The standard error of the sampling distribution of the sample proportion , when the sample size n =
100 and the population proportion p = 0.30, is 0.0021.