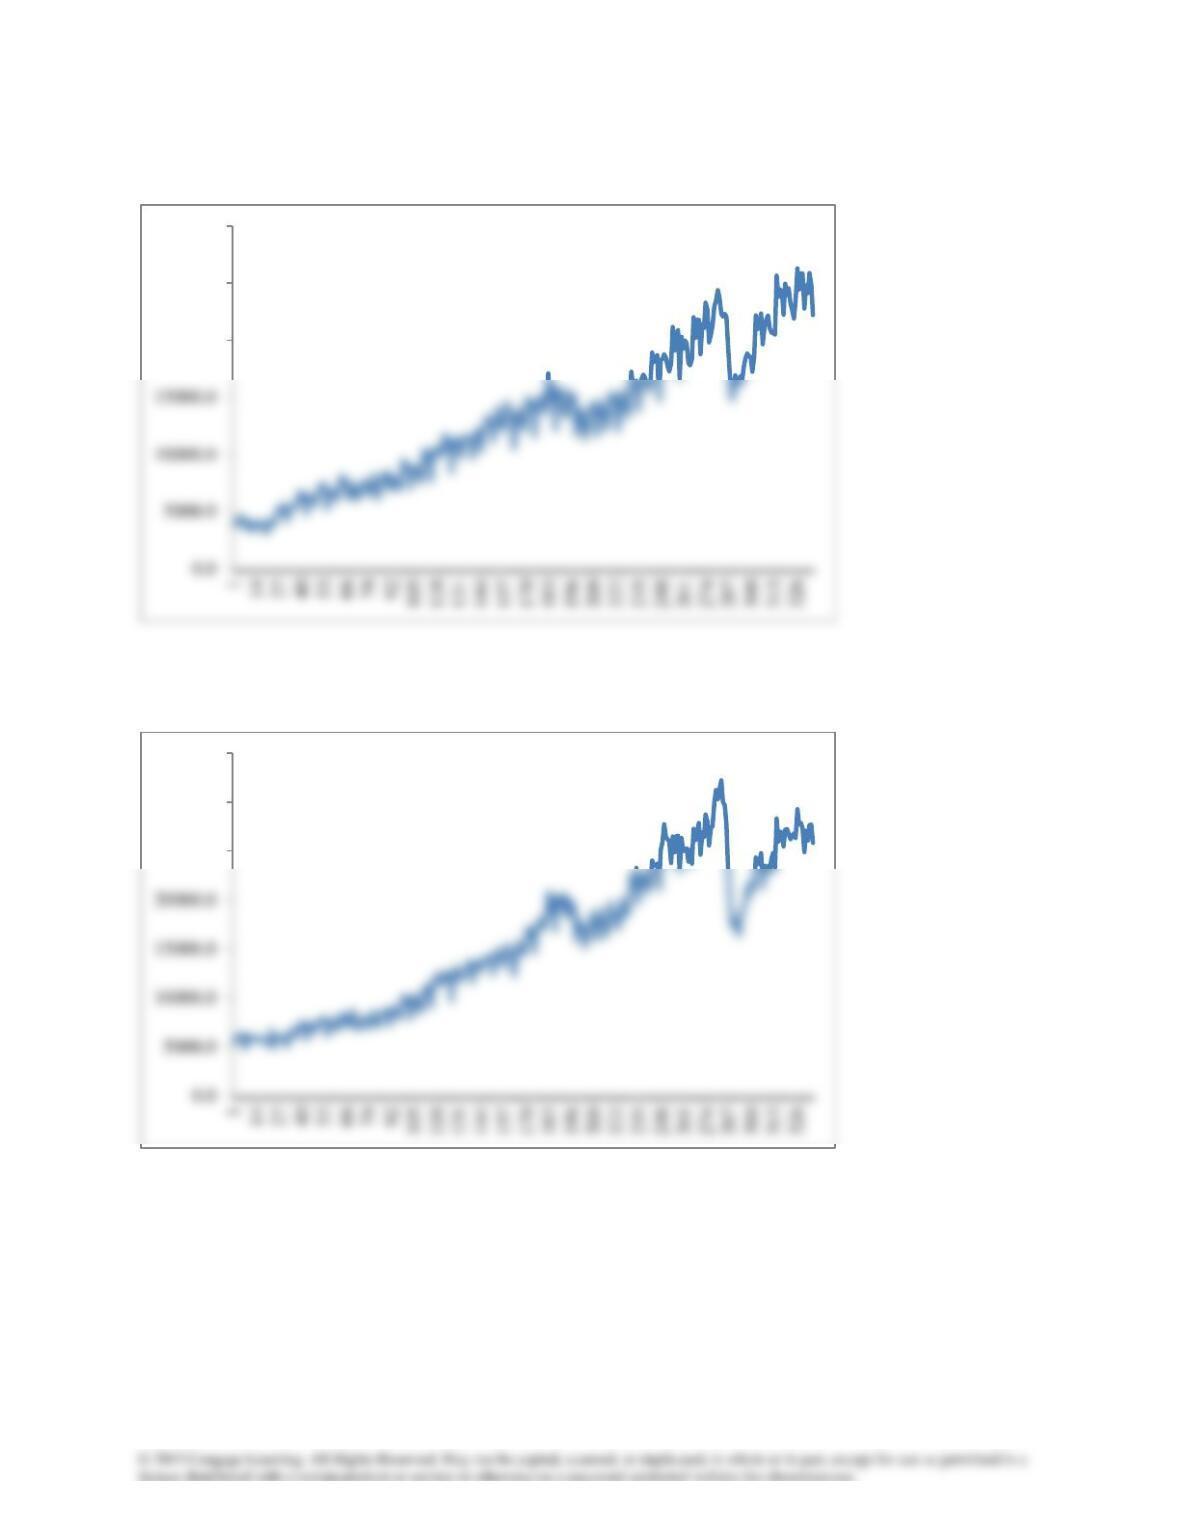
3.42 Exports to Canada
Imports from Canada
20000.0
25000.0
30000.0
25000.0
30000.0
35000.0
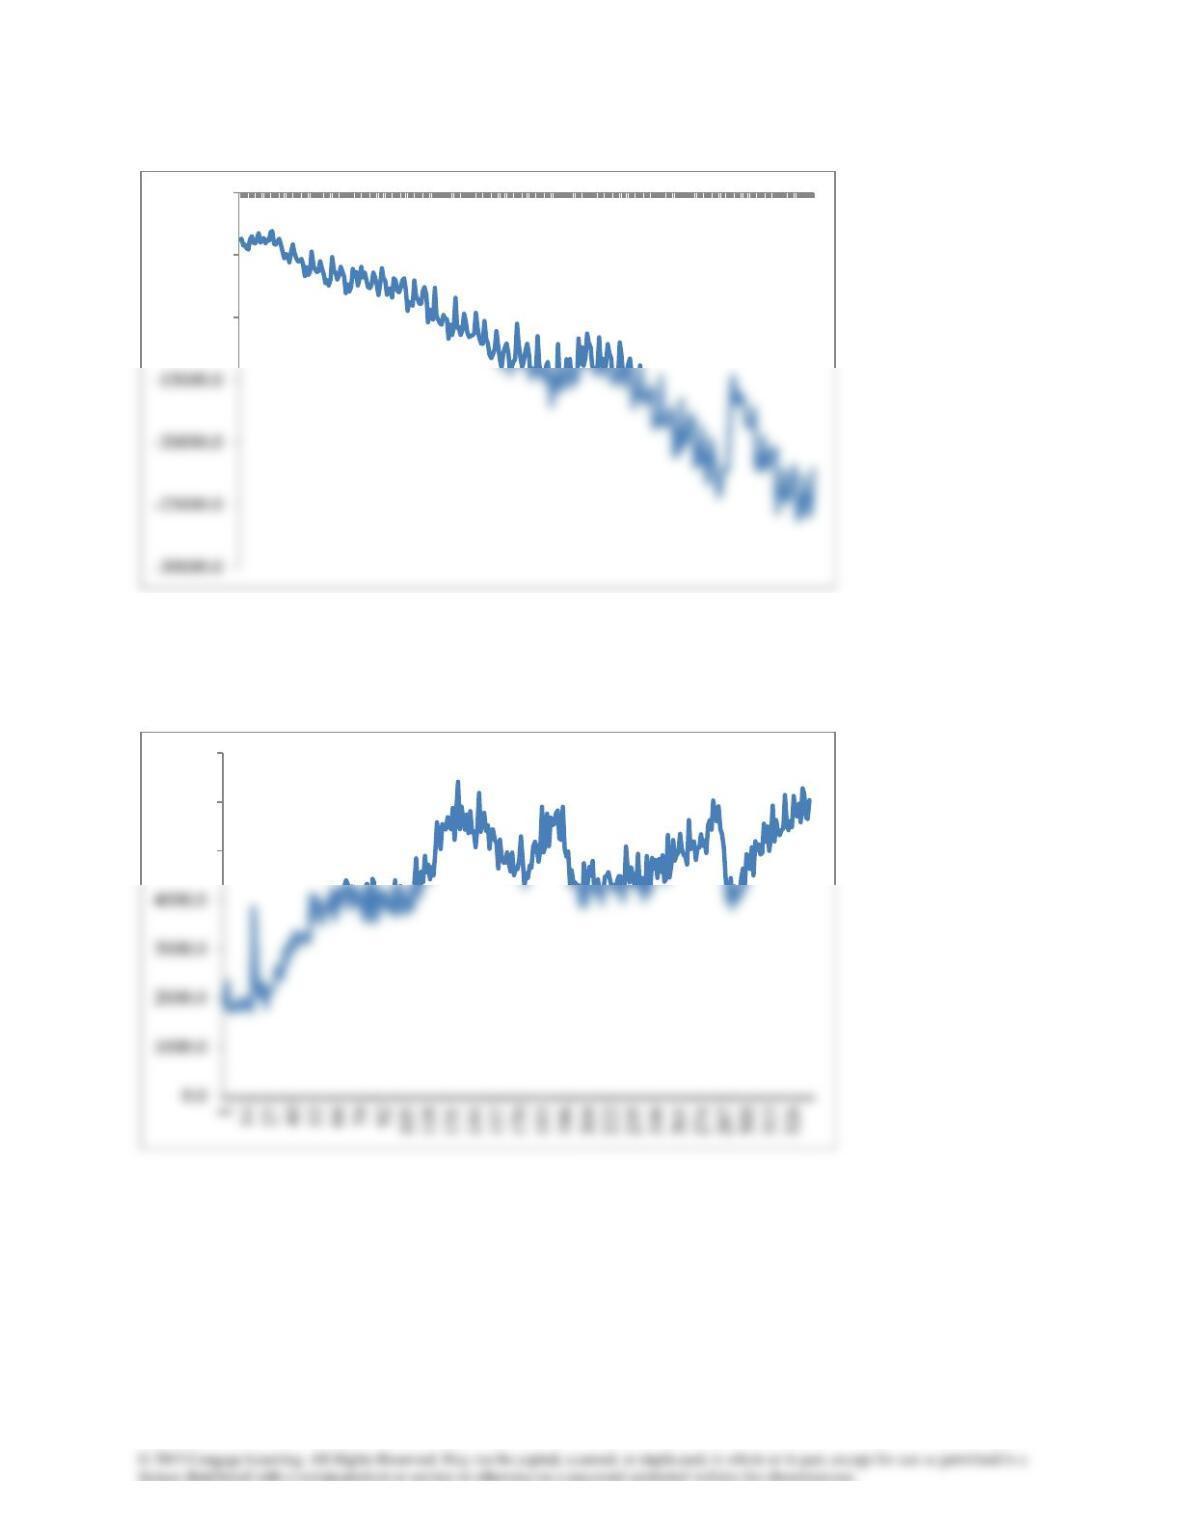
Balance of trade: Exports to Canada – Imports from Canada
Imports from Canada have greatly exceeded exports to Canada.
3.43 Exports to Japan
-10000.0
-5000.0
0.0
1
14
27
40
53
66
79
92
105
118
131
144
157
170
183
196
209
222
235
248
261
274
287
300
313
326
5000.0
6000.0
7000.0
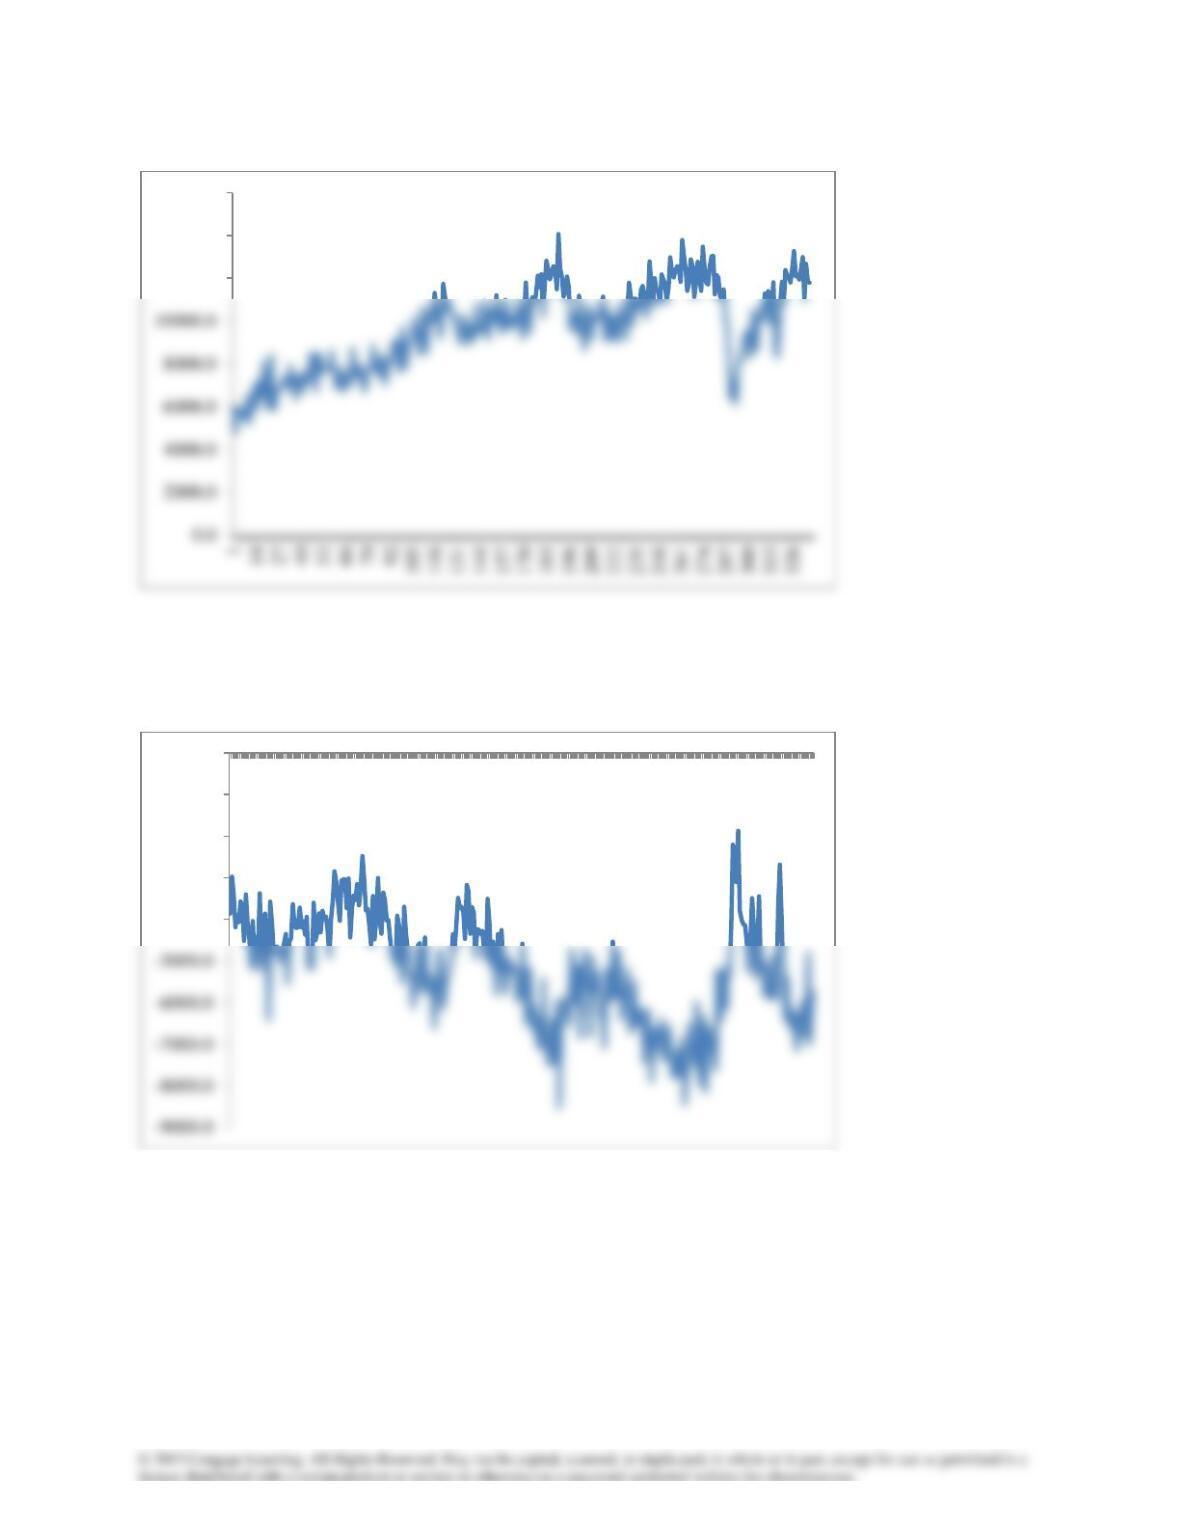
Imports from Japan
Balance of trade: Exports to Japan – Imports from Japan
Imports from Japan have greatly exceeded exports to Japan.
12000.0
14000.0
16000.0
-4000.0
-3000.0
-2000.0
-1000.0
0.0
1
14
27
40
53
66
79
92
105
118
131
144
157
170
183
196
209
222
235
248
261
274
287
300
313
326
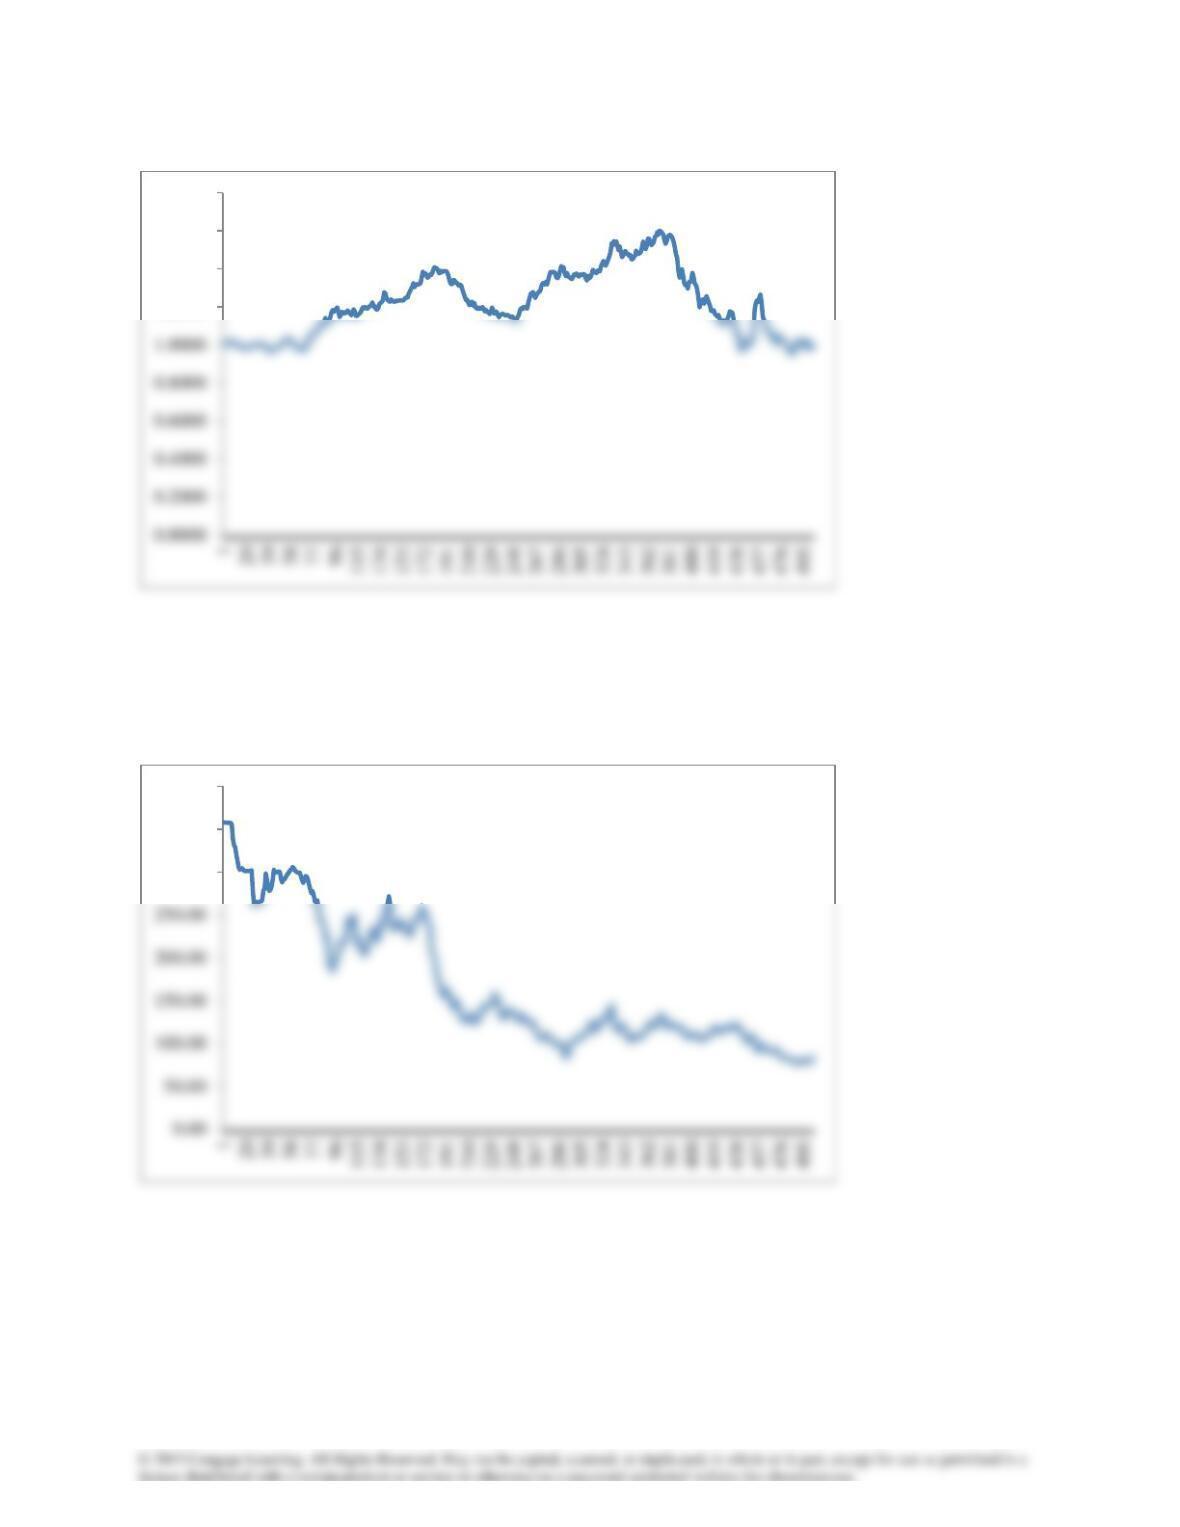
3.44
In the early seventies the Canadian dollar was worth more than the U.S. dollar. By the late seventies the Canadian
lost ground but has recently recovered.
3.45
The yen has significantly increased its value in terms of the American dollar.
1.2000
1.4000
1.6000
1.8000
300.00
350.00
400.00
3.46
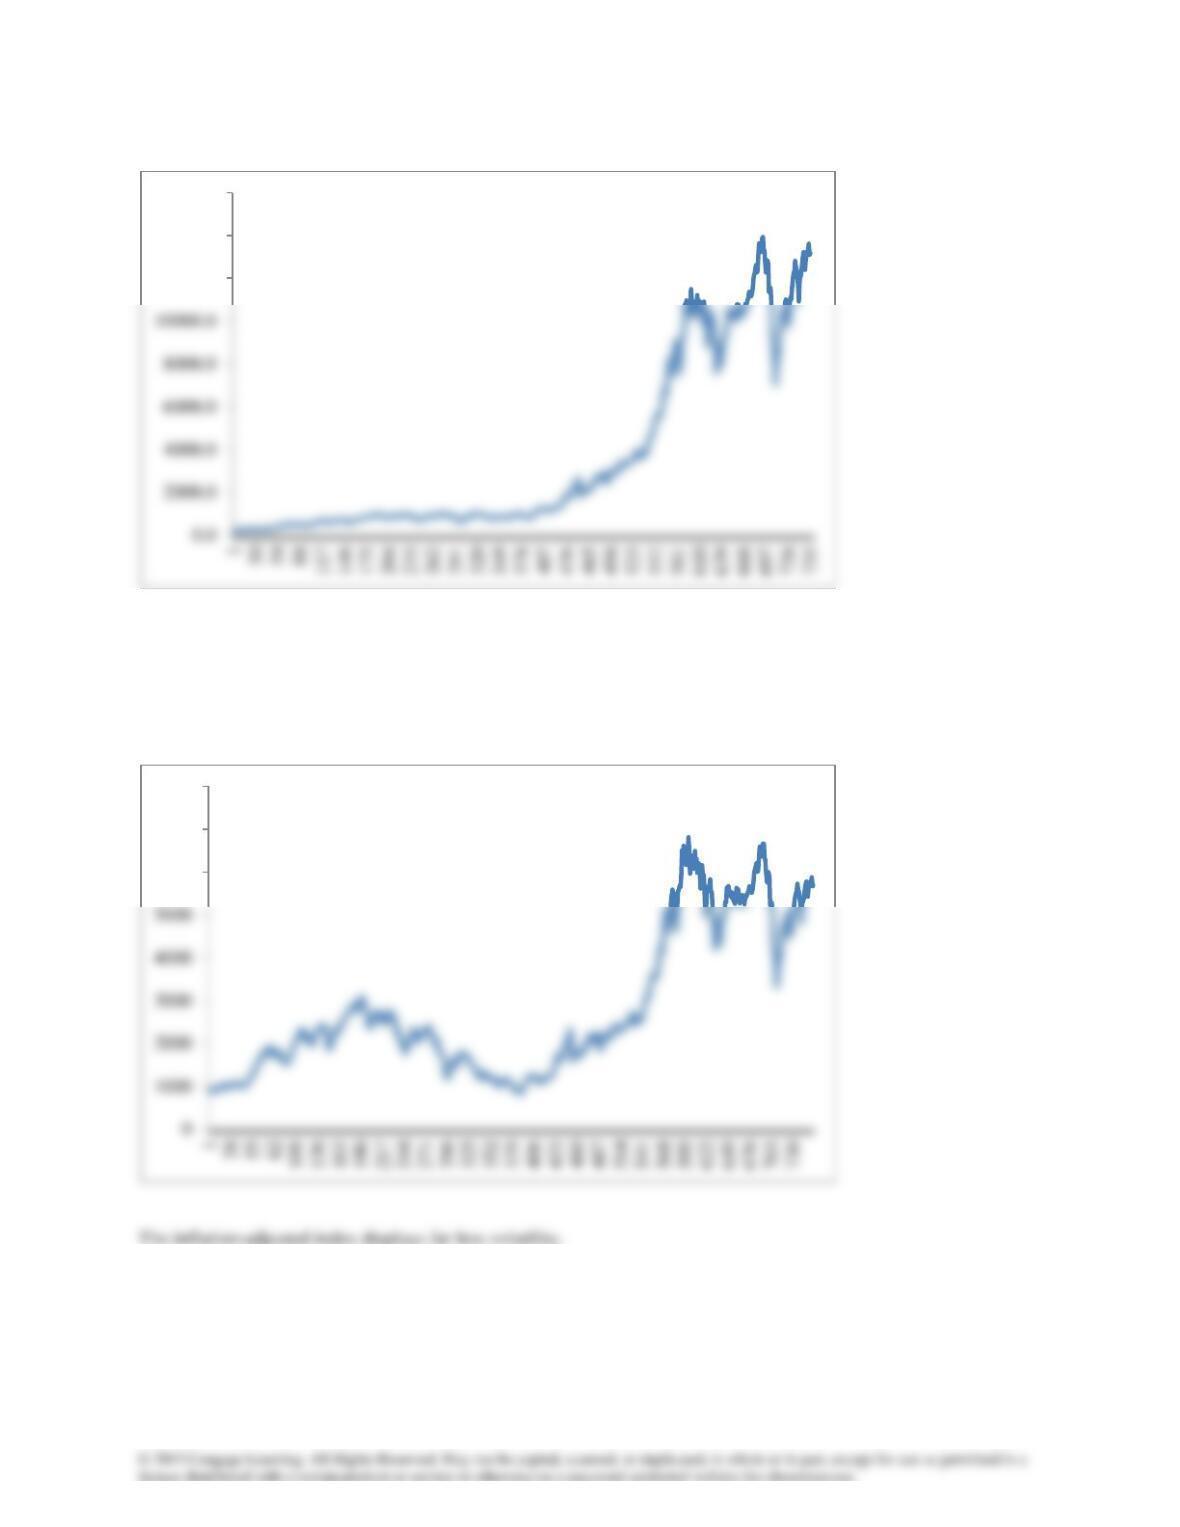
The index grew slowly until month 400 and then grew quickly until month 600. It then fell sharply and recently
recovered.
3.47
12000.0
14000.0
16000.0
6000
7000
8000
3.48
3.49a
3.50a
300
350
400
450
20
30
40
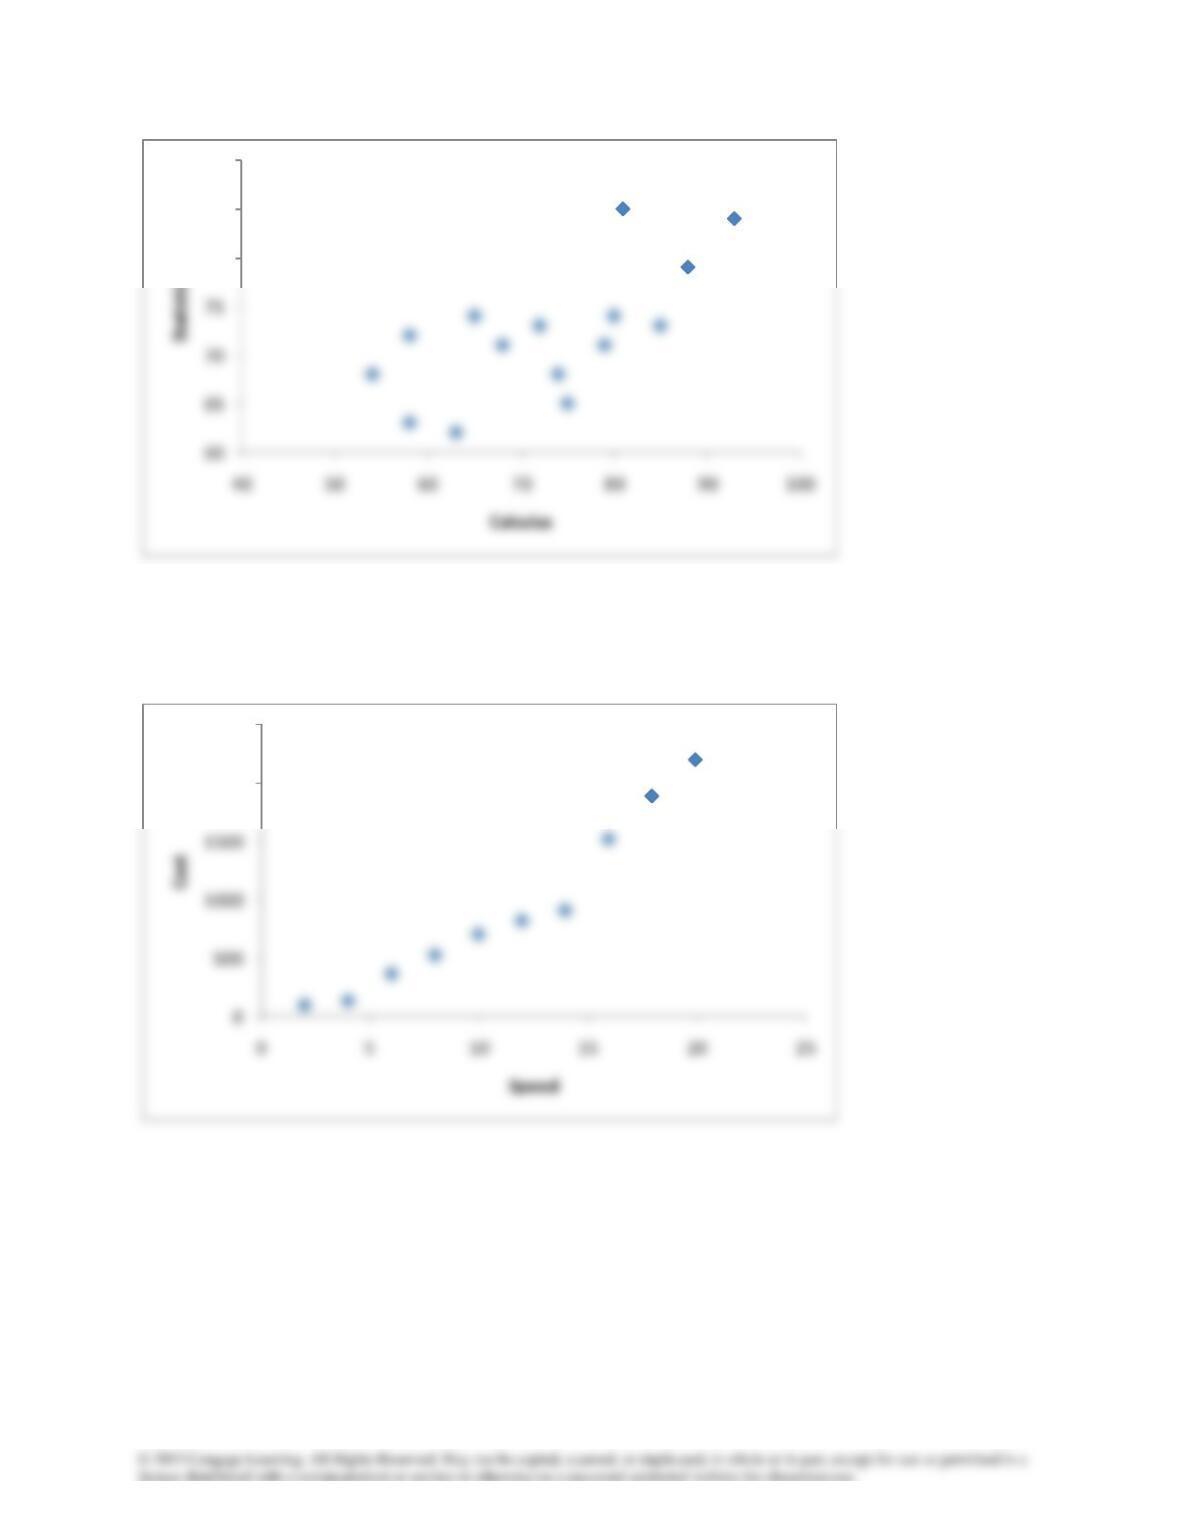
b. There is a positive linear relationship between calculus and statistics marks.
3.51
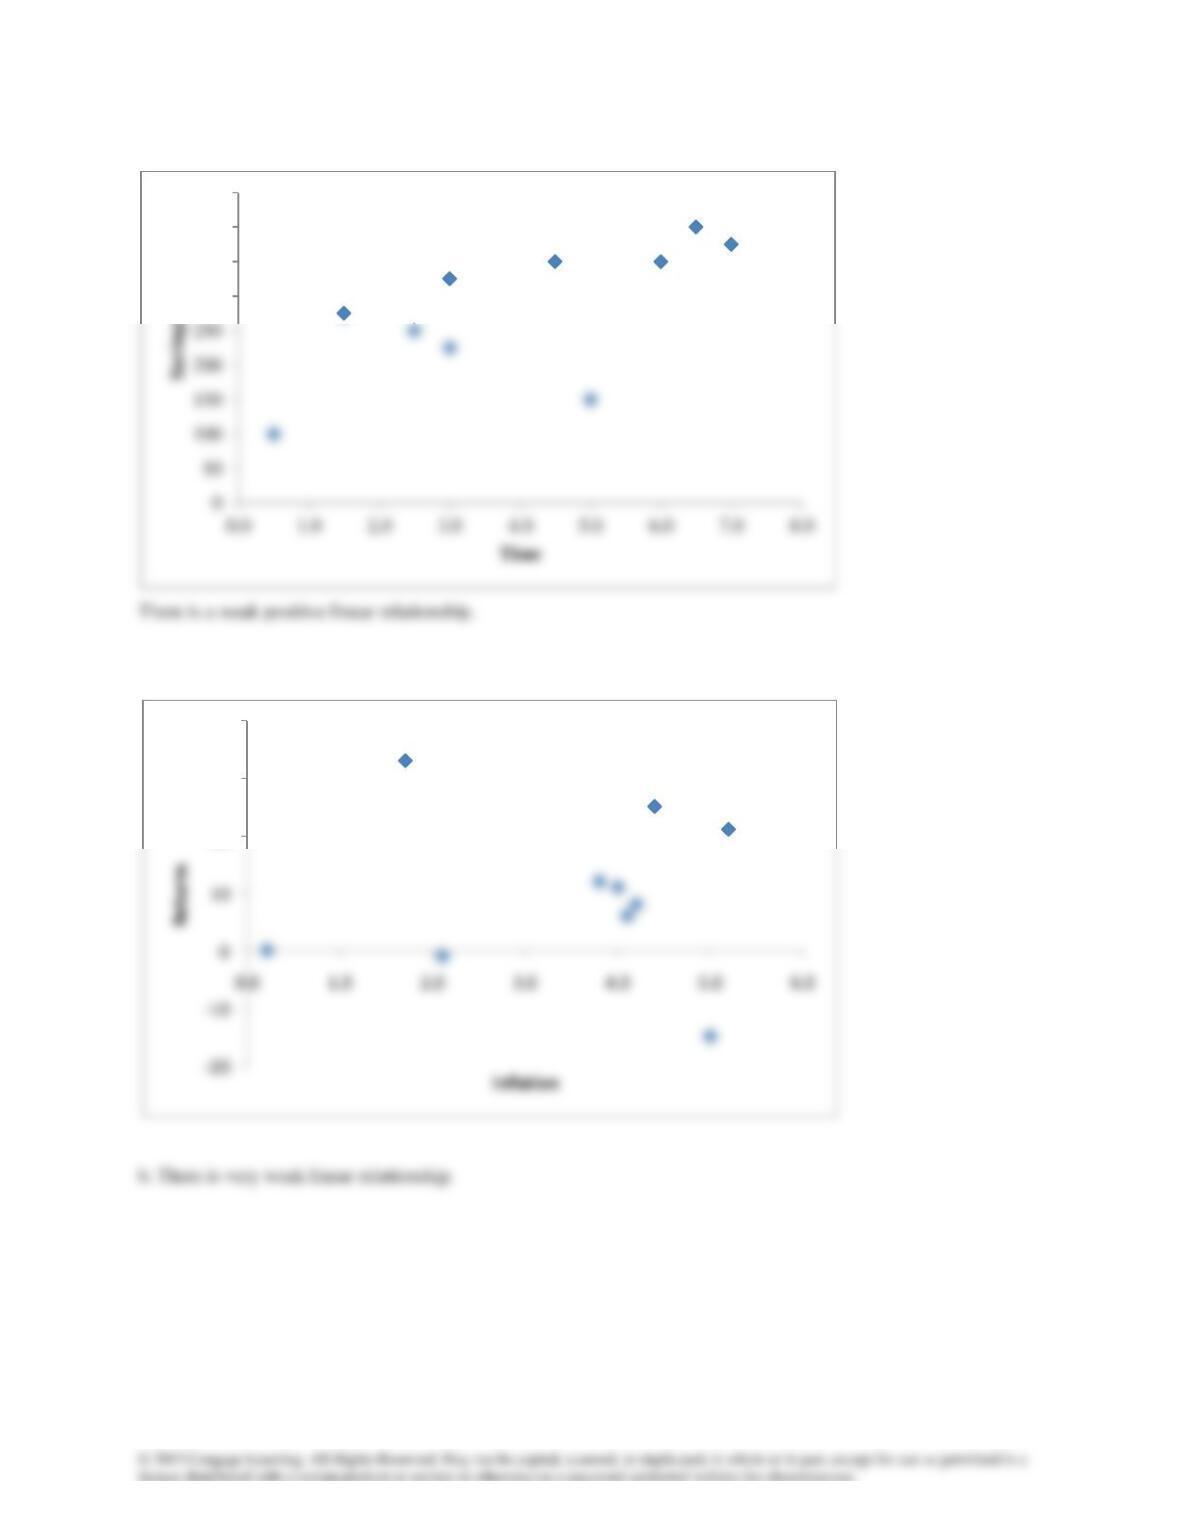
There is a strong positive linear relationship.
80
85
90
2000
2500
3.52a
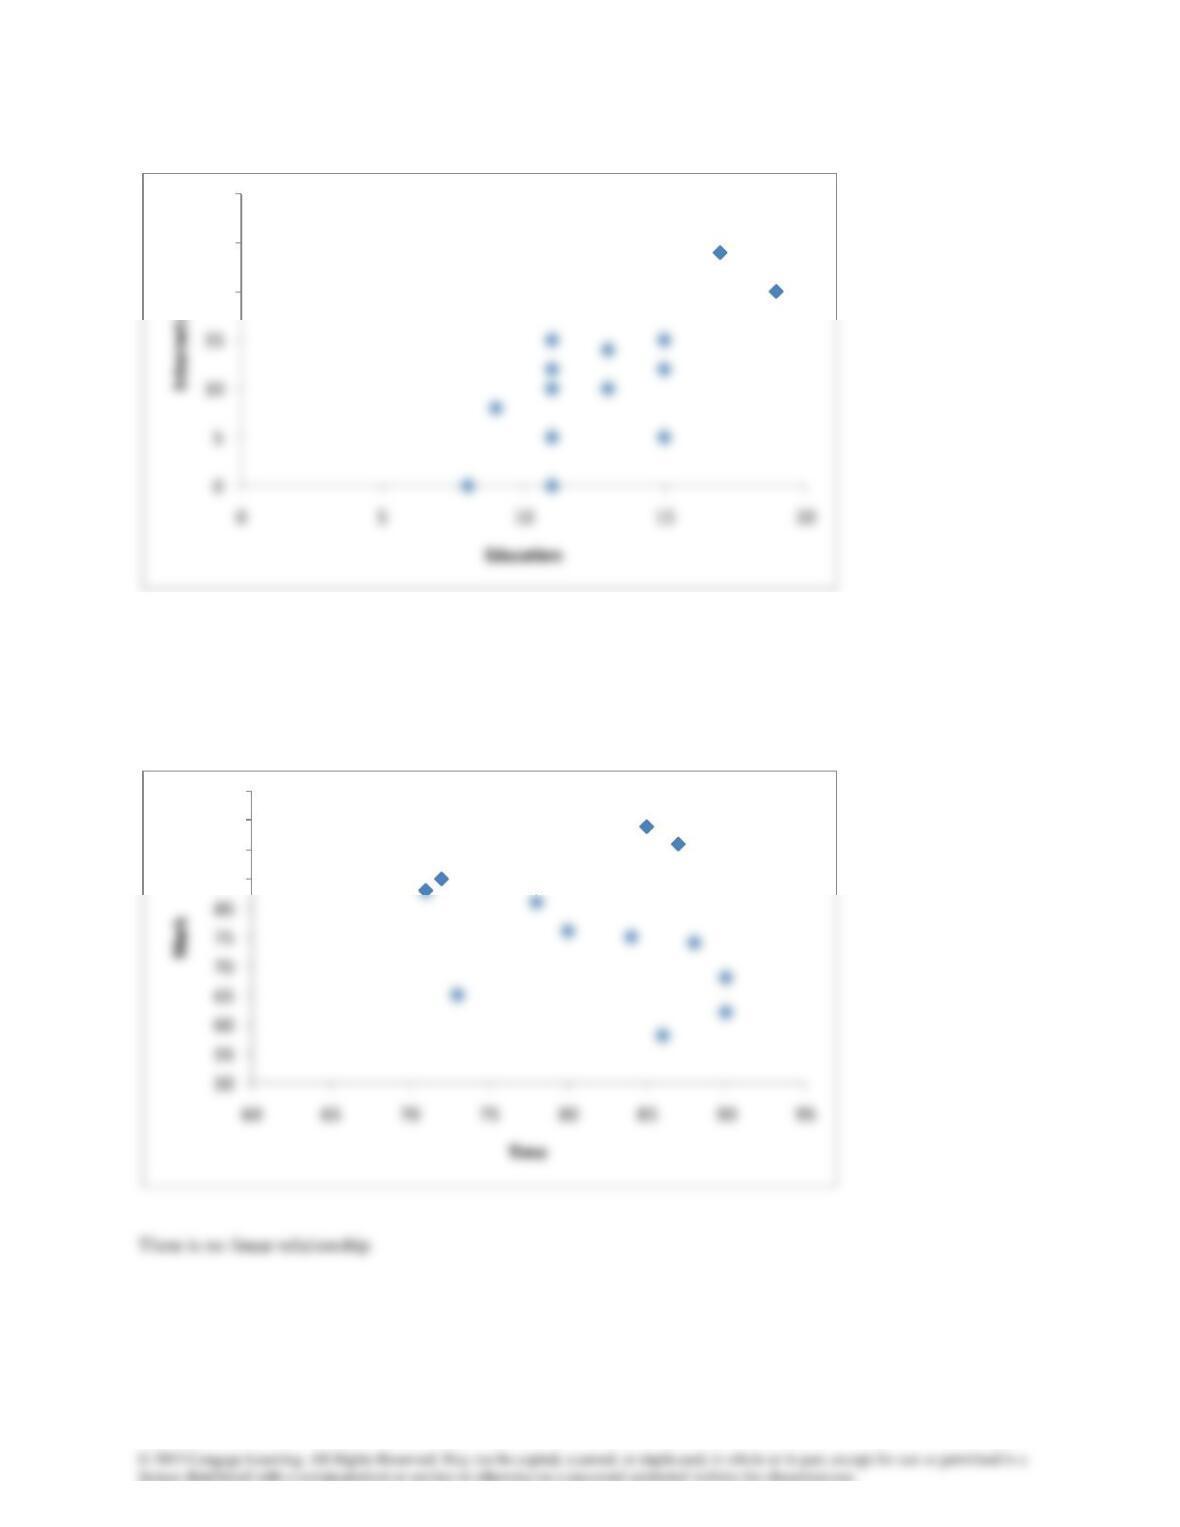
b. There is a moderately strong positive linear relationship. In general those with more education use the Internet
more frequently.
3.53
20
25
30
85
90
95
100
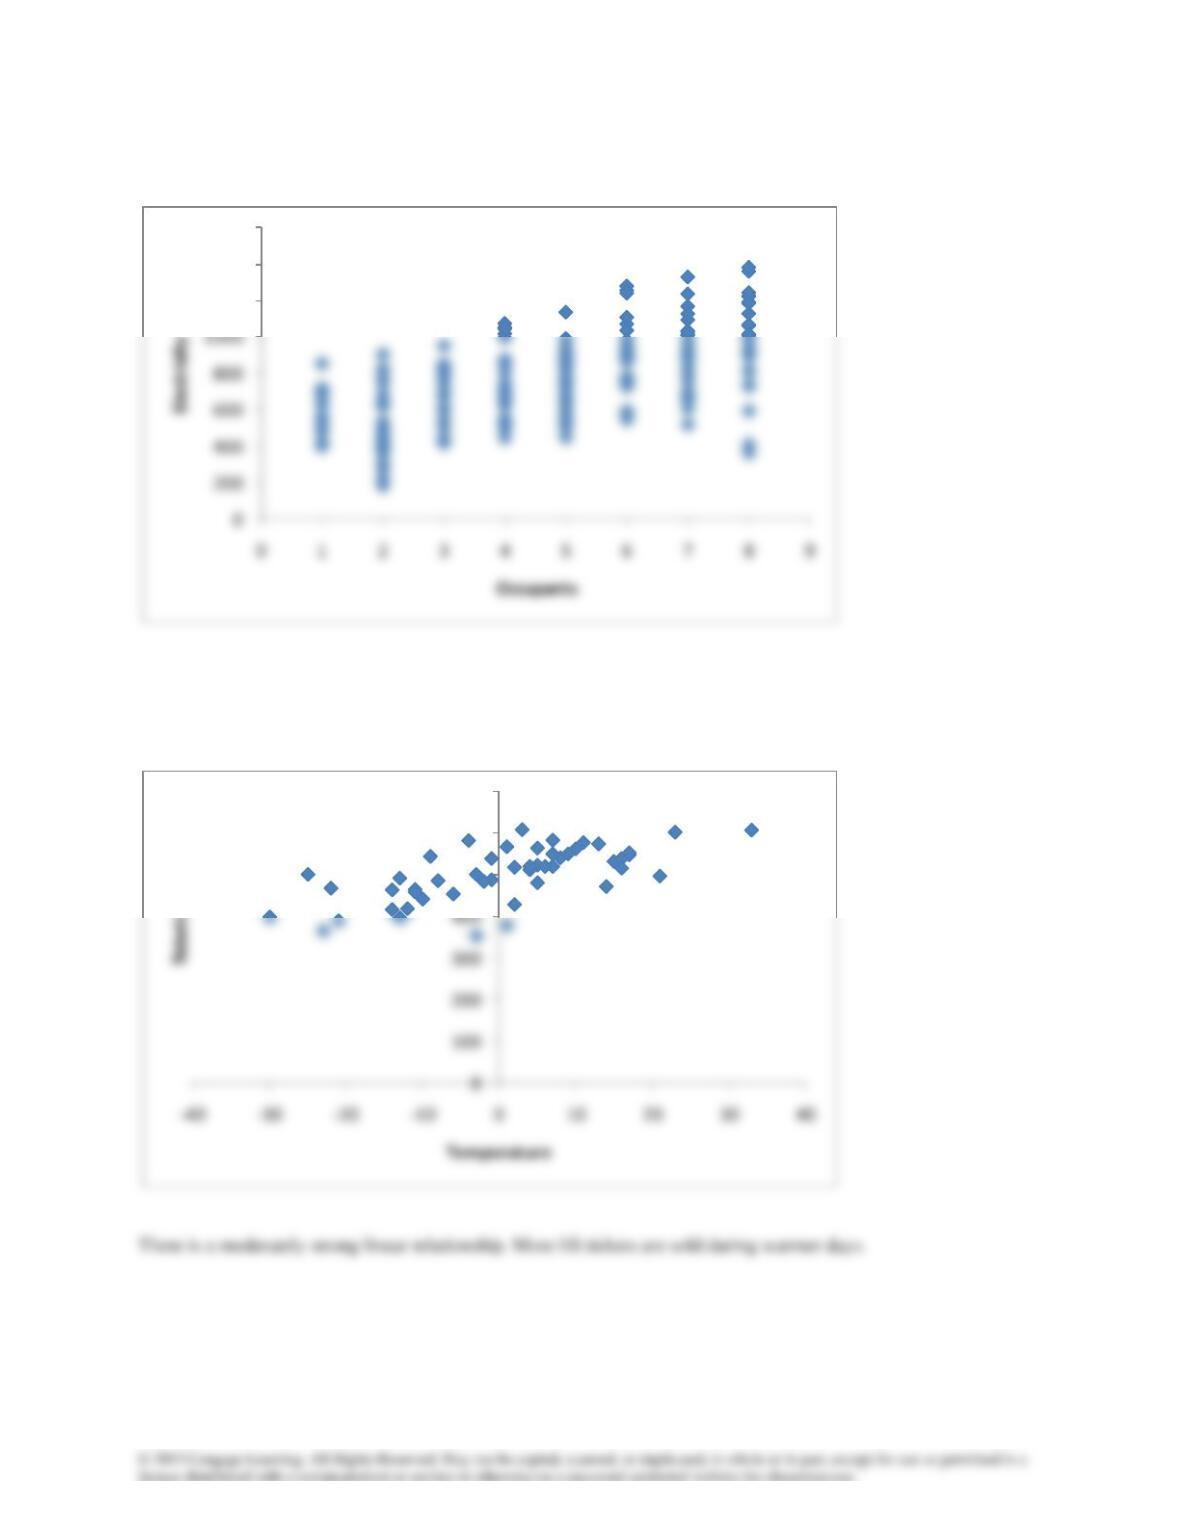
3.54a
b. There is a moderately strong positive linear relationship.
3.55
1200
1400
1600
500
600
700
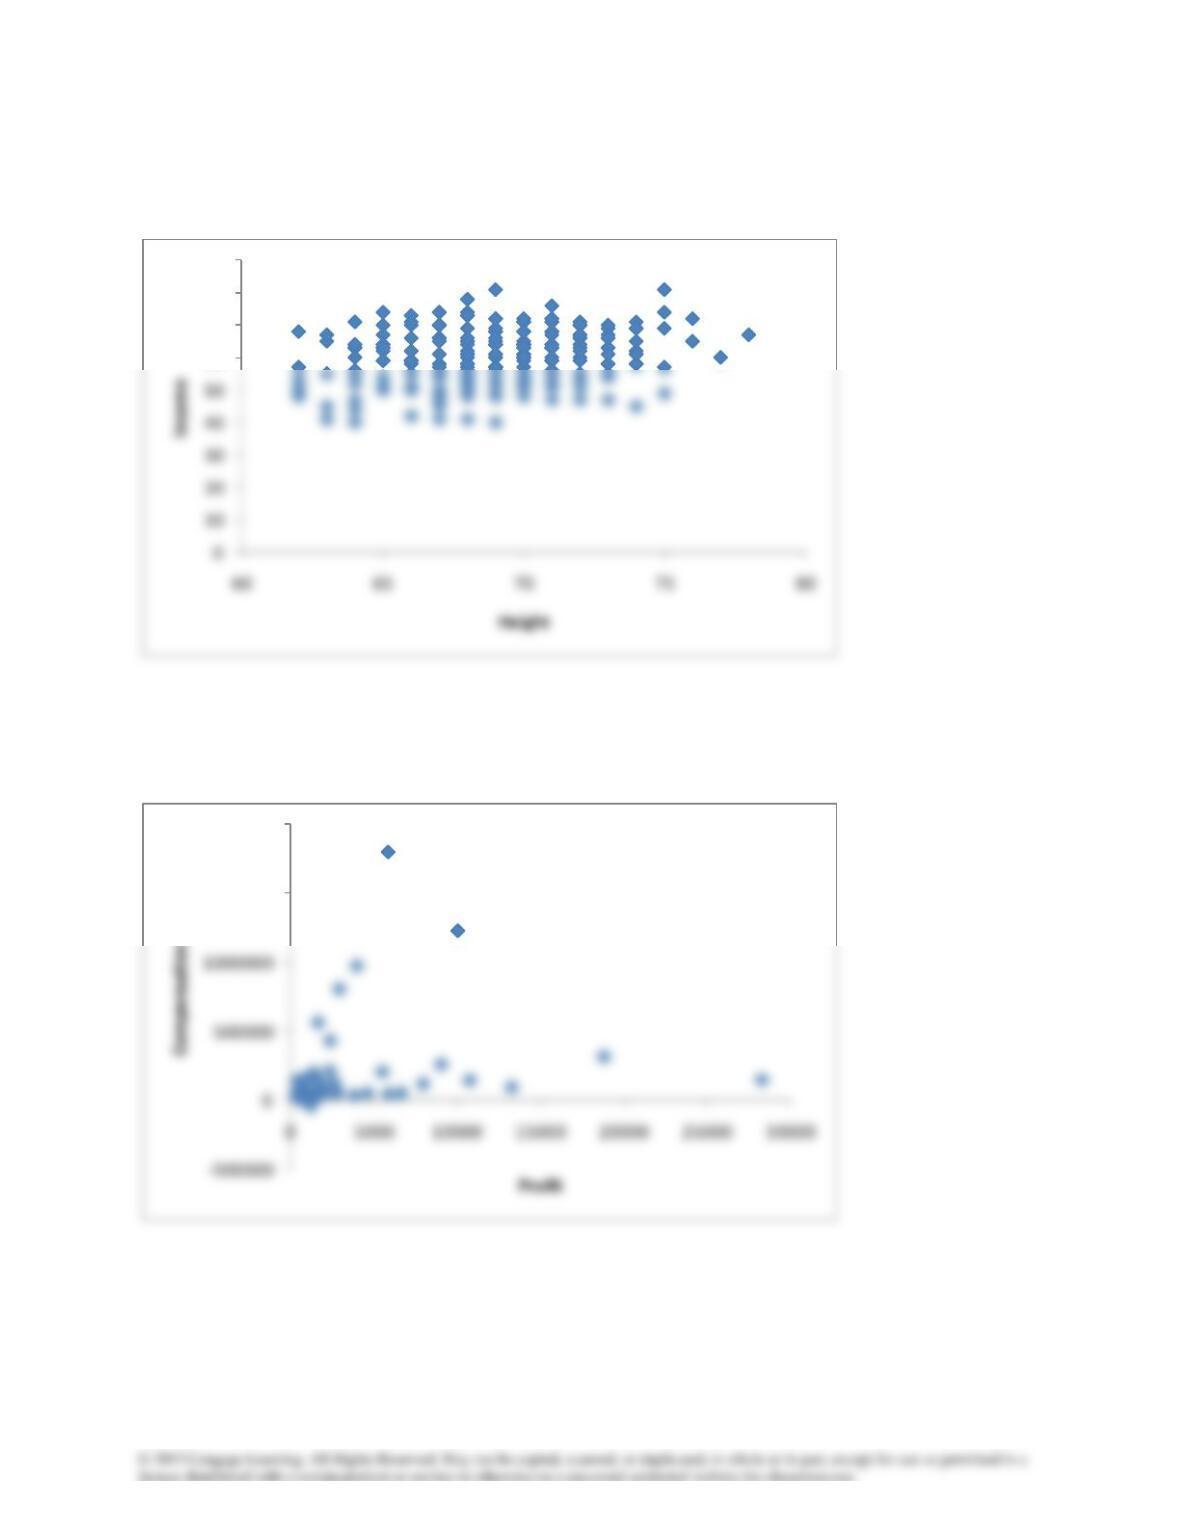
3.56a
b. There is a very weak positive linear relationship.
3.57
60
70
80
90
1500000
2000000
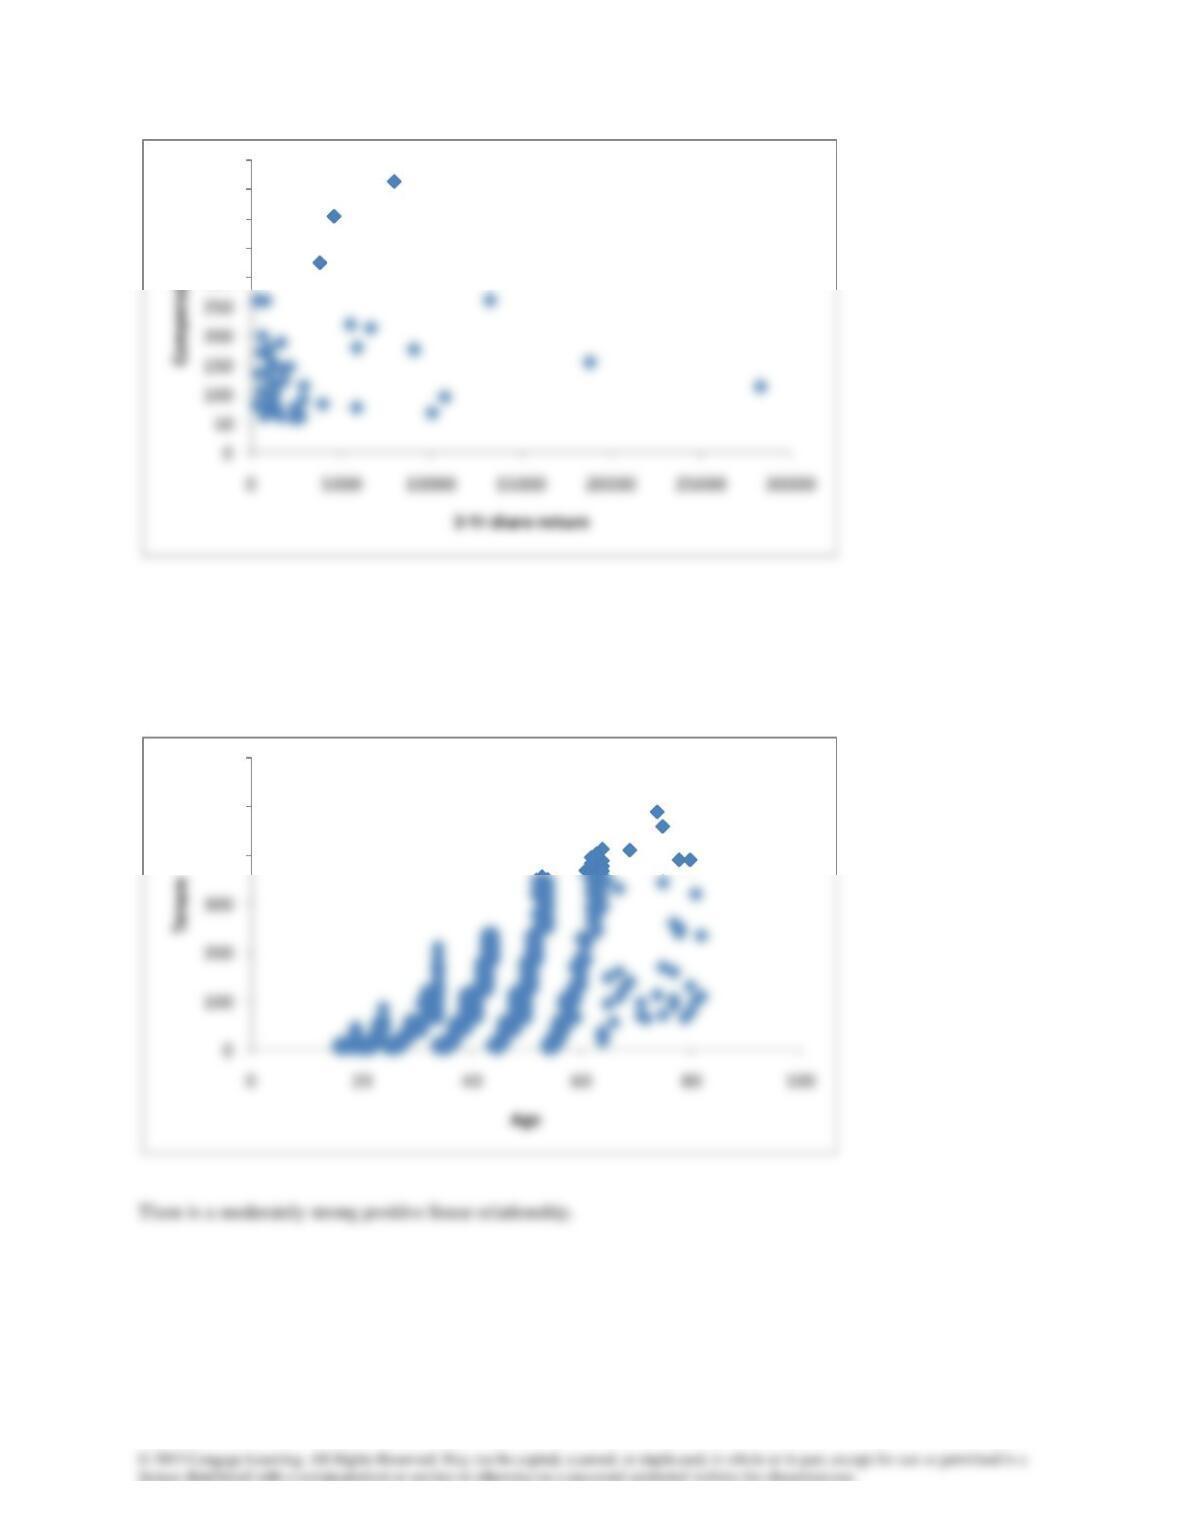
There does not appear to be a linear relationship between compensation of profit and between compensation and 3–
year share return.
3.58
300
350
400
450
500
400
500
600
3.59
3.60
2000
2500
3000
250
300
350
400
3.61
3.62
15
20
25
14
16
18
3.63
3.64
600
There does not appear to be a linear relationship.
600
700
800
900
1000
700
800
900
1000
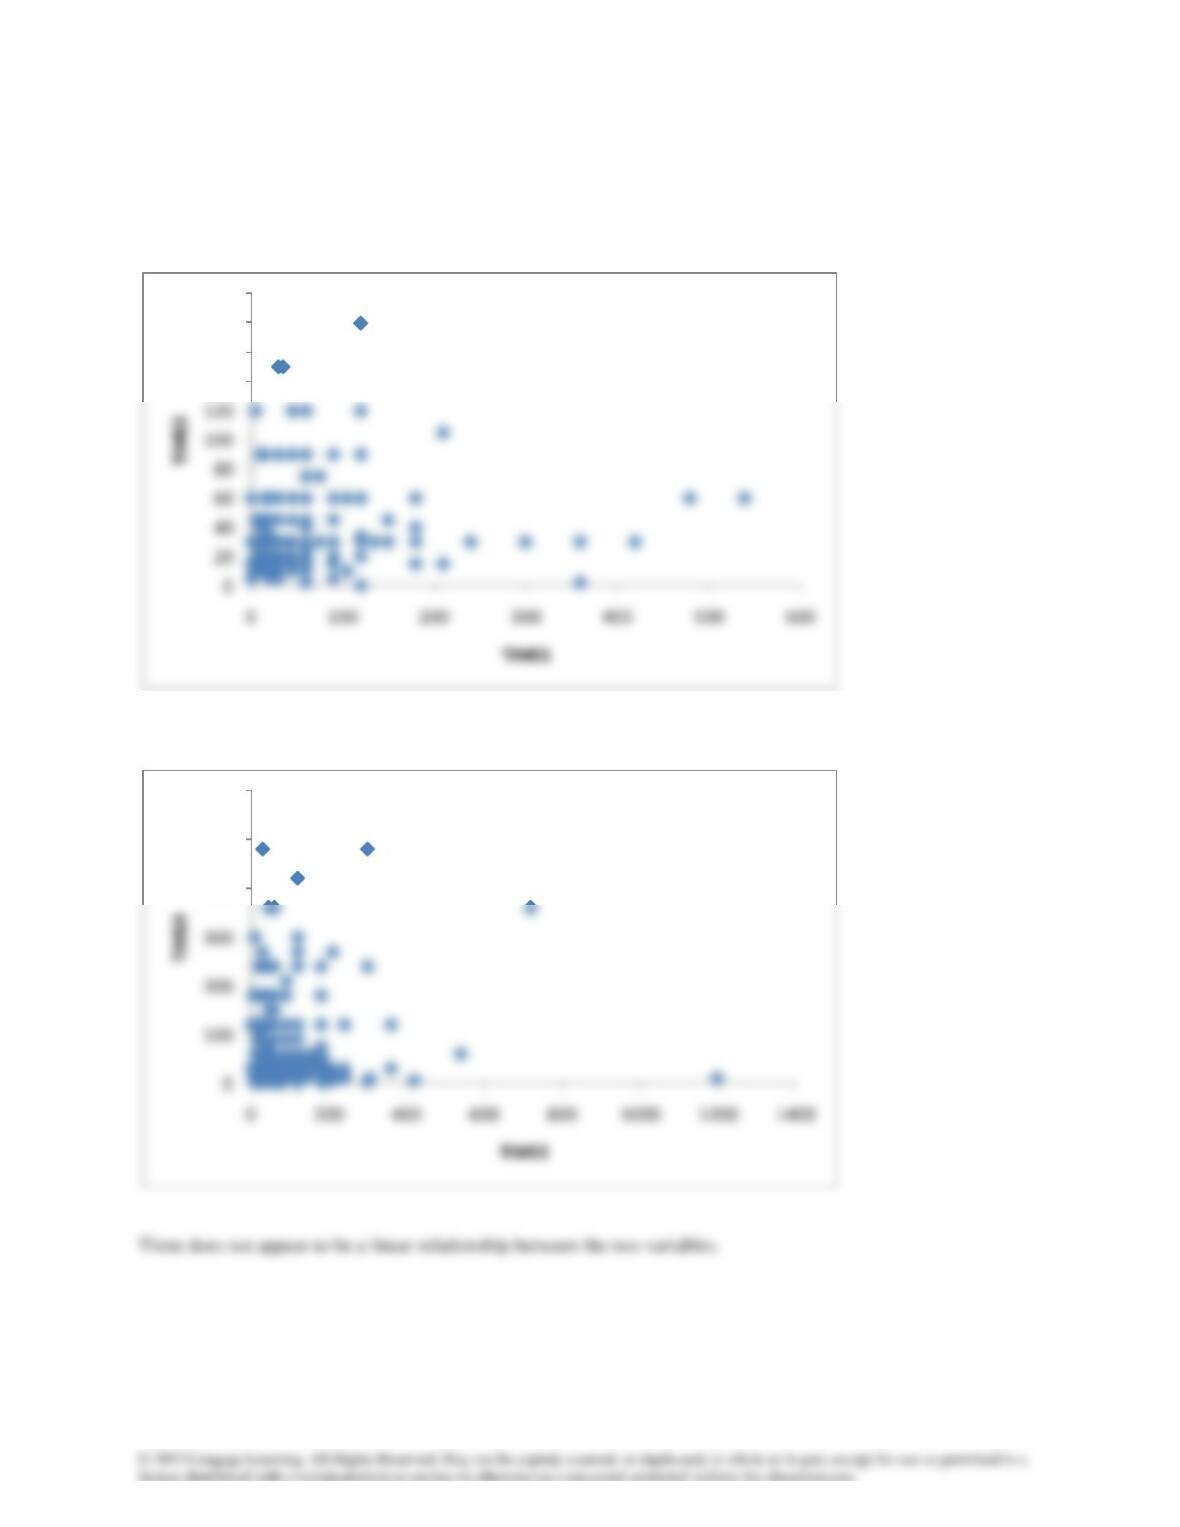
3.65There is one person who claimed to spend 600 minutes on an average day reading a printed newspaper. This is
probably an error. We deleted that number and drew a new scatter diagram. There now appears to be a weak positive
linear relationship.
3.66
140
160
180
200
400
500
600
3.67
3.68
300
400
500
600
15
20
25
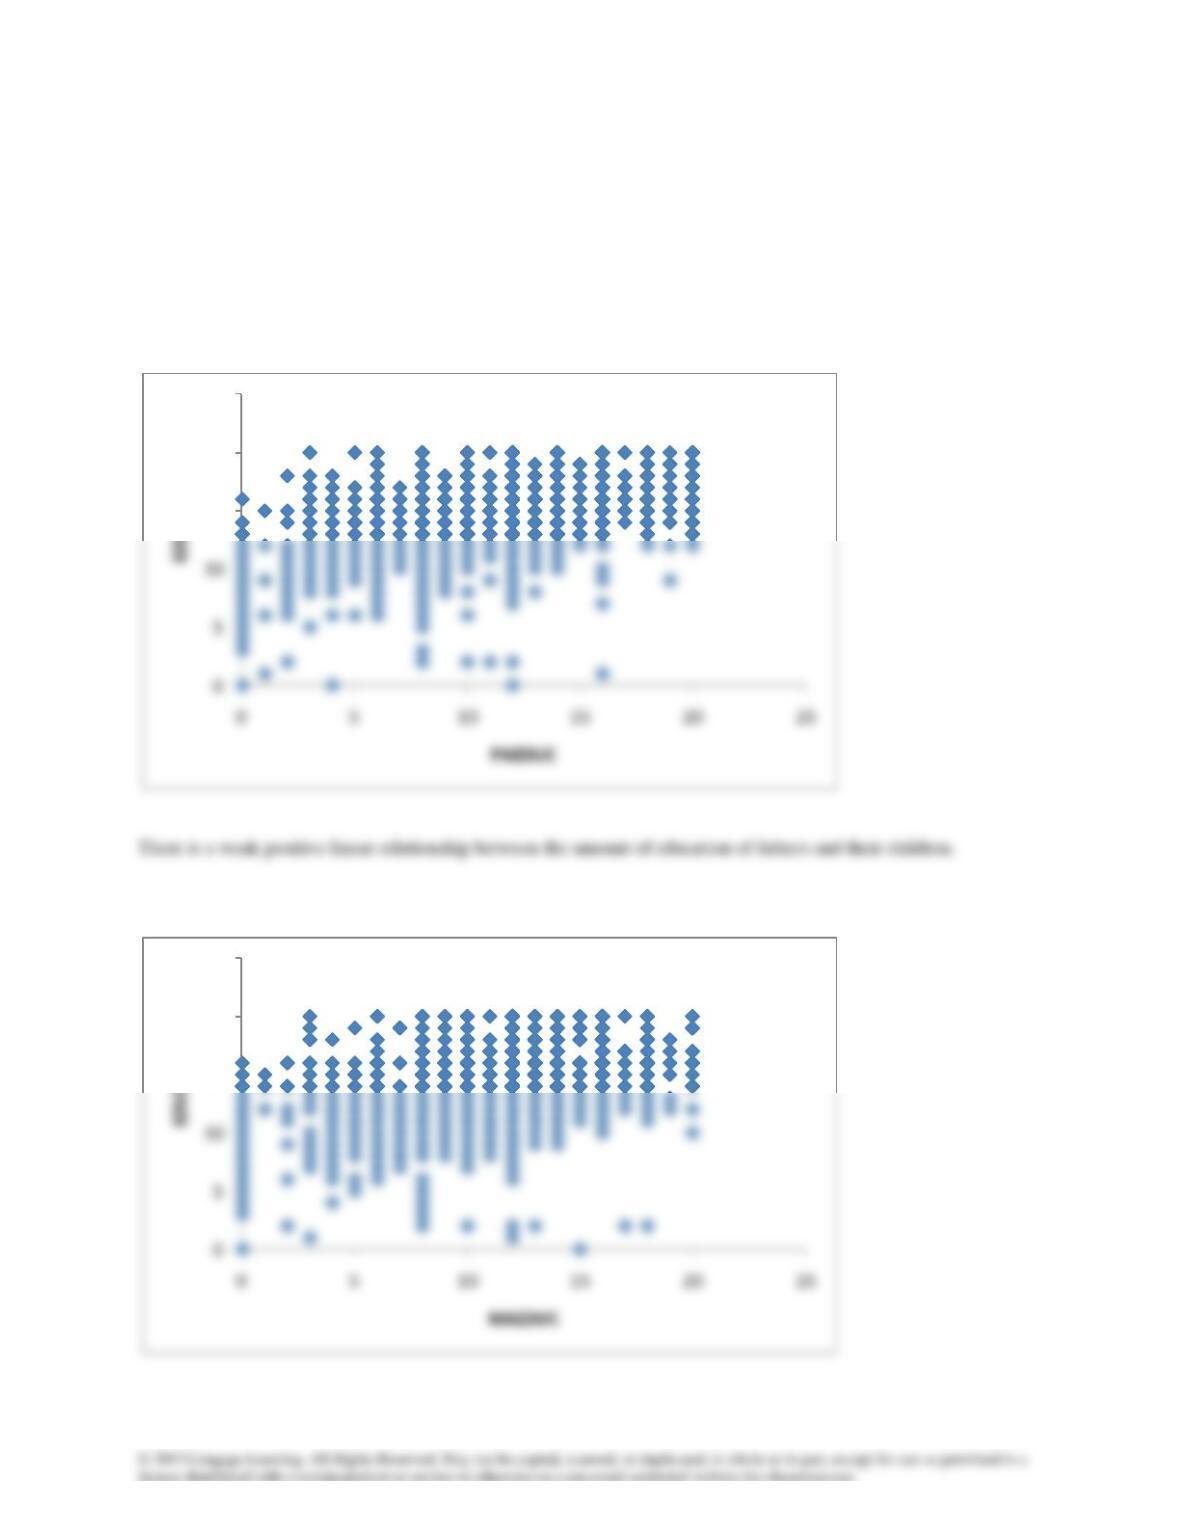
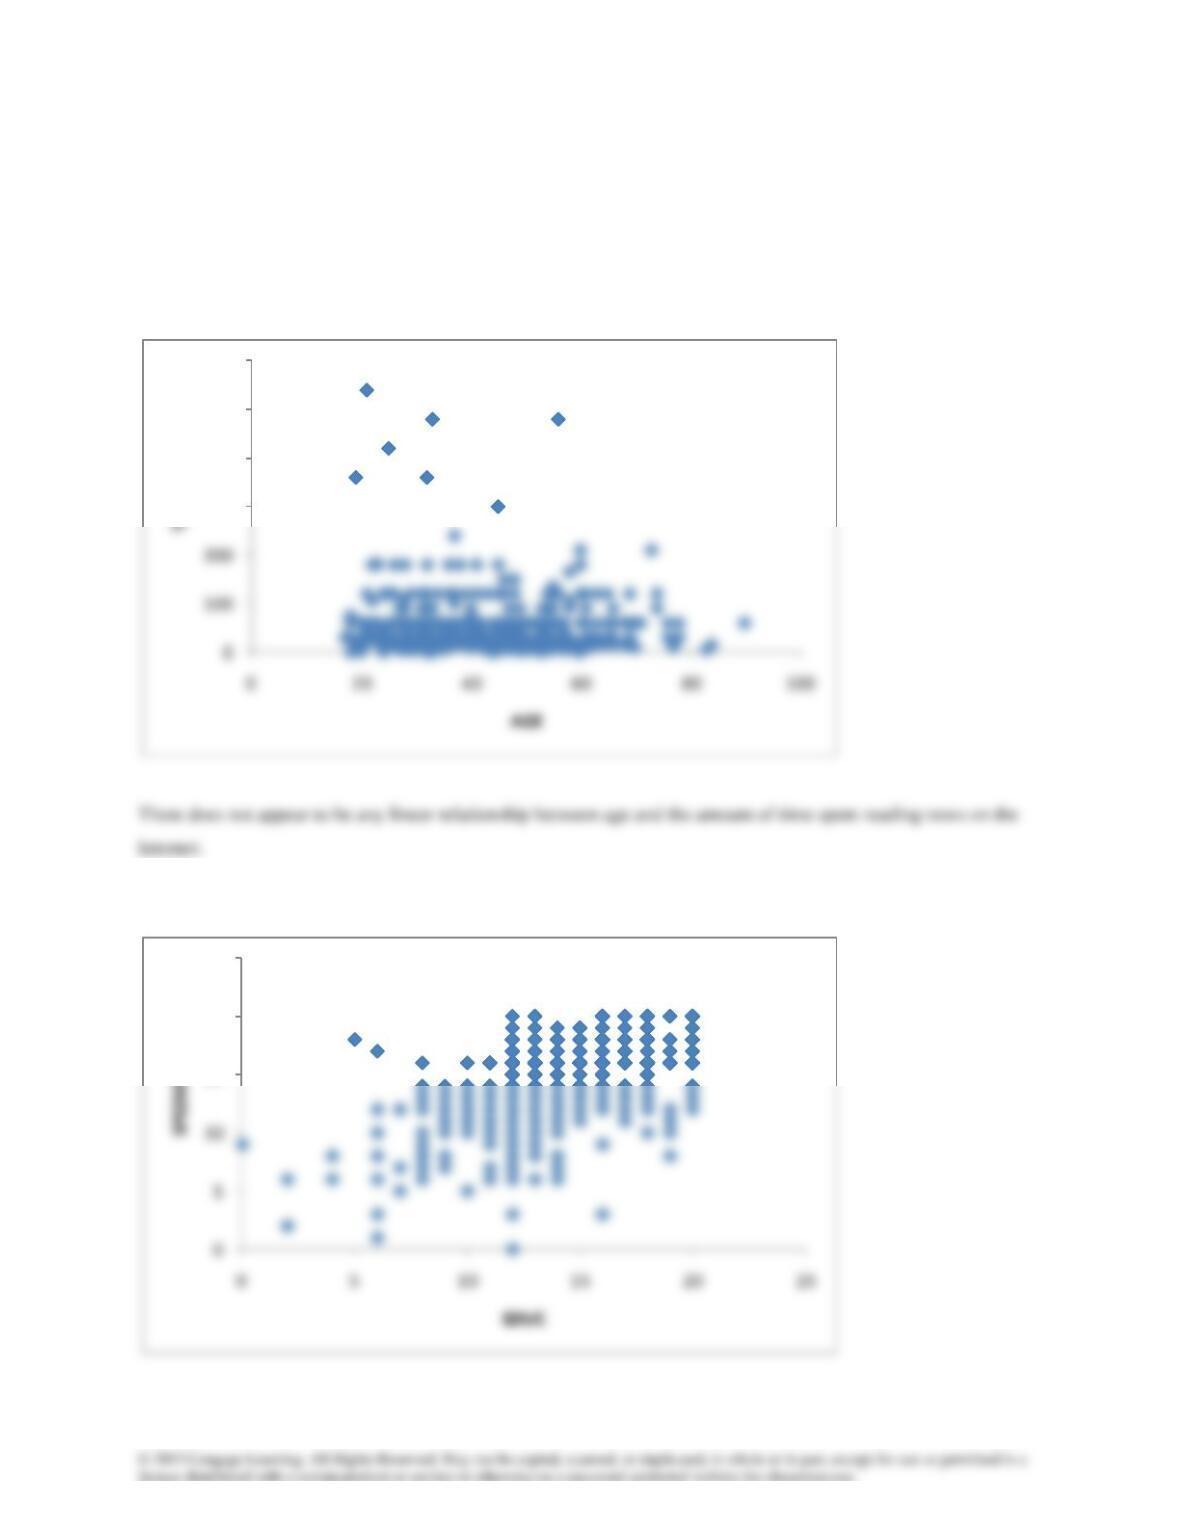
There is a moderately strong positive linear relationship between the education levels of spouses.
3.69
3.70
15
20
25
15
20
25
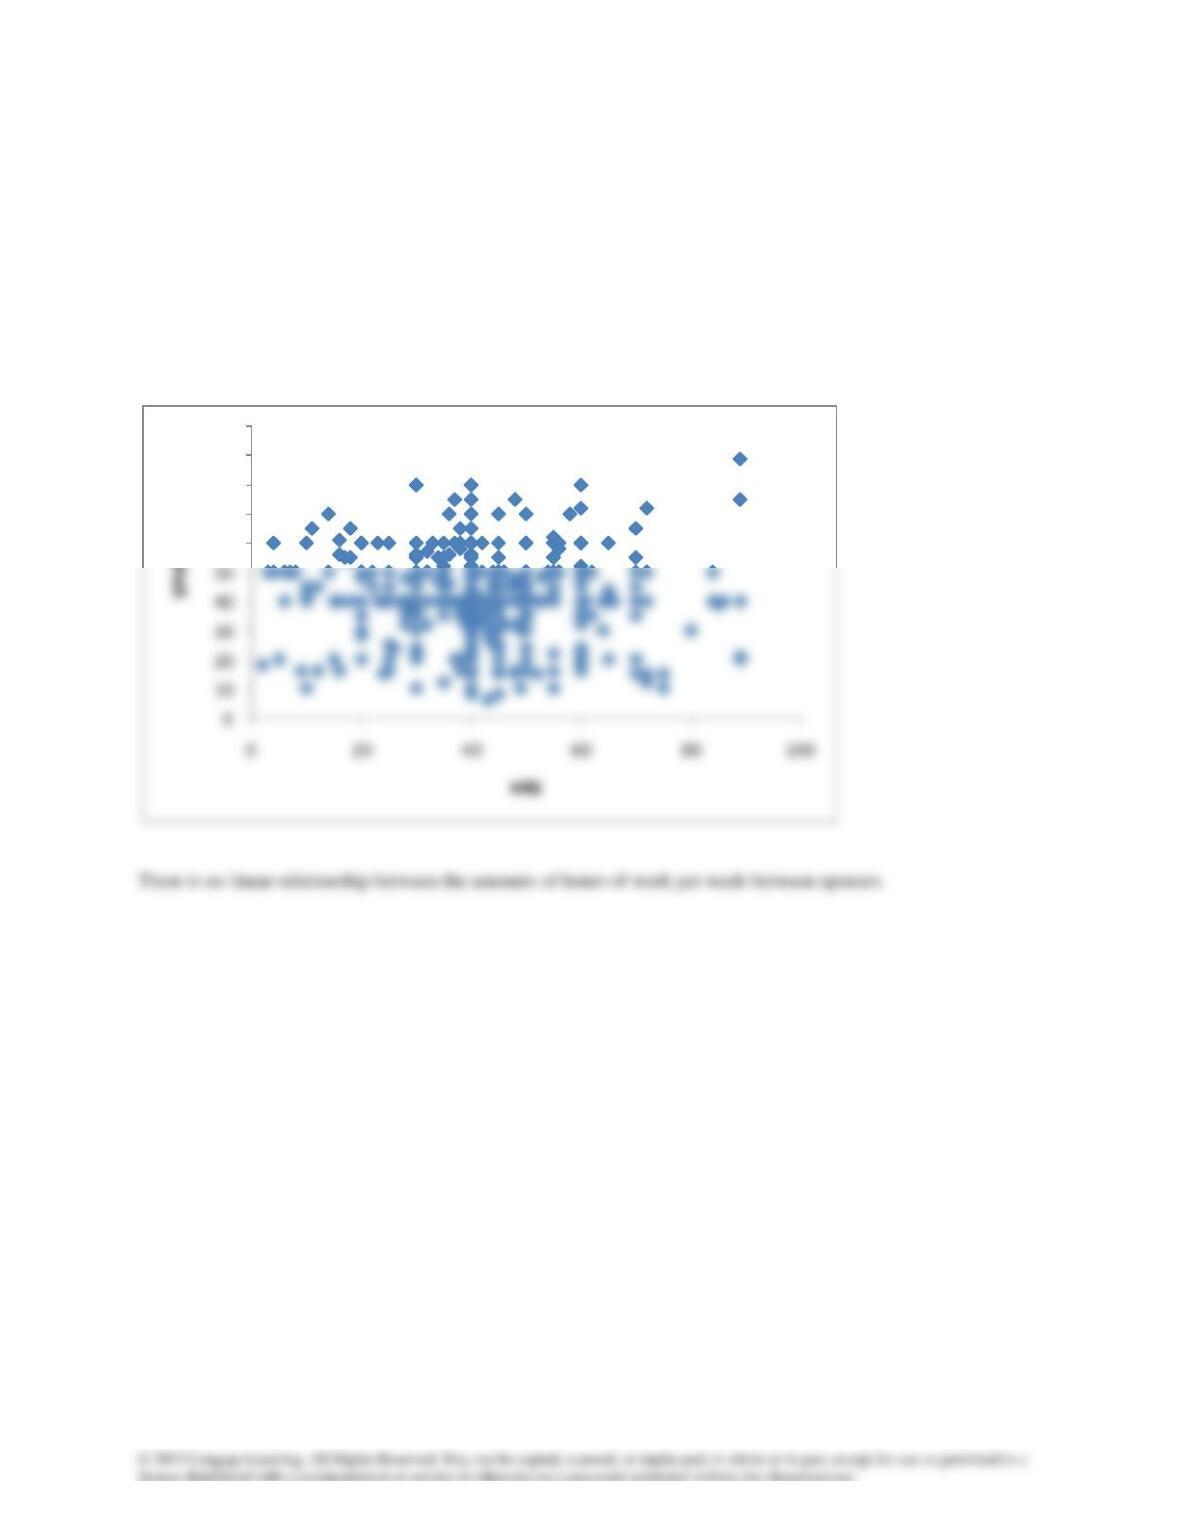
There is a weak positive linear relationship between the amount of education of mothers and their children.
3.71
3.72 Region: Sales last year
60
70
80
90
100
Region: Sales previous year
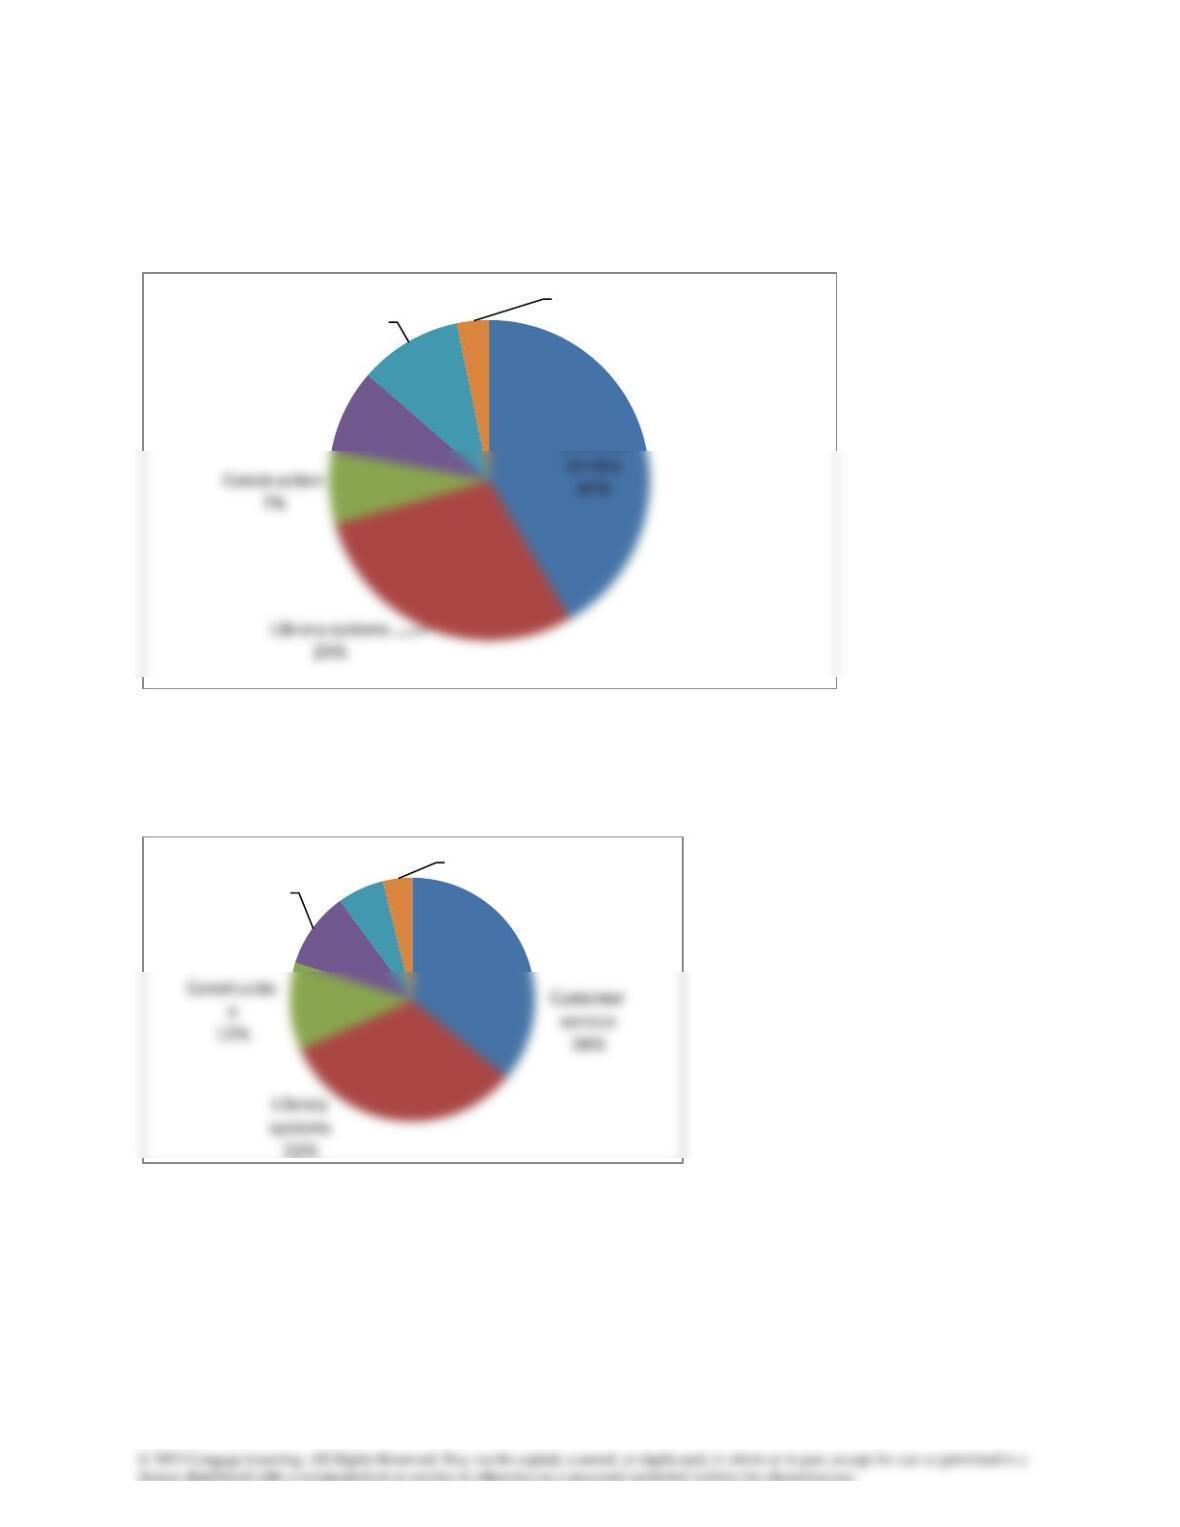
The pie charts were drawn so that the area in each pie is proportion to the total sales in each year.
For example to draw the first pie chart we solved for the radius as follows.
Australasia
17%
United
States
38%
Austral
asia
10%
We draw the pie charts for the divisions in each year in the same way.
Division: Sales last year
Division: Sales previous year
3.73a
Customer
Manufacturing
9%
Financial
systems
10%
Hotels and
clubs
3%
Manufactur
ing
10%
Financial
systems
6%
Hotels and
clubs
4%