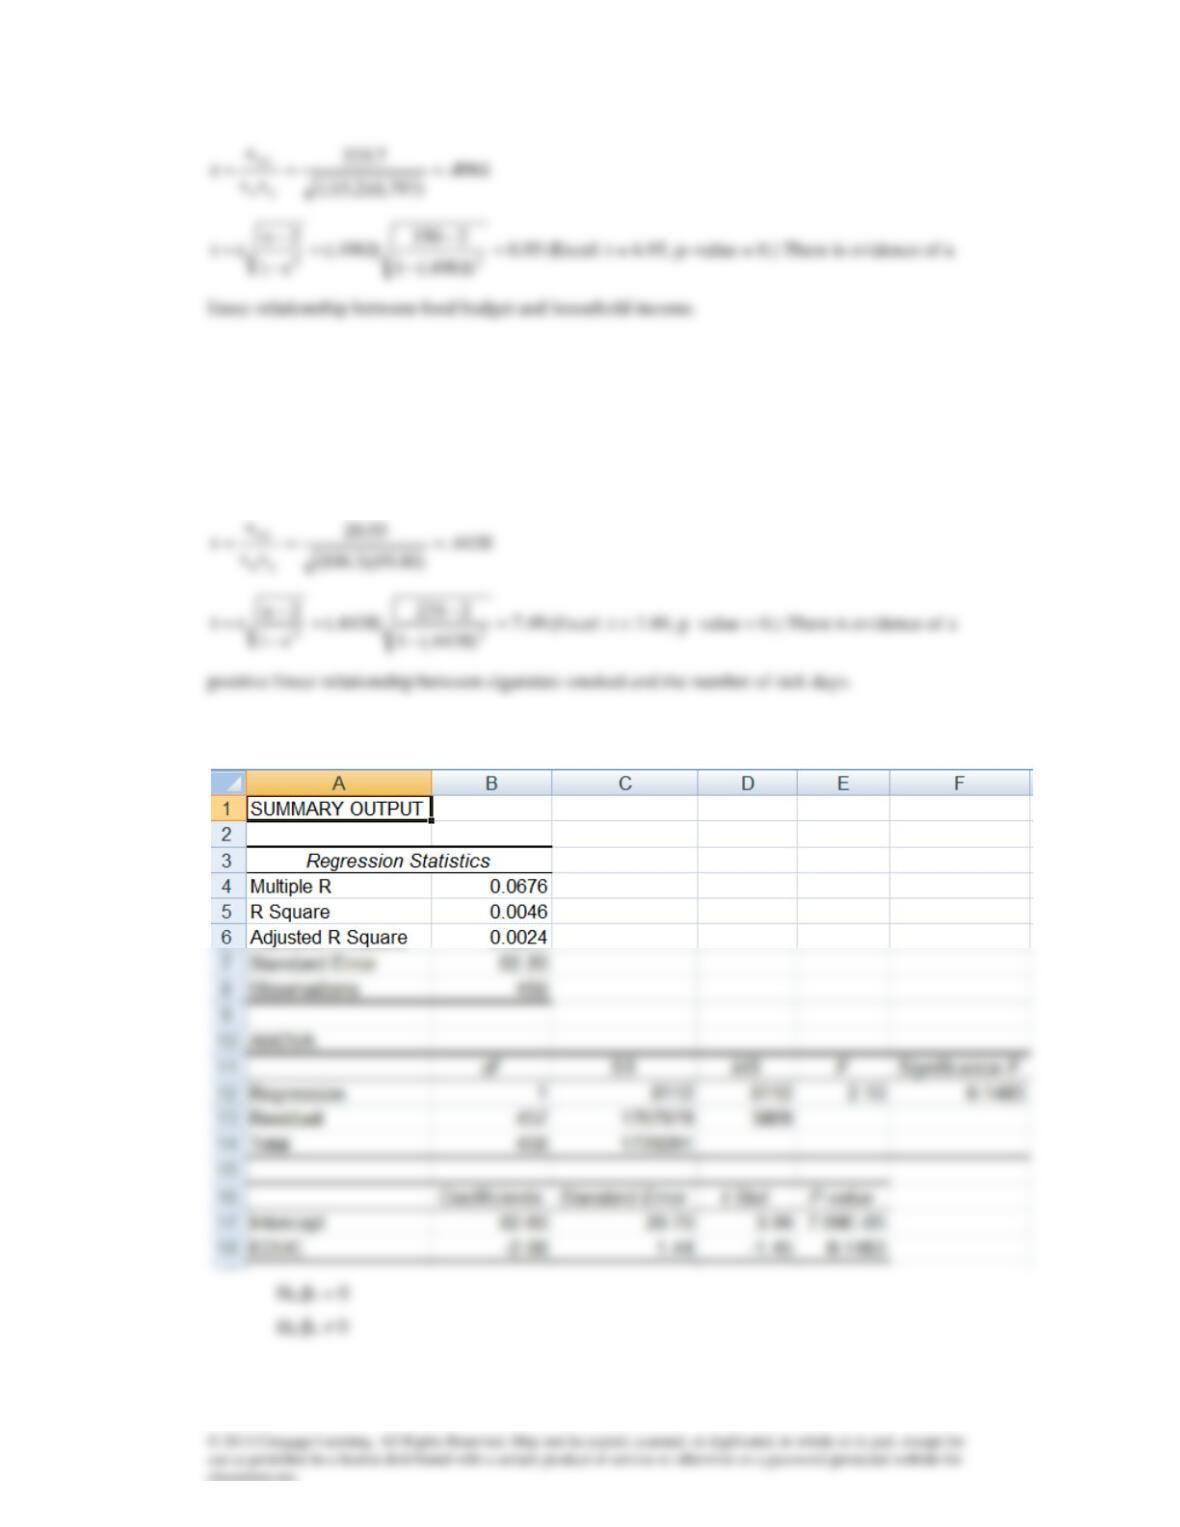
16.44
0:H0=
0:H1
Rejection region:
645.1ttt 229,05.2n, = −
16.45
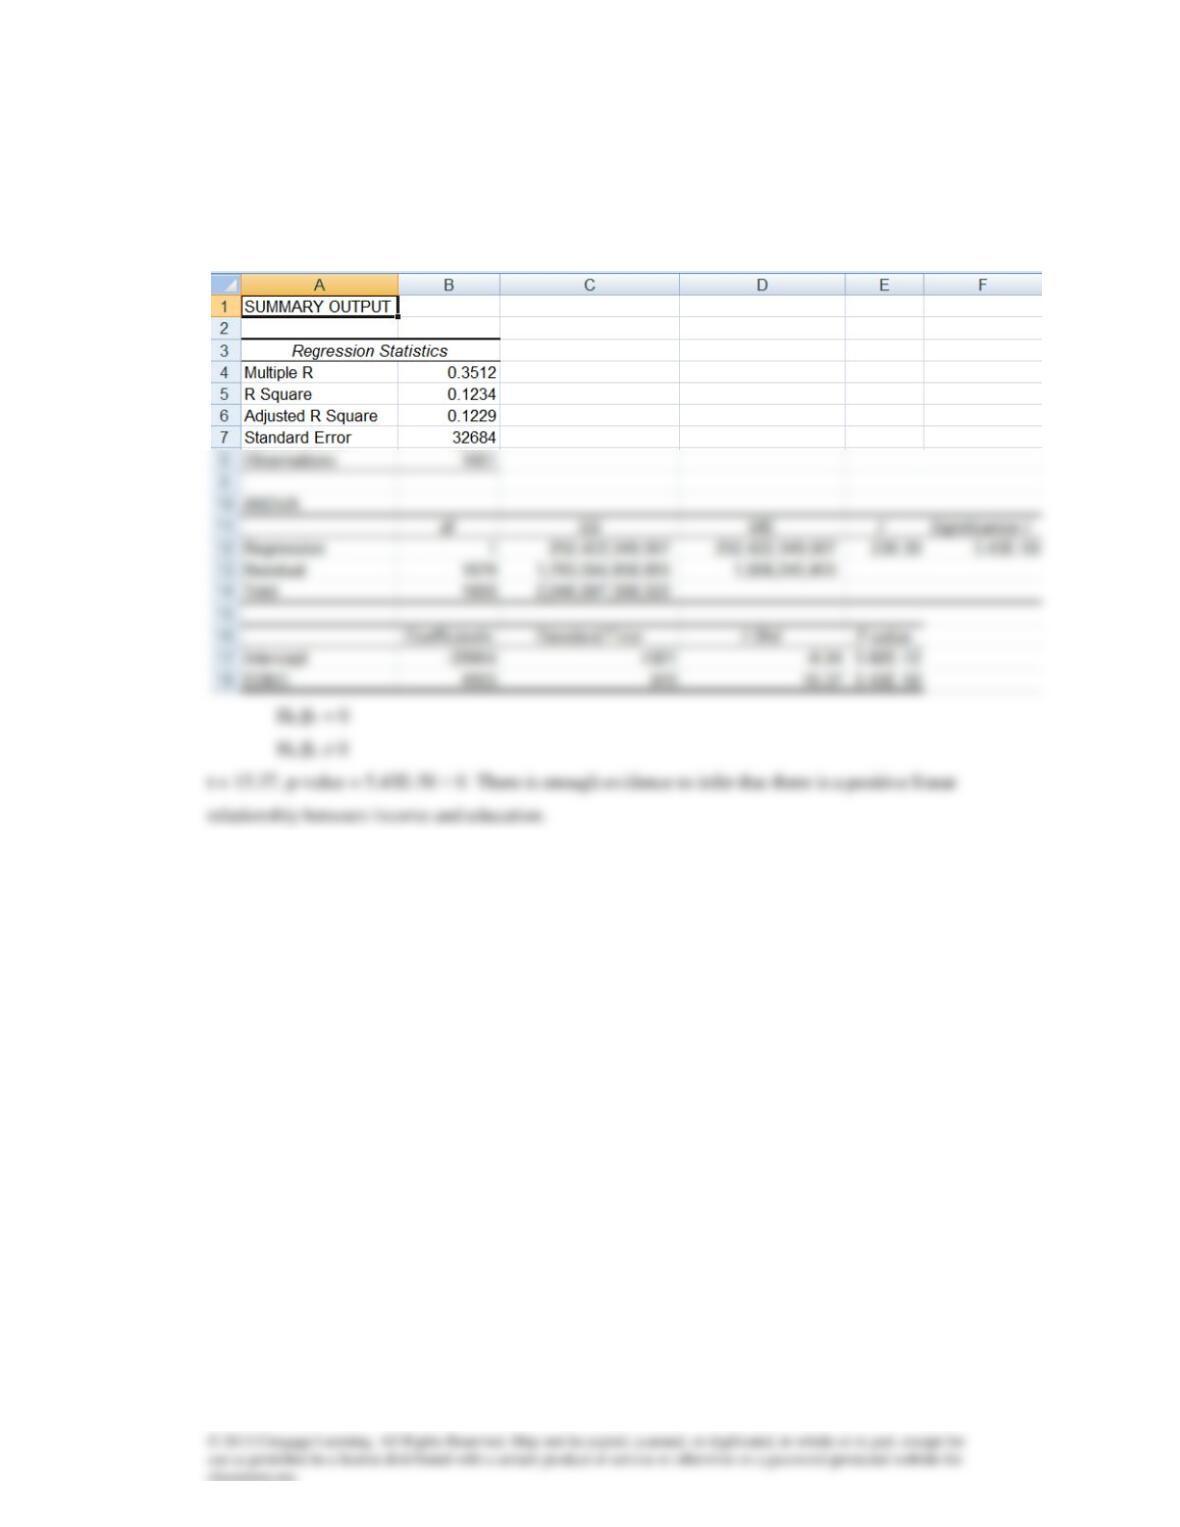
t = -1.45. There is not enough evidence to conclude that the more education one has the more one
watches news on the Internet. If anything the opposite appears to be the case.
16.46
16.47
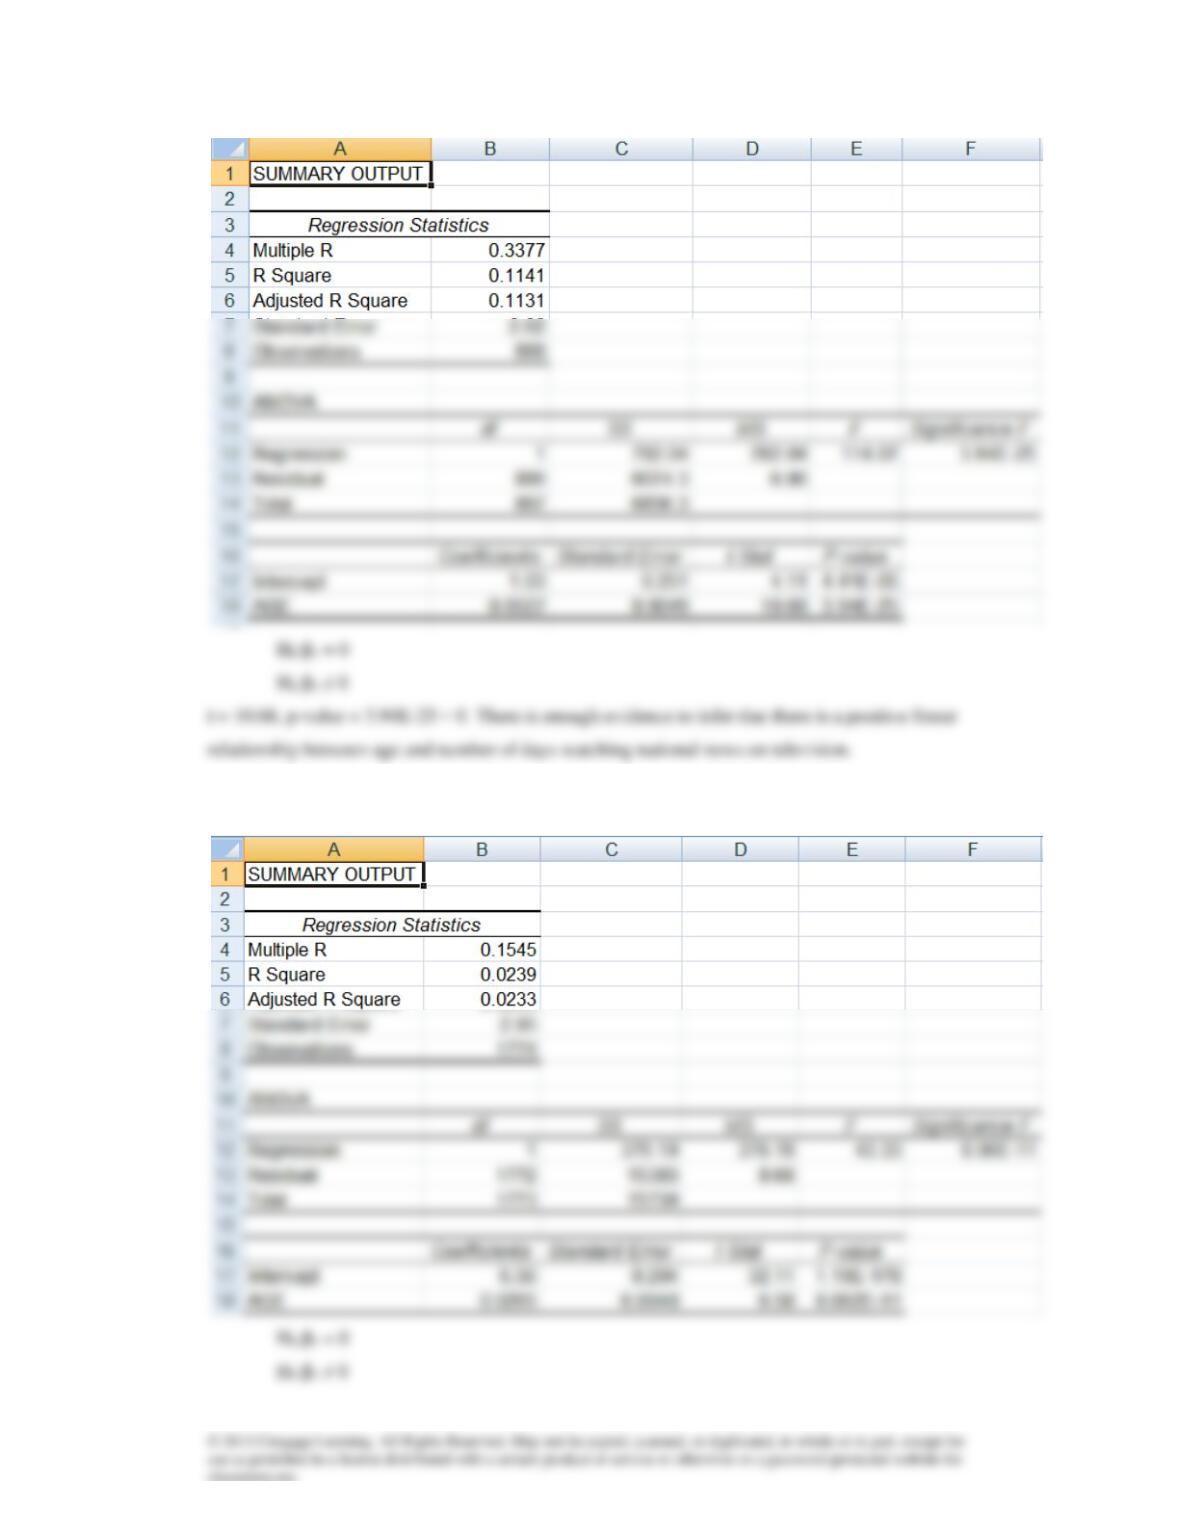
16.48
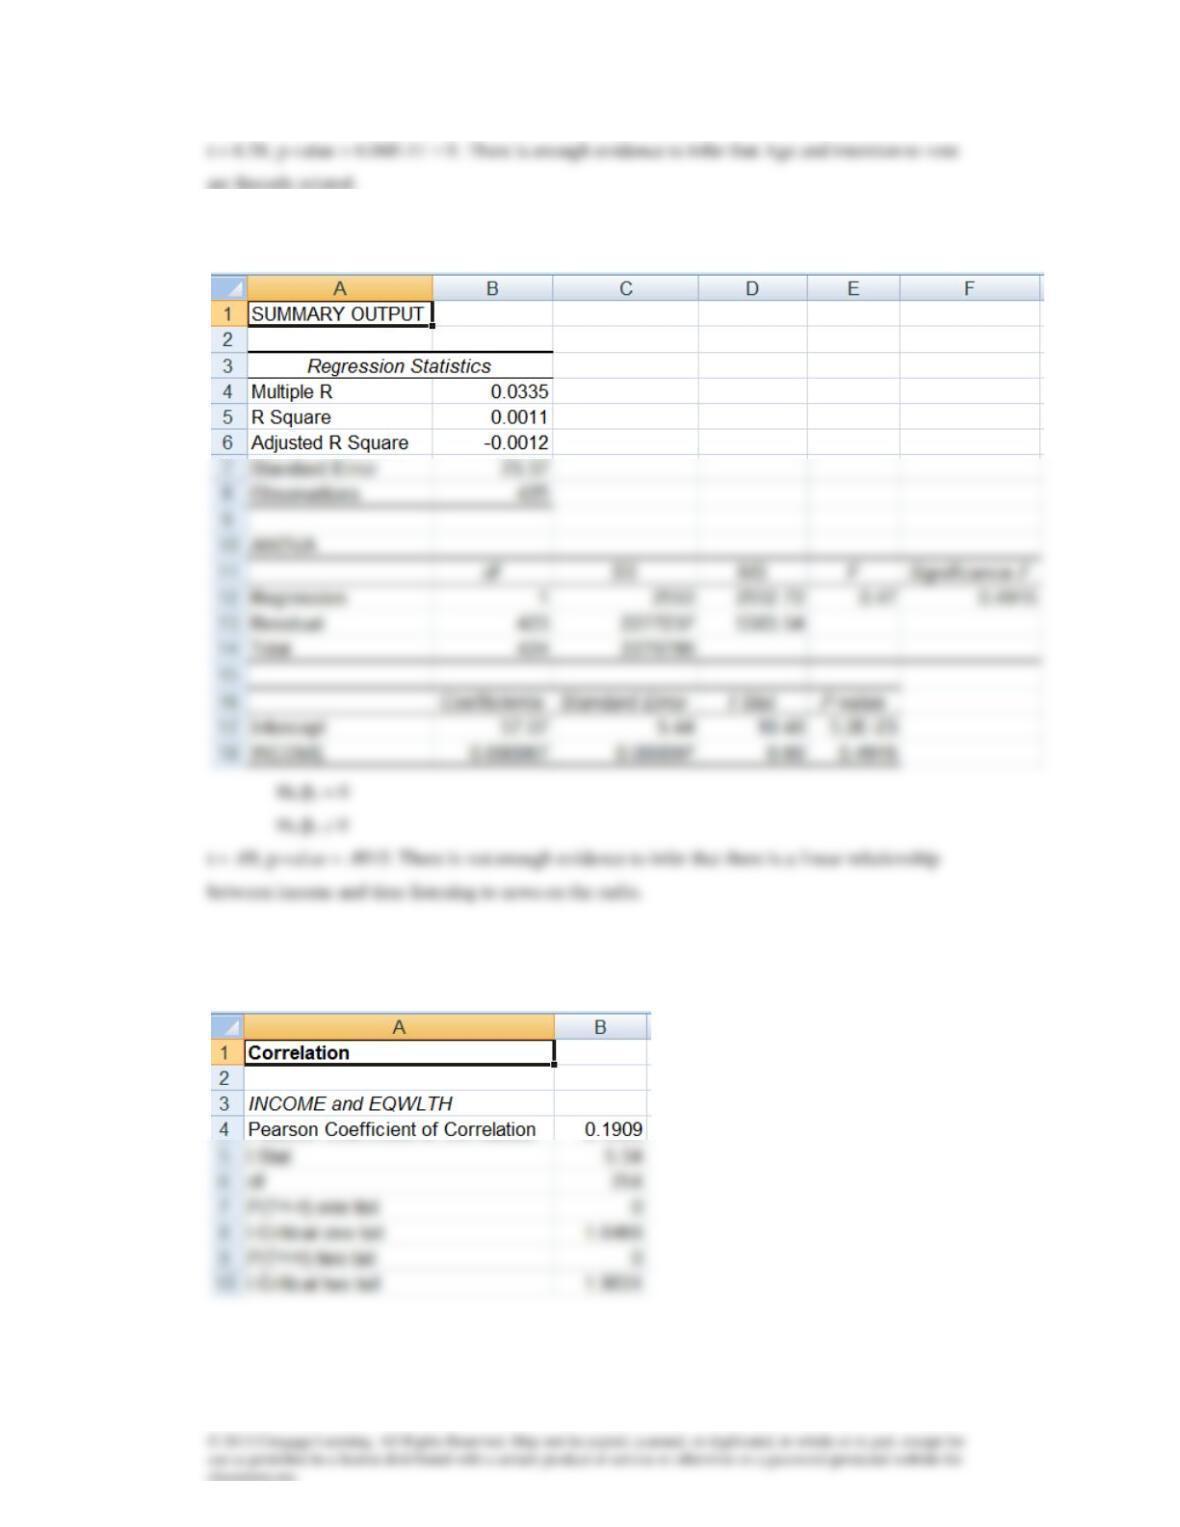
16.49
16.50 H0:ρ = 0
H1:ρ ≠ 0
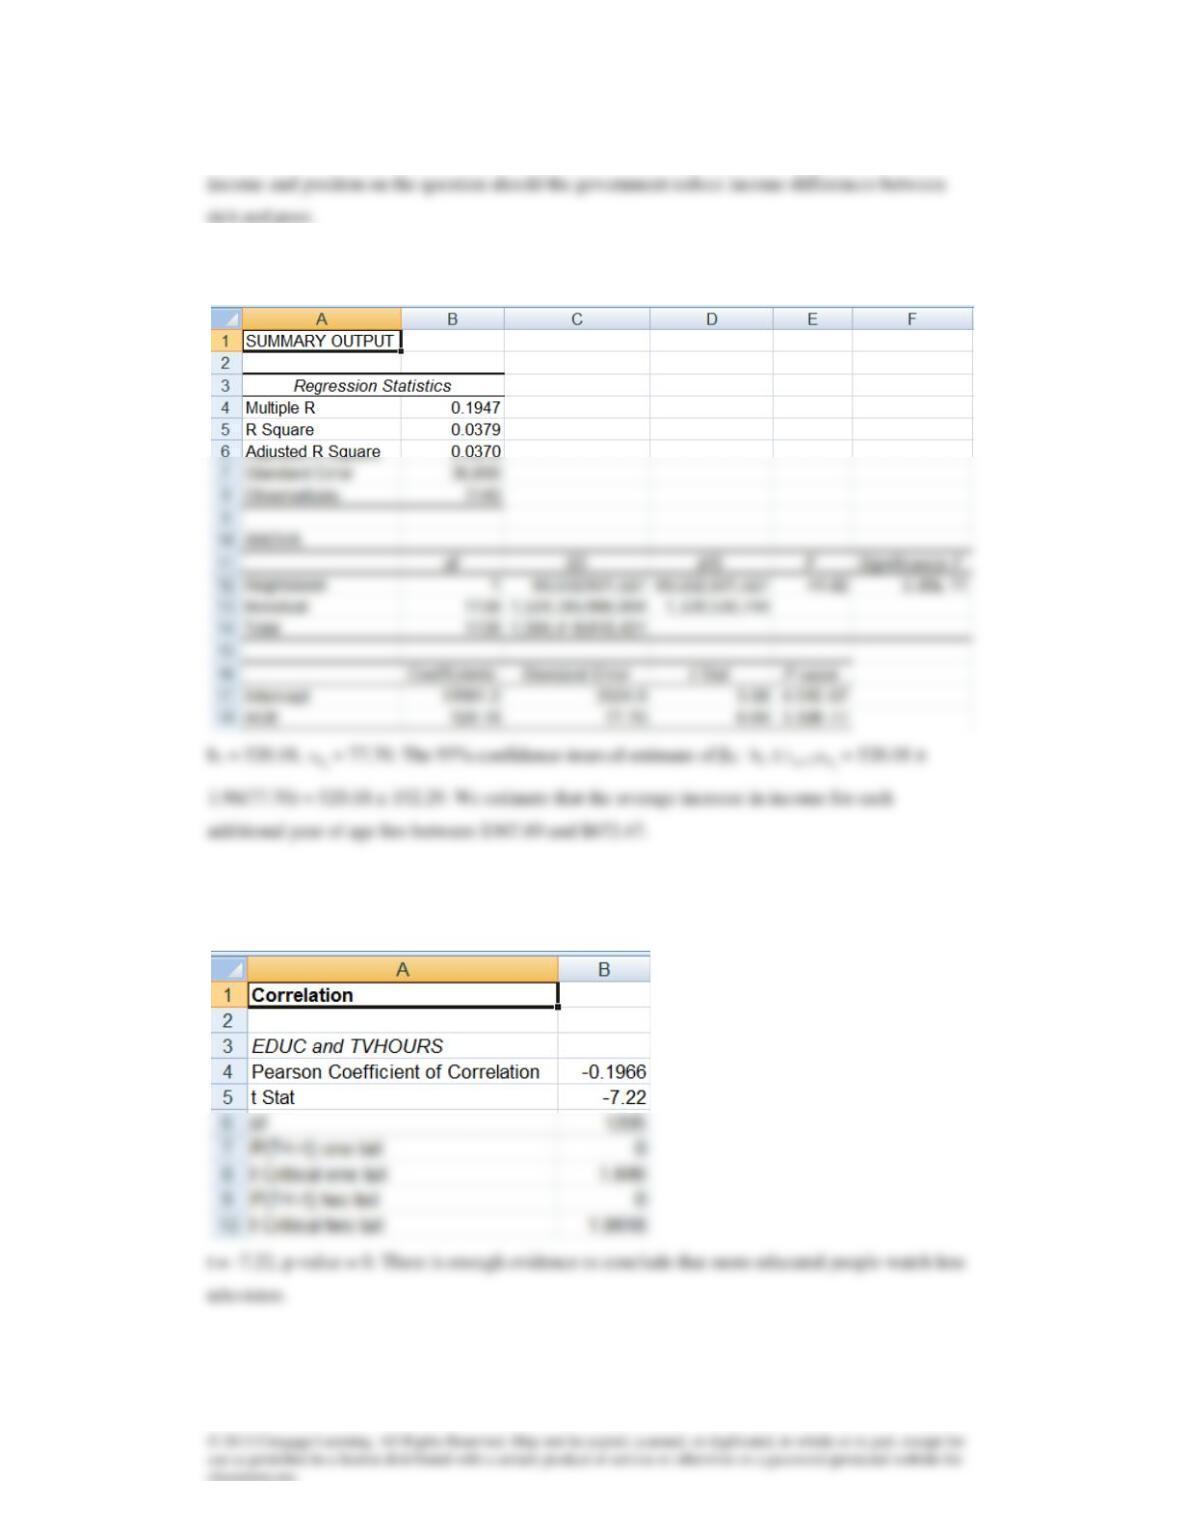
t = 5.34, p-value = 0. There is enough evidence to infer that there is a linear relationship between
16.51
16.52 H0:ρ = 0
H1:ρ < 0
16.53
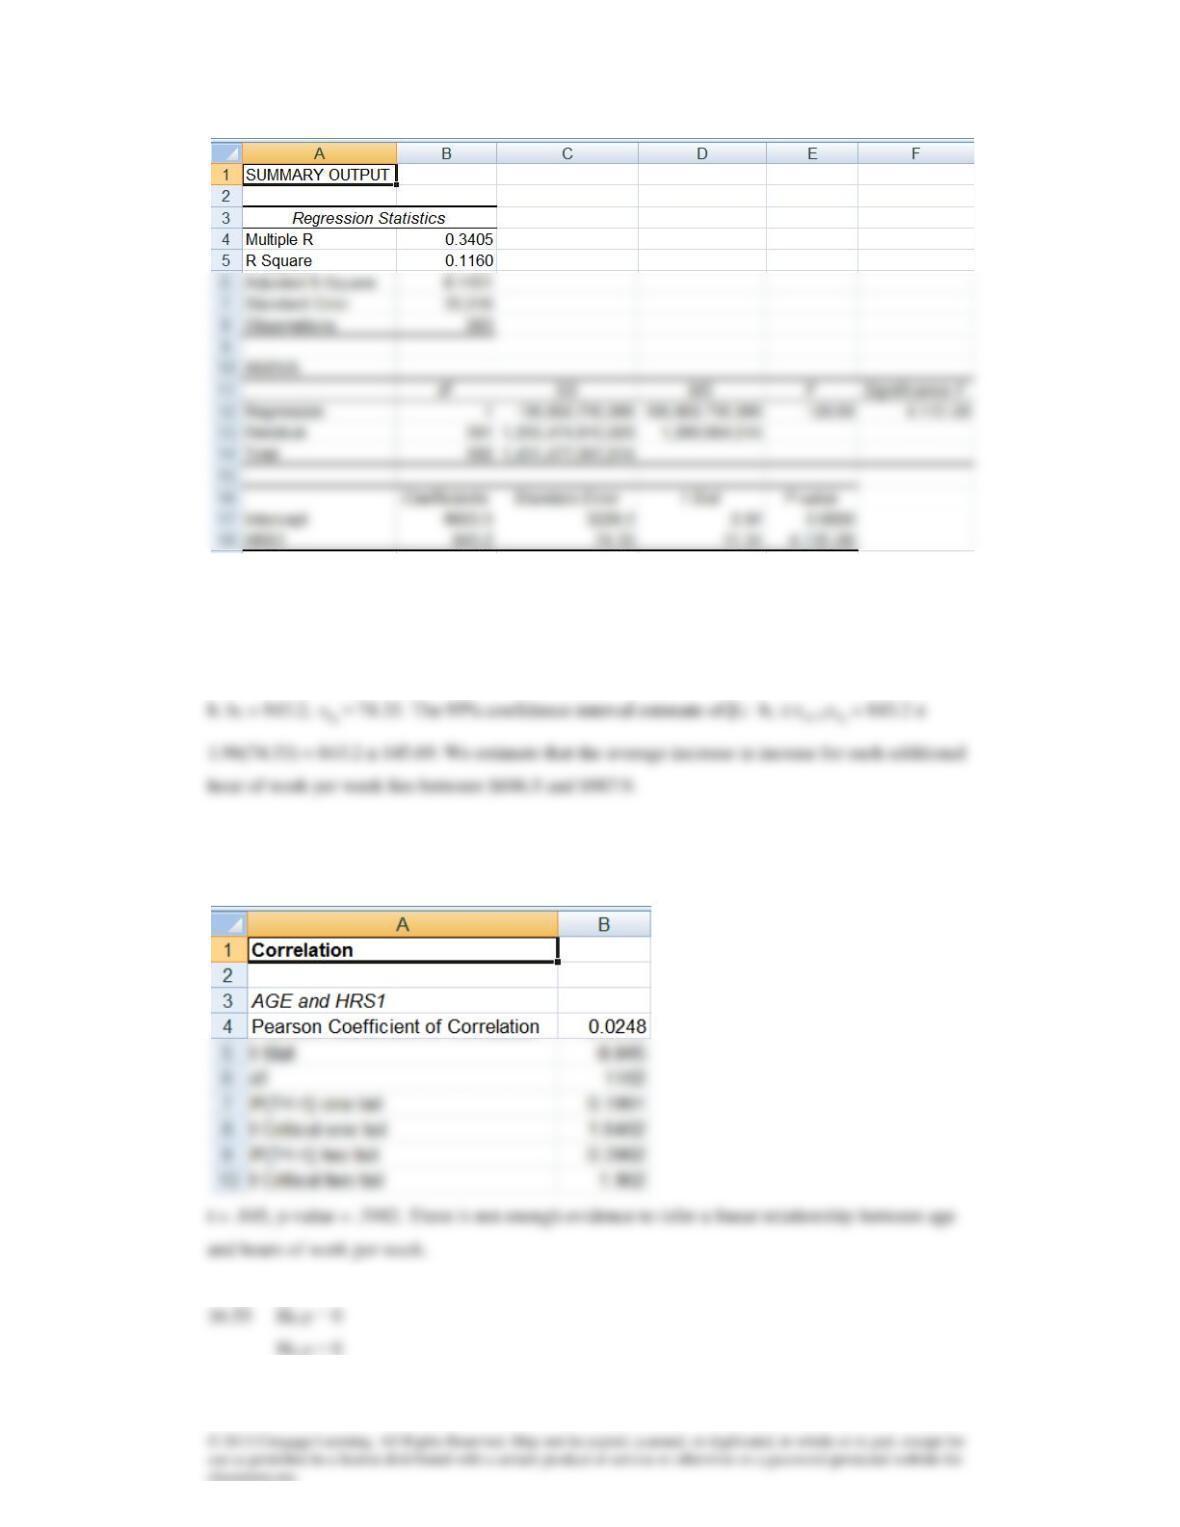
a. H0:β1 = 0
H1:β1 ≠ 0
t = 11.34, p-value = 0. There is enough evidence to infer that more education leads to higher
income.
16.54 H0:ρ = 0
H1:ρ ≠ 0
16.56
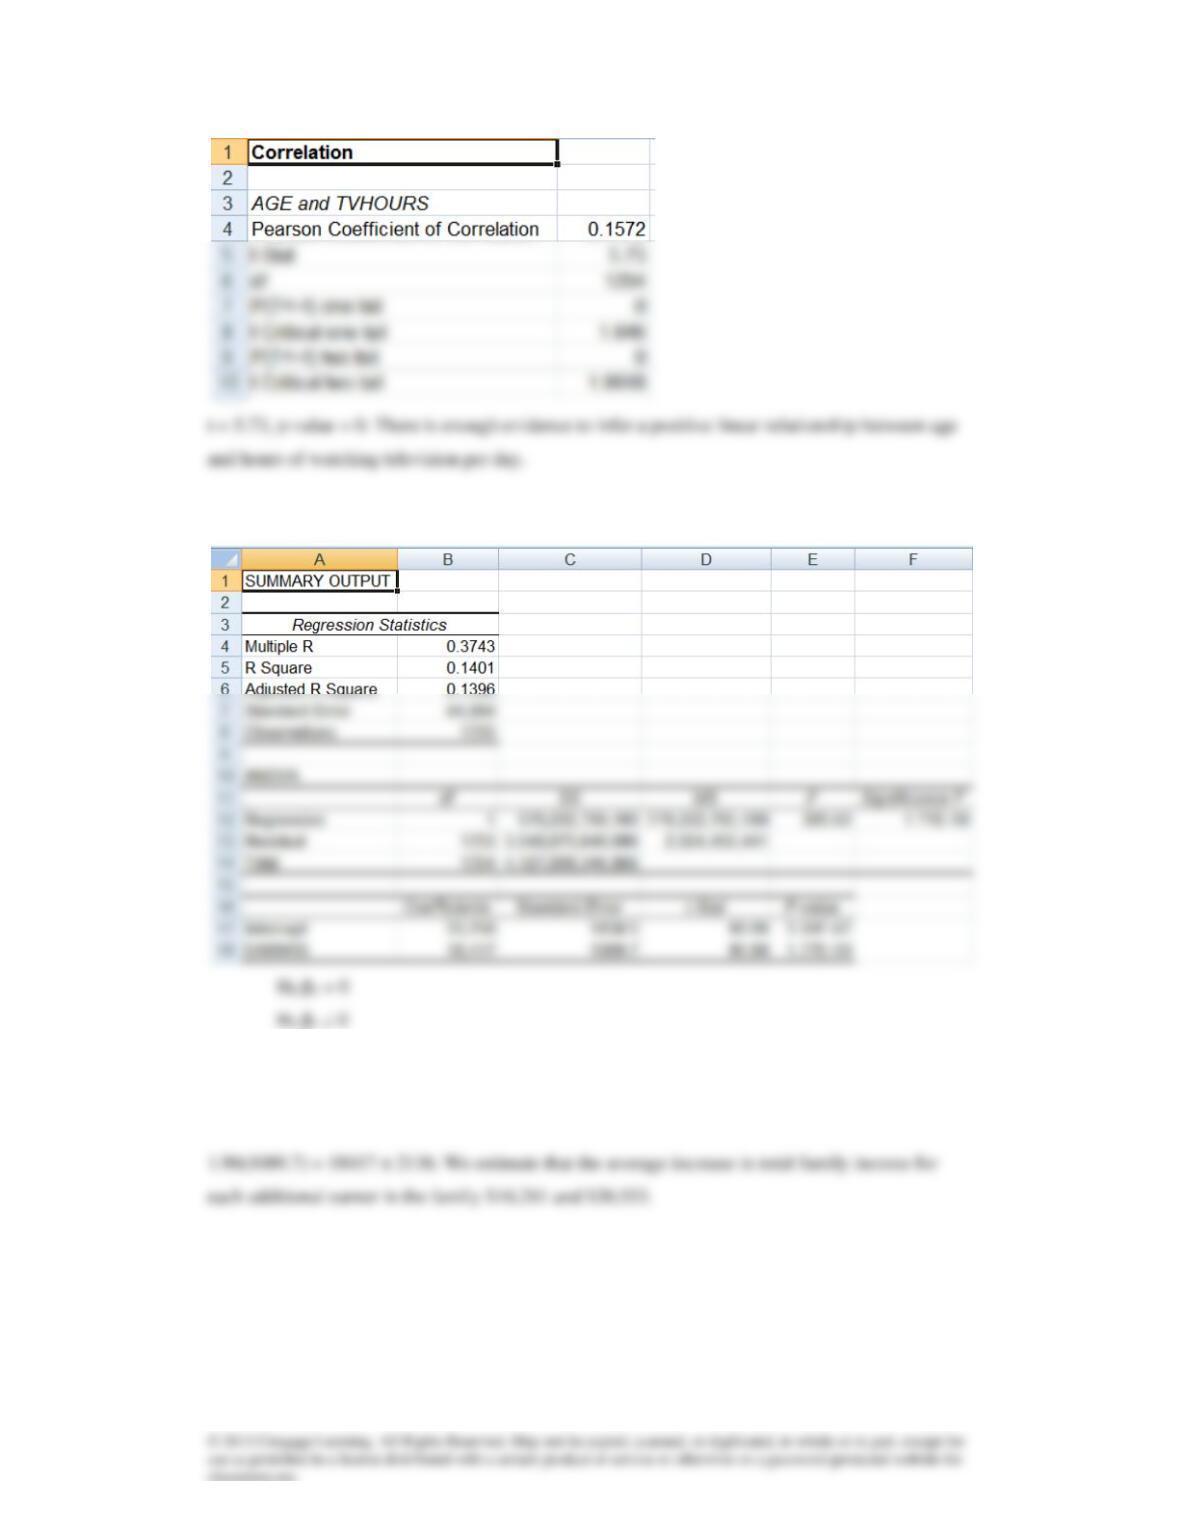
t = 16.90, p-value = 0. There is enough evidence of a positive linear relationship between total
family income and the number of earners is the family.
b1 = 18,417,
1
b
s
= 1089.7. The 95% confidence interval estimate of β1:
1
b2/1 stb
= 18417 ±
16.57 H0:ρ = 0
H1:ρ > 0
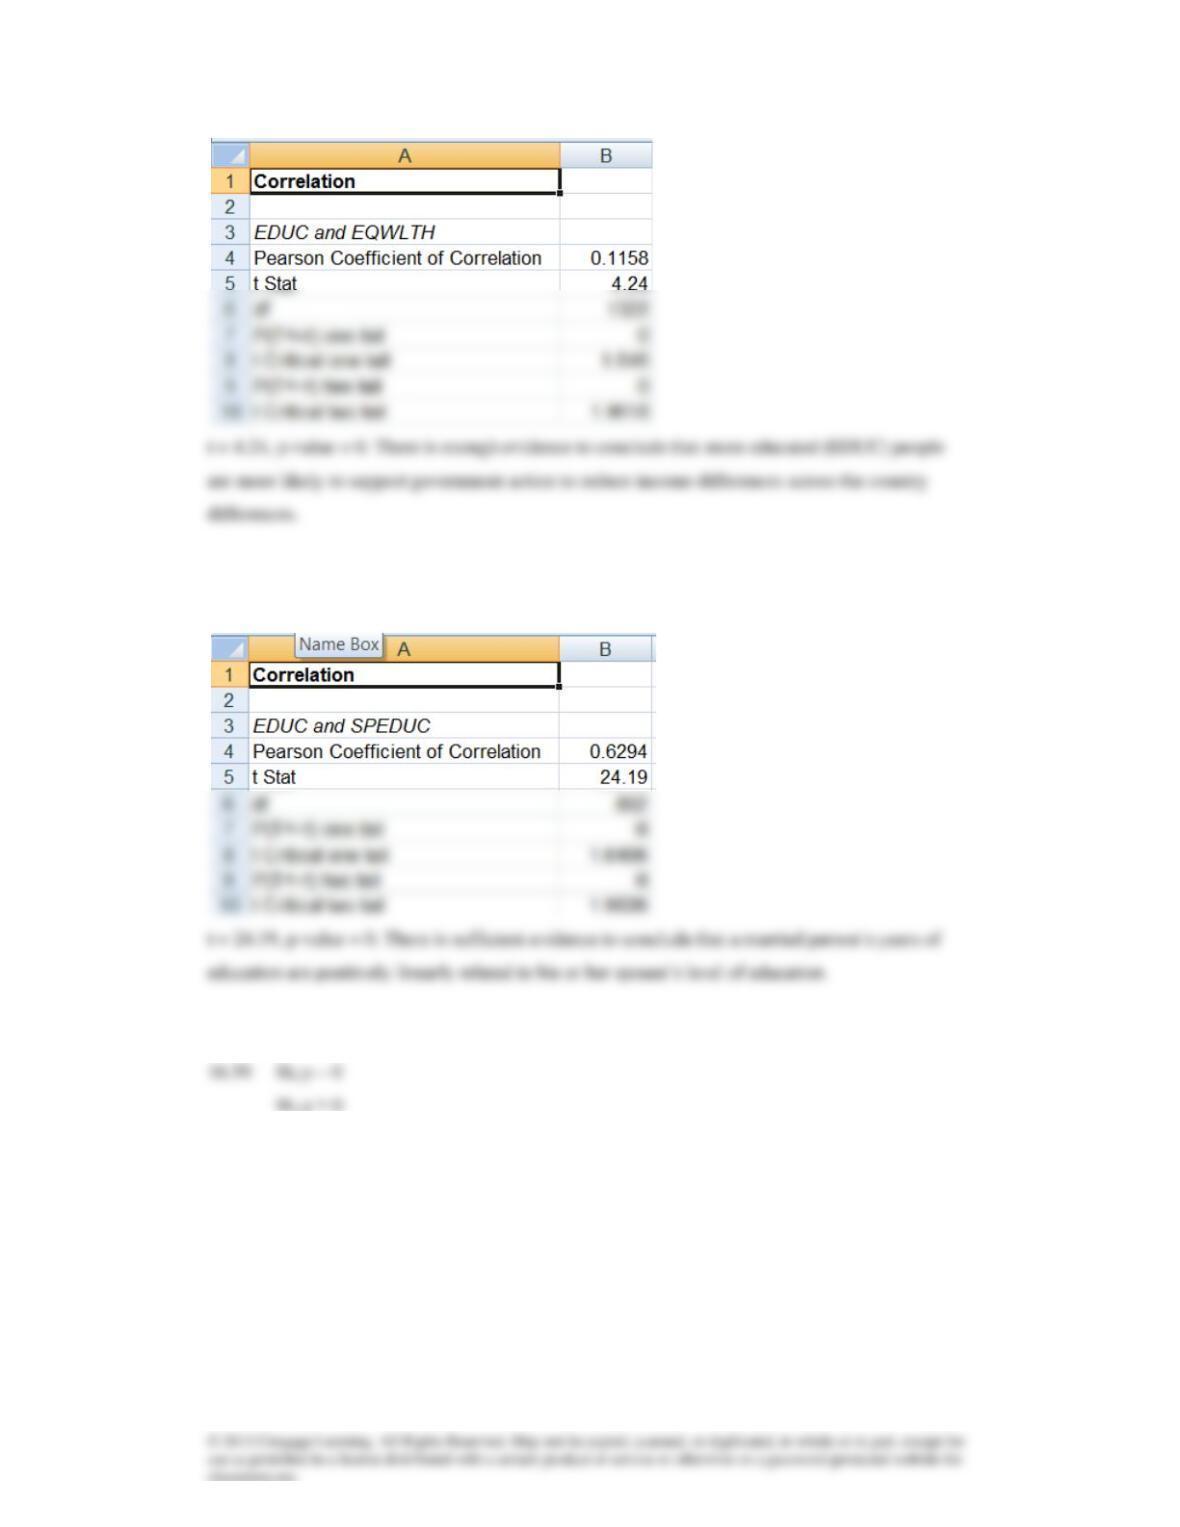
16.58 H0:ρ = 0
H1:ρ > 0
16.60 H0:ρ = 0
H1:ρ < 0
16.61 H0:ρ = 0
H1:ρ > 0
16.62 H0:ρ = 0
H1:ρ < 0
16.63 H0:ρ = 0
H1:ρ > 0
16.64 H0:ρ = 0
H1:ρ > 0
16.65 H0:ρ = 0
H1:ρ > 0
16.66 The prediction interval provides a prediction for a value of y. The confidence interval
estimator of the expected value of y is an estimator of the population mean for a given x.
Confidence interval estimate:
2
x
2
g
2n,2/ s)1n(
)xx(
n
1
sty
ˆ
−
−
+ −
(where
)860.1tt 8,05.2n,2/ ==
−
06.510.201
)24)(.110(
)20.87(
10
1
)35.31(860.10.201
2
=
−
−
+=
LCL = 149.94, UCL = 252.06 (Excel: 149.75, 252.25)
b Confidence interval estimate:
2
x
2
g
2n,2/ s)1n(
)xx(
n
1
sty
ˆ
−
−
+ −
977.1143.9
)98.47)(115(
)47.3135(
15
1
)825.3(771.1143.9
2
=
−
−
+=
LCL = 7.166, UCL = 11.120 (Excel: 7.174, 11.130)
)860.1tt 8,05.2n,2/ ==
−
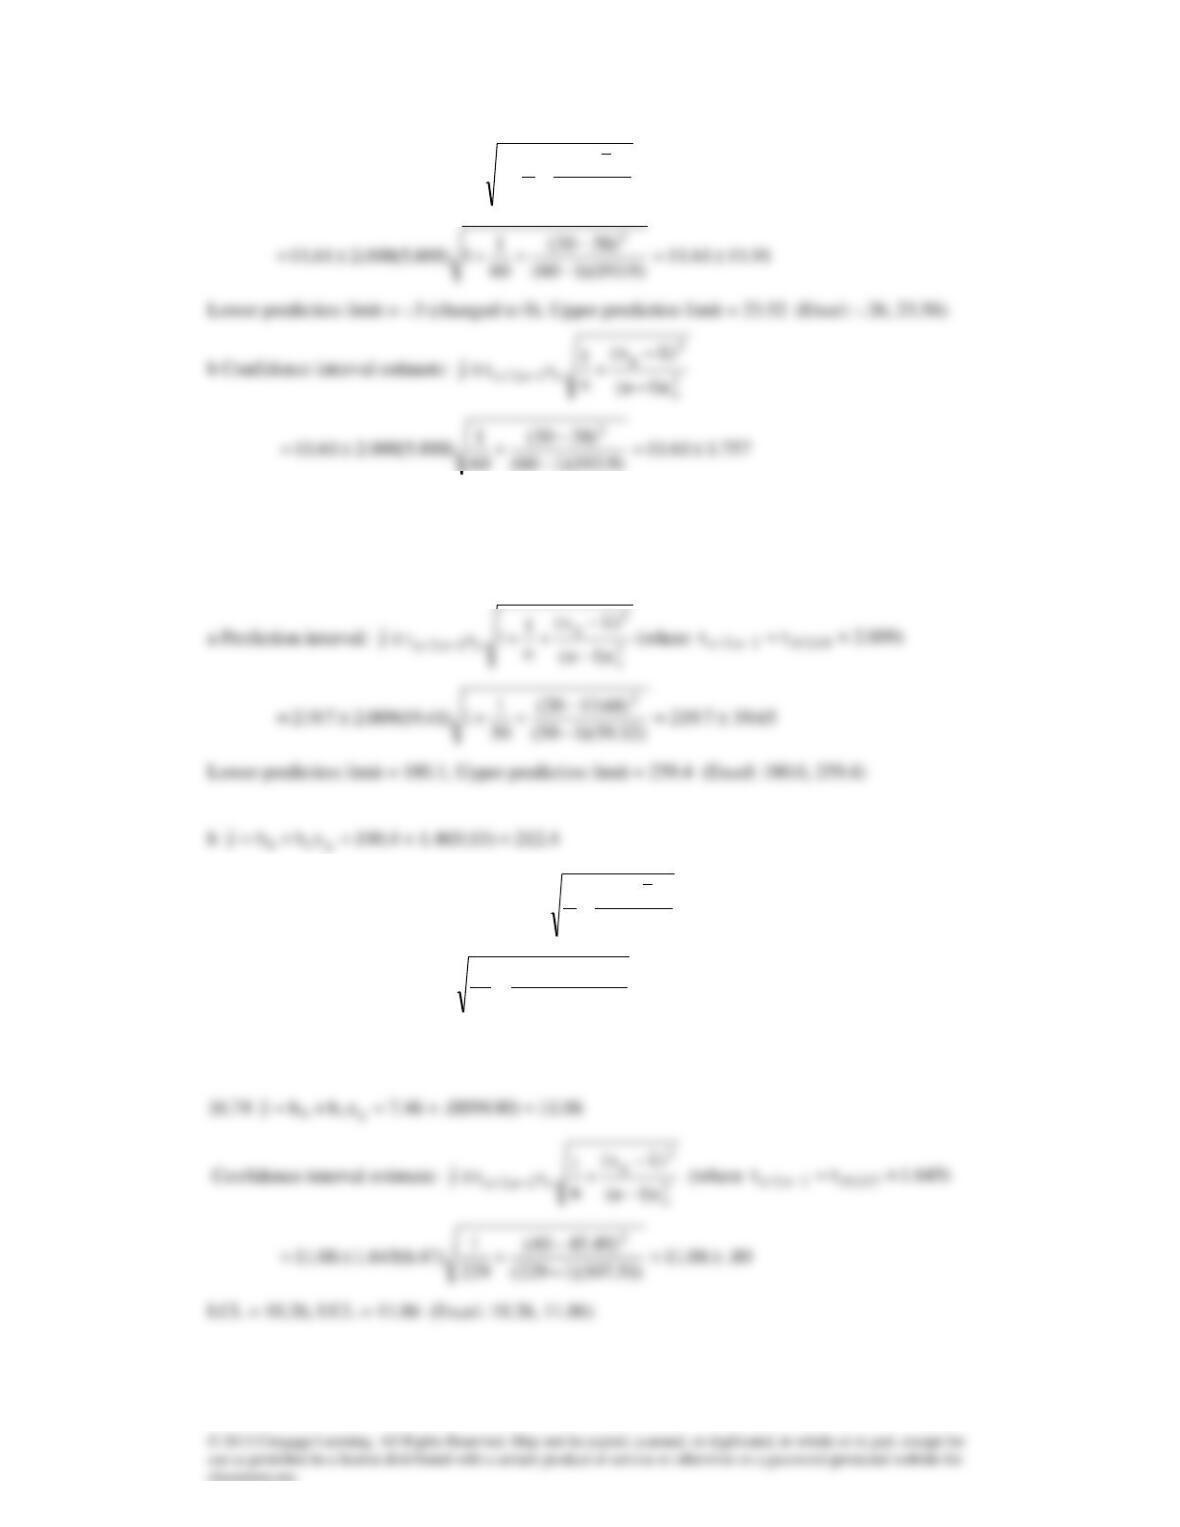
a Prediction interval:
2
x
2
g
2n,2/ s)1n(
)xx(
n
1
1sty
ˆ
−
−
++ −
(where
)000.2tt 58,0 25.2n,2/ =
−
2
x
2
g
2n,2/ s)1n(
)xx(
n
1
sty
ˆ
−
−
+ −
LCL = 9.85, UCL = 13.37 (Excel: 9.90, 13.42)
16.73
=+= g10 xbby
ˆ
190.4 + 1.465(20) = 219.7
−
=+= g10 xbby
ˆ
Confidence interval estimate:
2
x
2
g
2n,2/ s)1n(
)xx(
n
1
sty
ˆ
−
−
+ −
(where
)678.2tt 48,0 05.2n,2/ ==
−
460.74.212
)32.59)(150(
)68.1315(
50
1
)41.19(678.24.212
2
=
−
−
+=
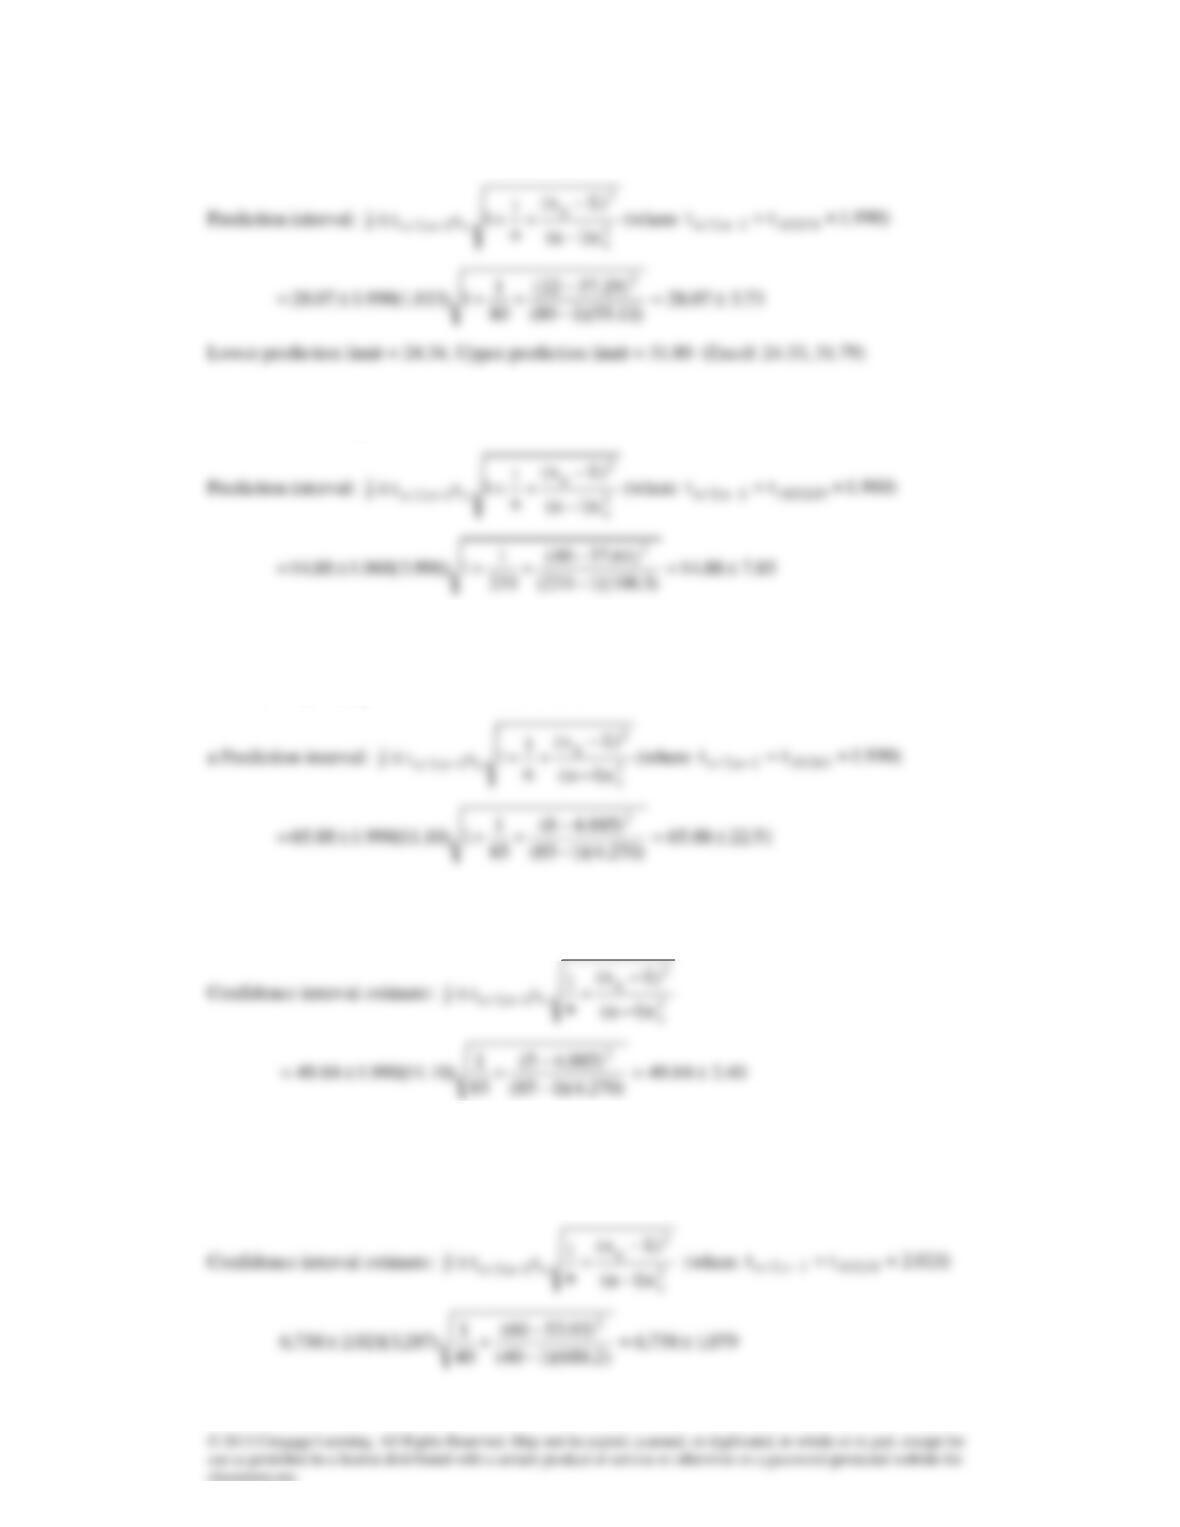
LCL = 204.9, UCL = 219.9 (Excel: 204.9, 219.8)
=+= g10 xbby
ˆ
16.75
=+= g10 xbby
ˆ
30.64 – .1169(22) = 28.07
16.76
=+= g10 xbby
ˆ
7.286 + .1898(40) = 14.88
Lower prediction limit = 7.03, Upper prediction limit = 22.73 (Excel: 6.98, 22.77)
16.77
=+= g10 xbby
ˆ
23.10 + 5.347(8) = 65.88
Lower prediction limit = 43.37, Upper prediction limit = 88.39 (Excel:43.37, 88.39)
b
=+= g10 xbby
ˆ
23.10 + 5.347(5) = 49.84
LCL = 47.44, UCL = 52.24 (Excel: 47.44, 52.24)
16.78
=+= g10 xbby
ˆ
4,040 + 44.97(60) = 6,738
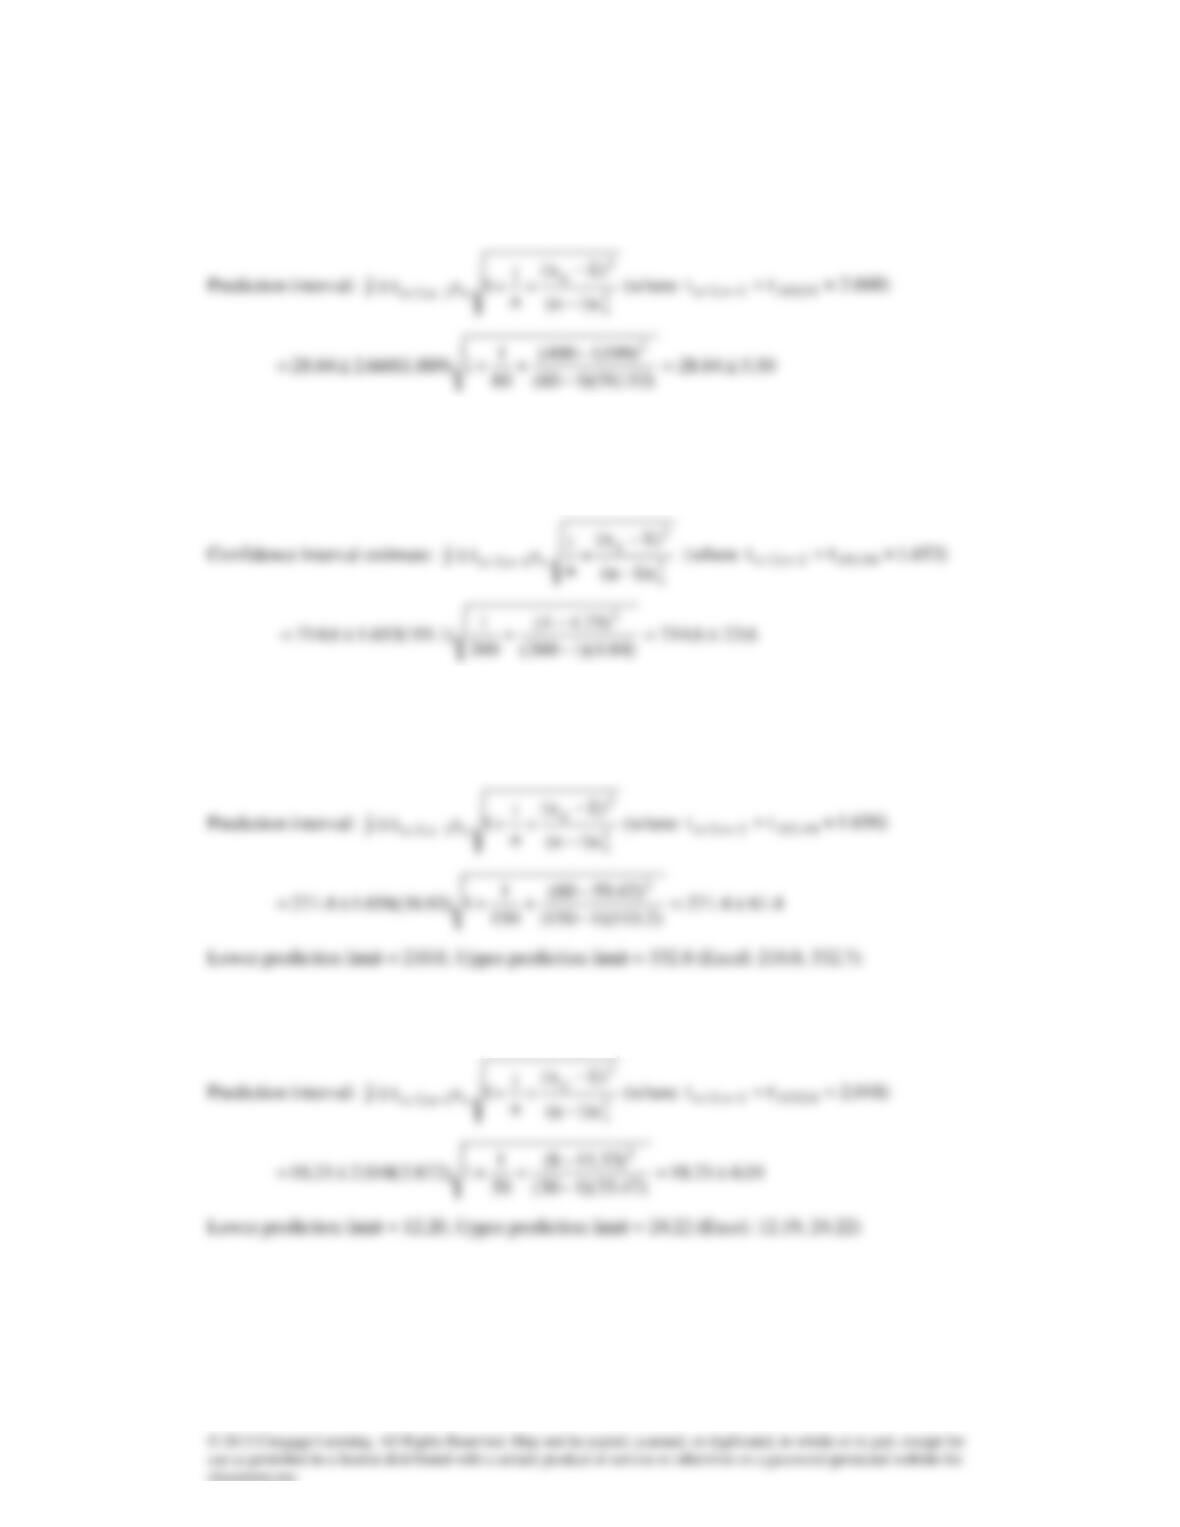
LCL = 5,659, UCL = 7,817 (Excel: LCL = 5,657, UCL = 7,818)
16.79
=+= g10 xbby
ˆ
29.39 – .00138(400) = 28.84
Lower prediction limit = 23.34, Upper prediction limit = 34.34 (Excel: 23.33, 34.35)
16.80
=+= g10 xbby
ˆ
458.4 + 64.05(4) = 714.6
LCL = 691.0, UCL = 738.2 (Excel: 691.2, 738.7)
16.81
=+= g10 xbby
ˆ
153.9 + 1.959(60) = 271.4
16.82
=+= g10 xbby
ˆ
20.64 – .3039(8) = 18.21
16.83 a
=+= g10 xbby
ˆ
17.94 + .604(74) = 62.64
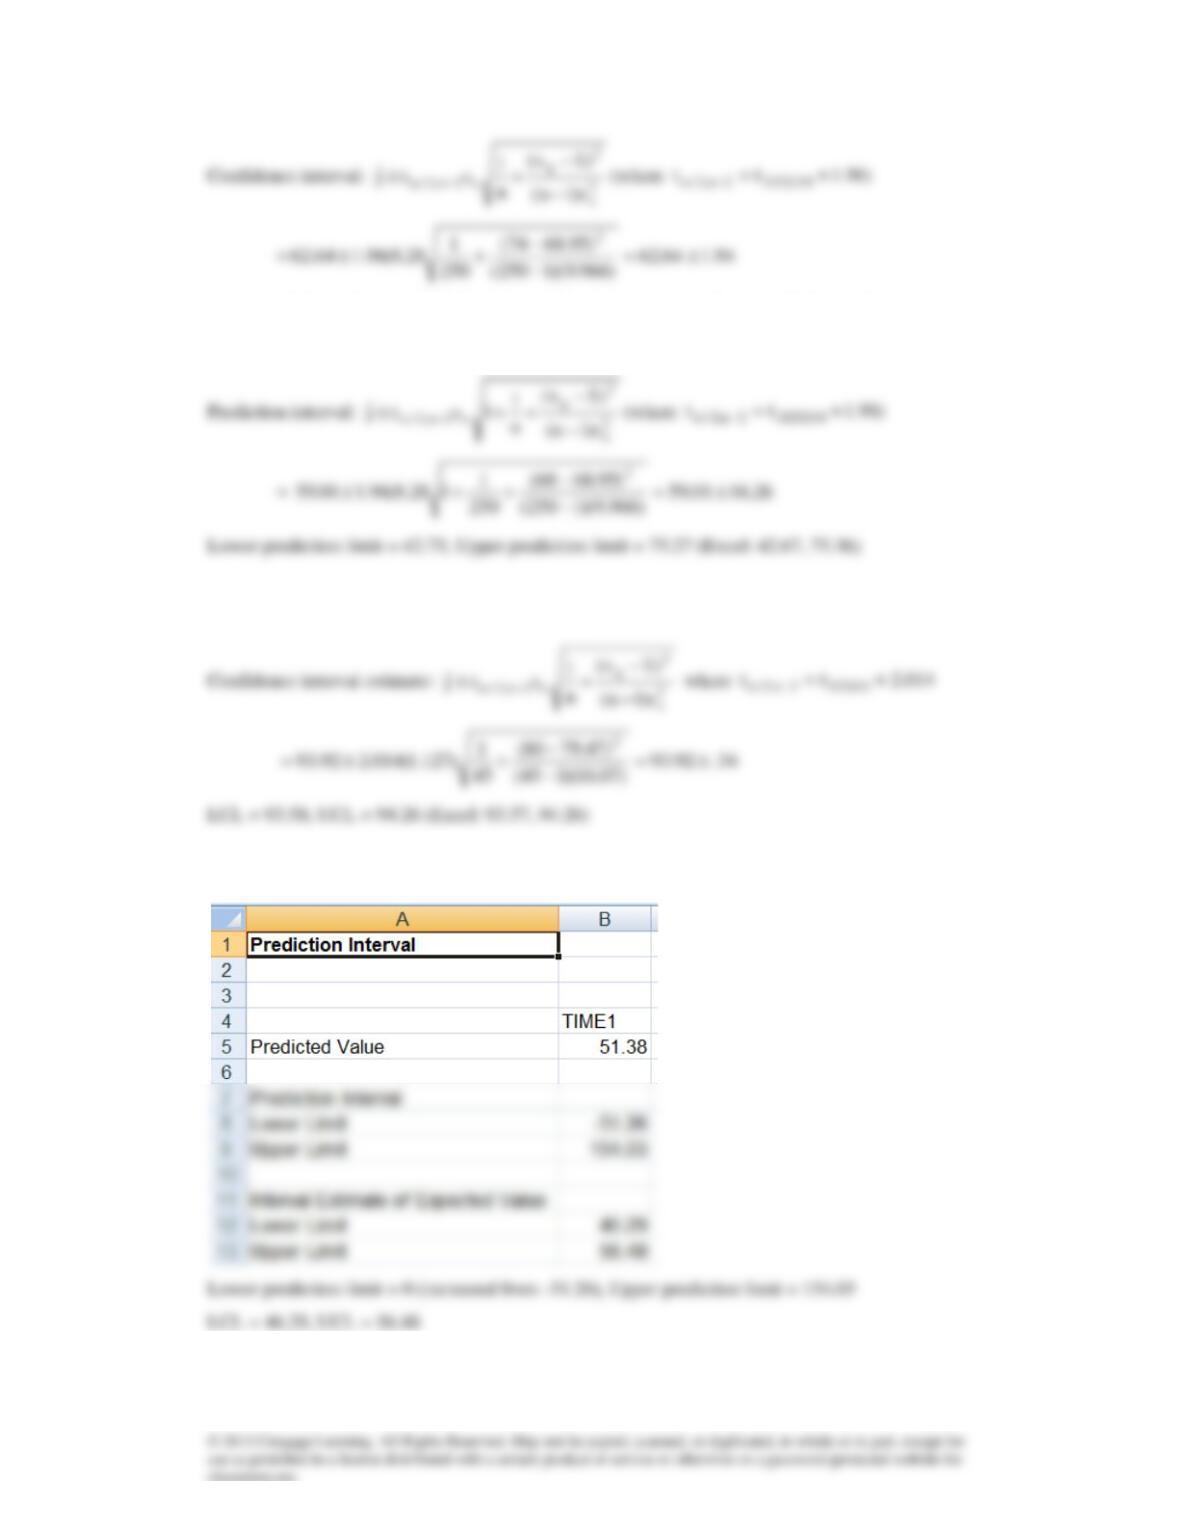
Lower confidence limit = 60.70, Upper confidence limit = 64.58 (Excel: 60.70, 64.59)
b
=+= g10 xbby
ˆ
17.94 + .604(68) = 59.01
16.84
=+= g10 xbby
ˆ
89.81 + .0514(80) = 93.92
16.85
16.86
16.87
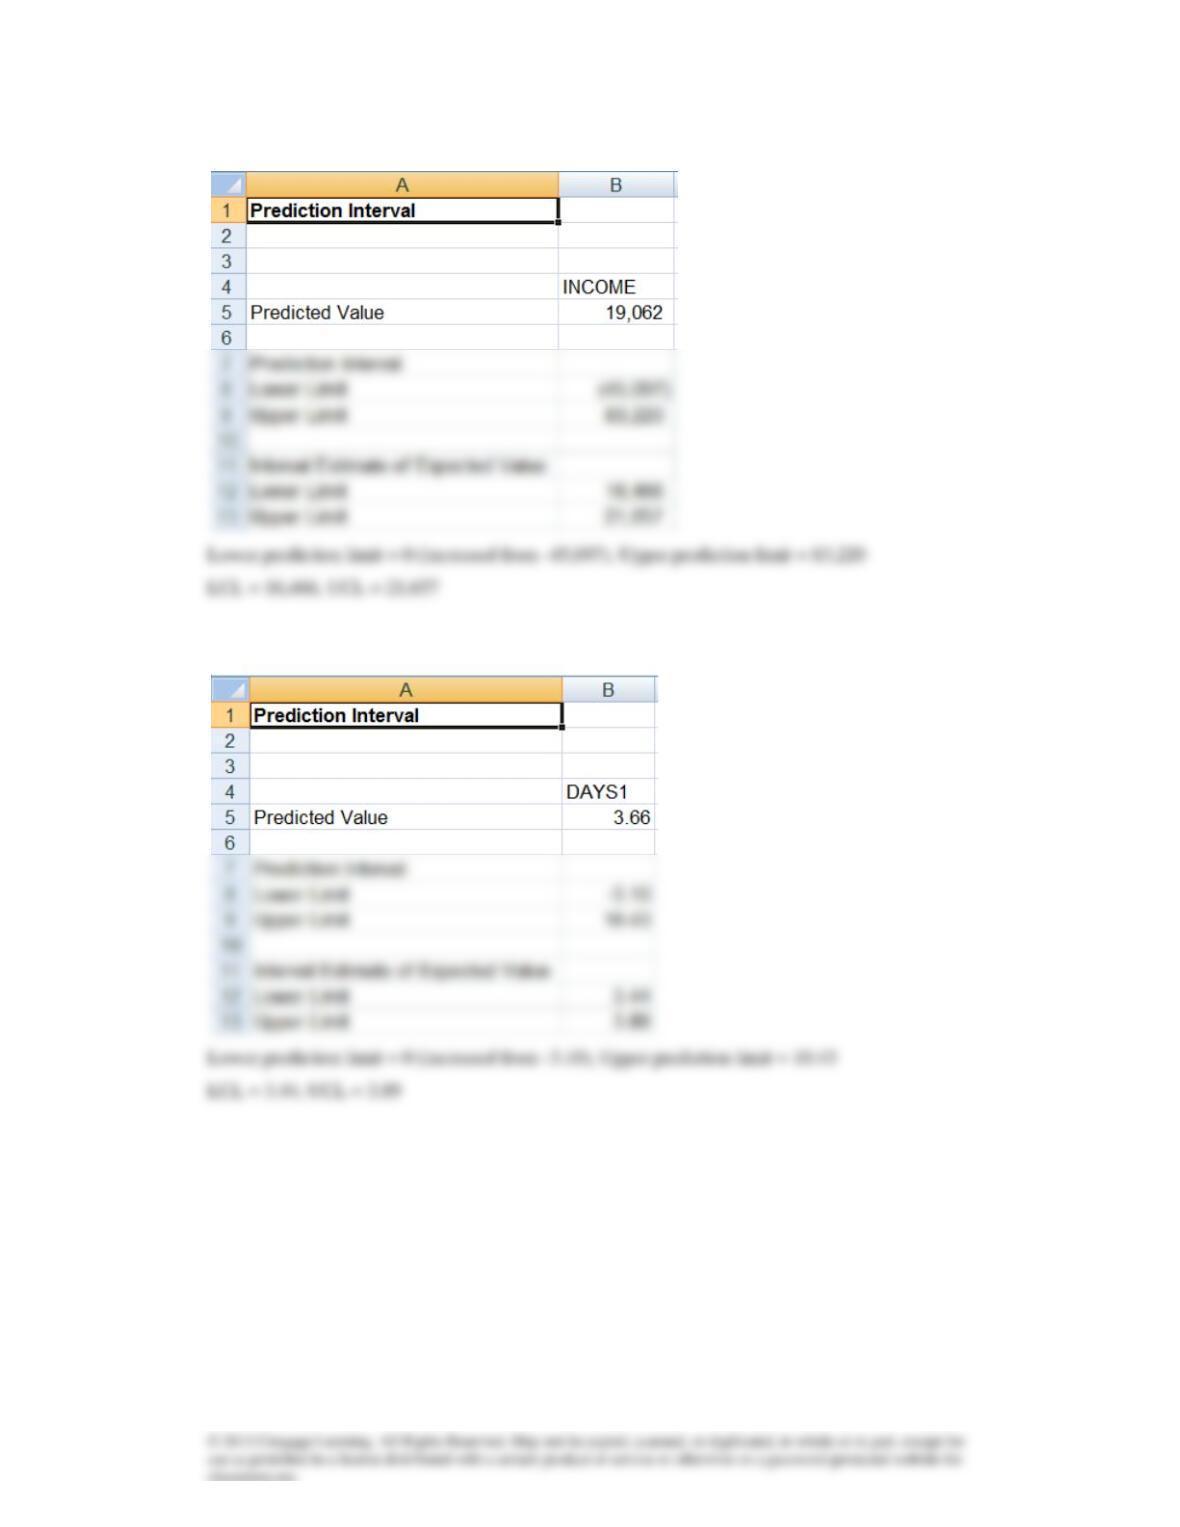
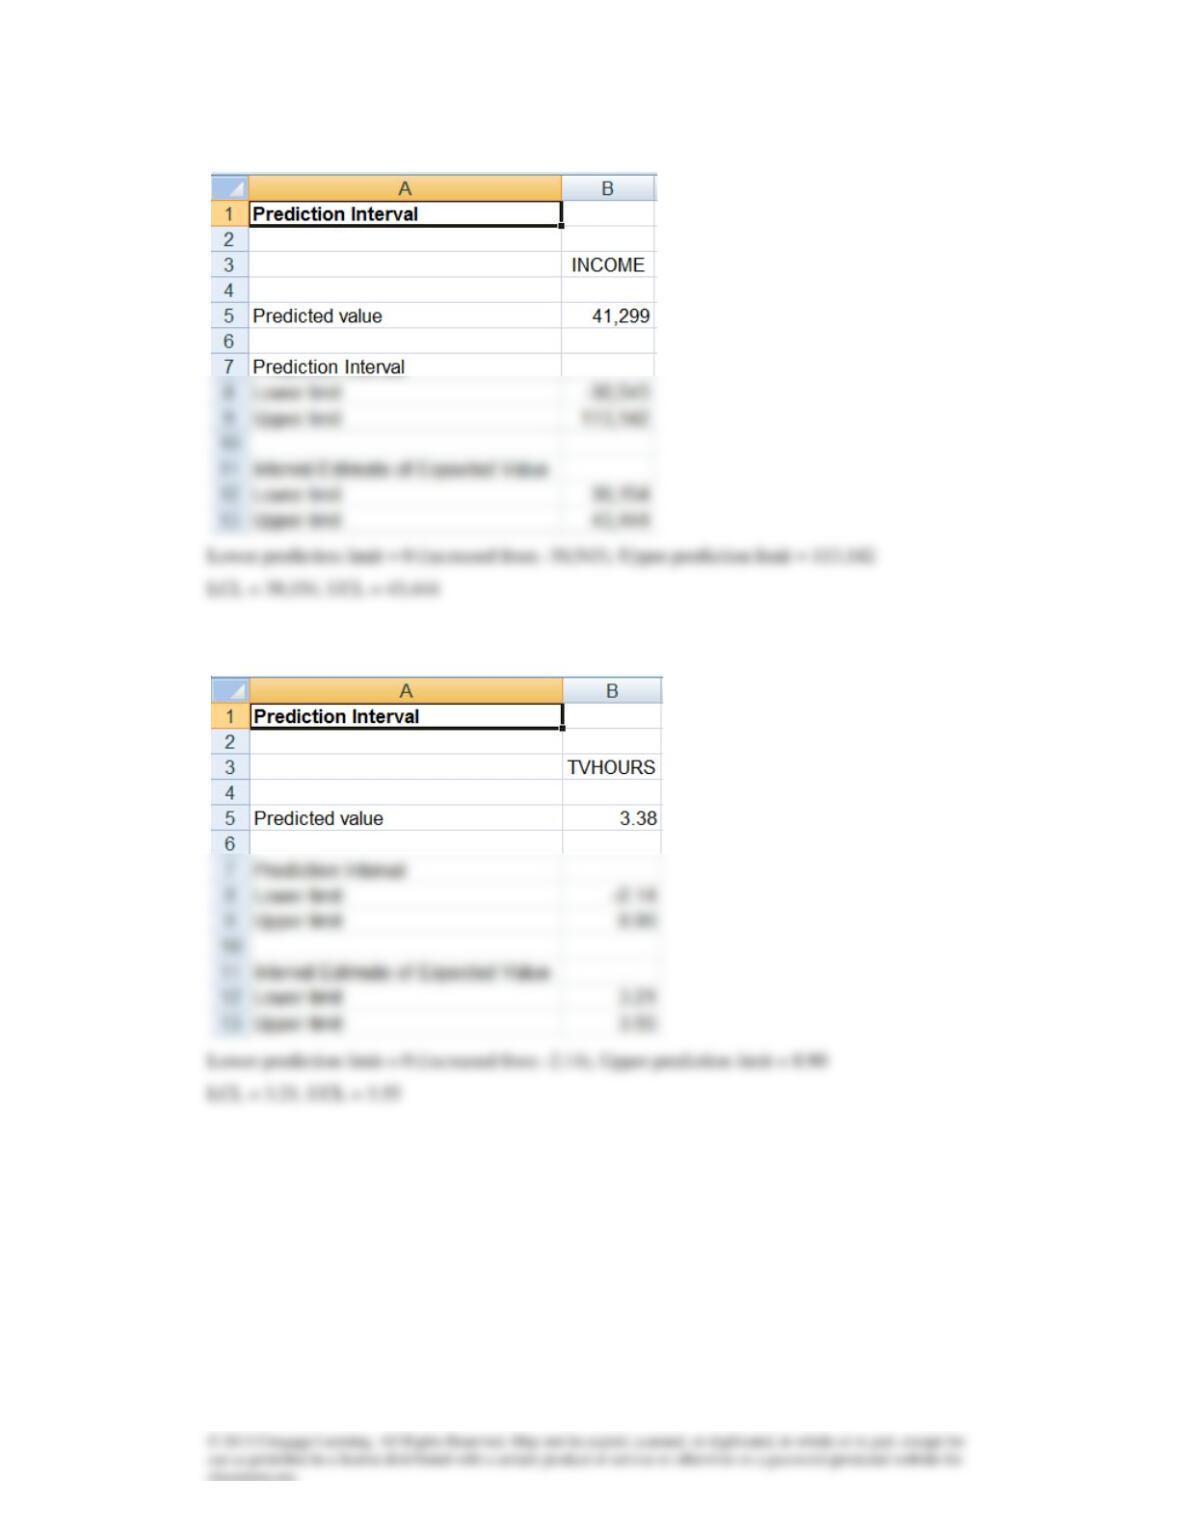
16.88 In all cases the linear relationship is far too weak to produce accurate predictions.
16.89
16.90
16.91
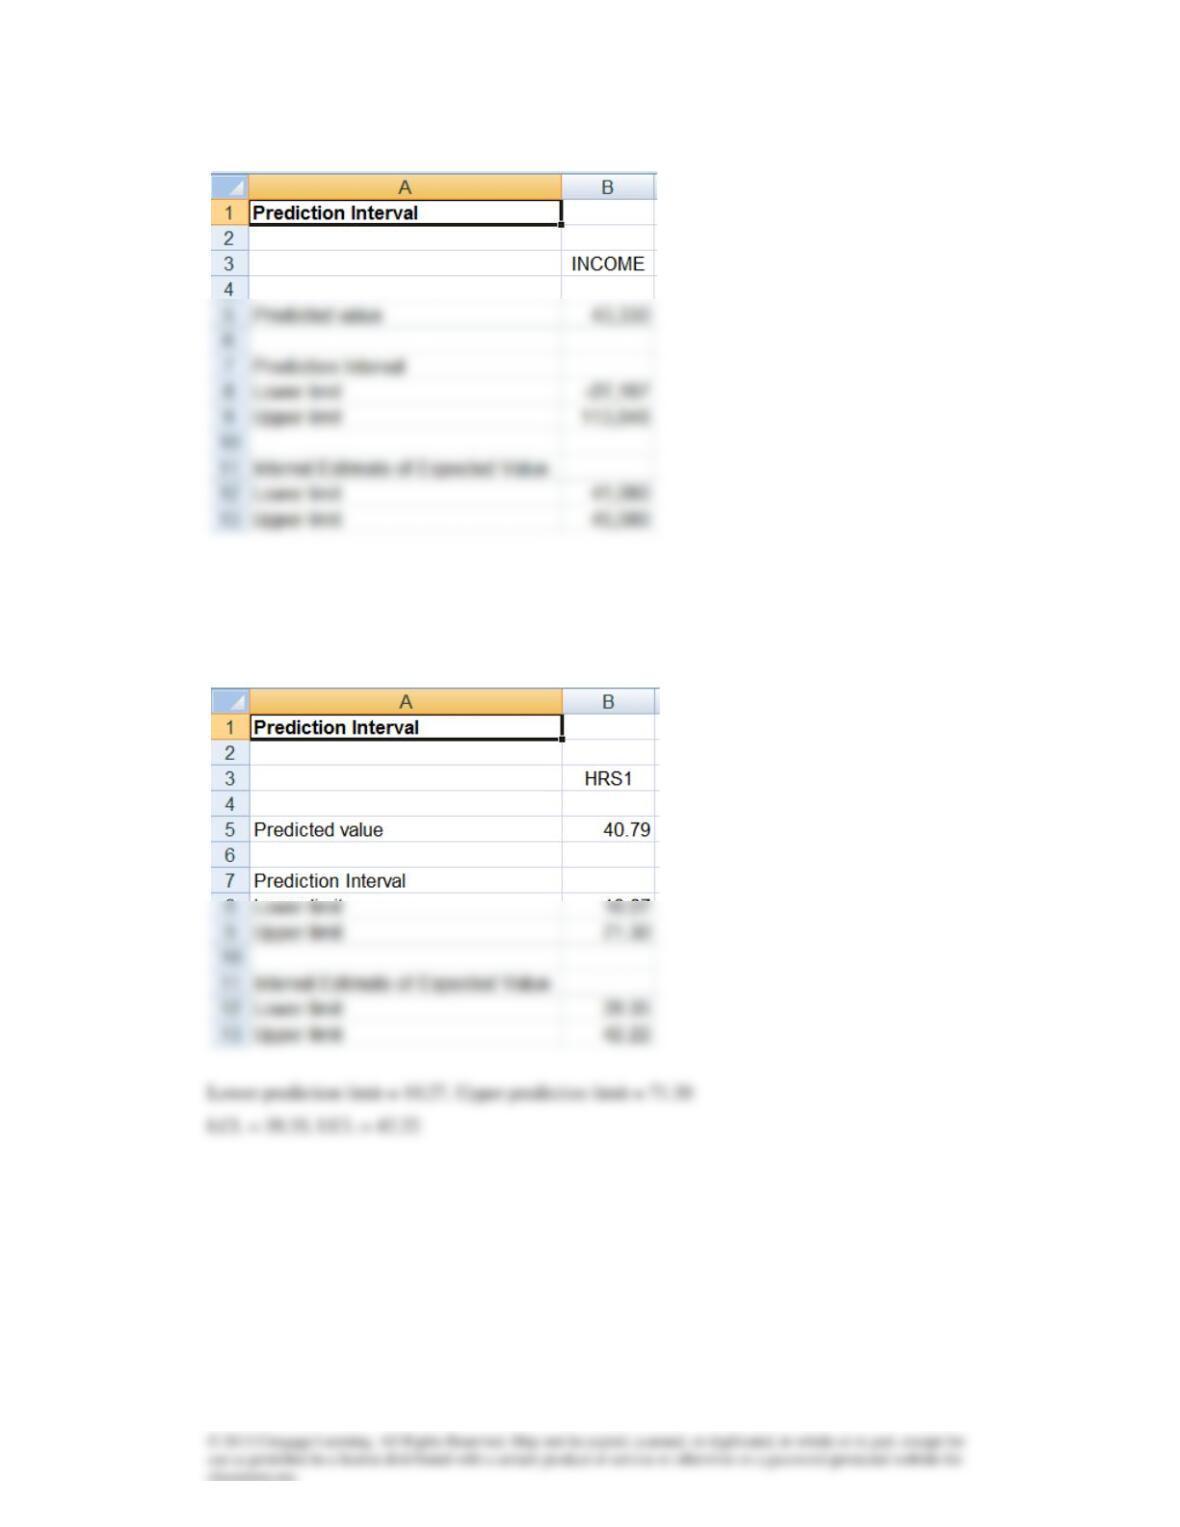
Lower prediction limit = 0 (increased from -27,187), Upper prediction limit = 113,848
LCL = 41,080, UCL = 45,580
16.92
16.93
16.94