CHAPTER 12: INFERENCE ABOUT A POPULATION
TRUE/FALSE
1. In order to determine the p-value associated with hypothesis testing about the population mean
, it is
necessary to know the value of the test statistic.
2. In order to interpret the p-value associated with hypothesis testing about the population mean
, it is
necessary to know the value of the test statistic.
3. If a sample has 15 observations and a 95% confidence estimate for
is needed, the appropriate value
of t is 1.753.
4. If a sample has 18 observations and a 90% confidence estimate for
is needed, the appropriate value
of t is 1.740.
6. If the sampled population is nonnormal, the t–test of the population mean
is still valid, provided that
the condition is not extreme.
7. A race car driver tested his car for time from 0 to 60 mph, and in 20 tests obtained an average of 48.5
seconds with a standard deviation of 1.47 seconds. A 95% confidence interval for the 0 to 60 time is
45.2 seconds to 51.8 seconds.
8. In forming a 95% confidence interval for a population mean from a sample size of 20, the number of
degrees of freedom from the t-distribution equals 20.
9. The t-distribution is used in a confidence interval for a mean when the actual standard error is not
known.
10. The t–distribution allows the calculation of confidence intervals for means for small samples when the
population variance is not known, regardless of the shape of the distribution in the population.
11. The t–distribution is used to develop a confidence interval estimate of the population mean when the
population standard deviation is unknown.
12. The t–distribution assumes that the population is normally distributed.
13. In estimating the population mean with the population standard deviation unknown, if the sample size
is 16, there are 8 degrees of freedom.
MULTIPLE CHOICE
1. For statistical inference about the mean of a single population when the population standard deviation
is unknown, the degrees for freedom for the t-distribution equal n − 1 because we lose one degree of
freedom by using the:
a.
sample mean as an estimate of the population mean.
b.
sample standard deviation as an estimate of the population standard deviation.
c.
sample proportion as an estimate of the population proportion.
d.
sample size as an estimate of the population size.

2. Researchers determined that 60 Puffs tissues is the average number of tissues used during a cold.
Suppose a random sample of 100 Puffs users yielded the following data on the number of tissues used
during a cold: = 52 and s = 22. Suppose the test statistic does not fall in the rejection region at
=
0.05. Which of the following conclusions is correct?
a.
At
= 0.05, we do not reject H0.
c.
At
= 0.05, we accept H0.
b.
At
= 0.05, we reject H0.
d.
Both a and c.
3. A robust estimator is one that is:
a.
unbiased and symmetrical about zero.
c.
efficient and less spread out.
b.
consistent and is also mound-shaped.
d.
not sensitive to moderate nonnormality.
4. A random sample of size 15 taken from a normally distributed population revealed a sample mean of
75 and a sample variance of 25. The upper limit of a 95% confidence interval for the population mean
would equal:
a.
77.77
c.
88.85
b.
72.23
d.
77.27
5. A major electronics store chain is interested in estimating the average amount its credit card customers
spent on their first visit to the chain’s new store in the mall. Fifteen credit card accounts were randomly
sampled and analyzed with the following results: = $50.50 and s2 = 400. A 95% confidence interval
for the average amount the credit card customers spent on their first visit to the chain’s new store in the
mall is:
a.
$50.50 $9.09.
c.
$50.50 $11.08.
b.
$50.50 $10.12.
d.
None of these choices.
6. Researchers determine that 60 Puffs tissues is the average number of tissues used during a cold.
Suppose a random sample of 100 Puffs users yielded the following data on the number of tissues used
during a cold: = 52 and s = 22. Using the sample information provided, the value of the test statistic
is:
a.
t = (52 − 60) / 22
c.
t = (52 − 60) / (22 / 1002)
b.
t = (52 − 60) / (22 / 100)
d.
t = (52 − 60) / (22 / 10)

7. For a 99% confidence interval of the population mean based on a sample of n = 25 with s = 0.05, the
critical value of t is:
a.
2.7969
c.
2.4922
b.
2.7874
d.
2.4851
8. Based on sample data, the 90% confidence interval limits for the population mean are LCL = 170.86
and UCL = 195.42. If the 10% level of significance were used in testing the hypotheses H0:
= 201
vs. H1:
201, the null hypothesis:
a.
would be rejected.
c.
would fail to be rejected.
b.
would be accepted.
d.
would become H0:
201
9. The degrees of freedom for the test statistic for
when
is unknown is:
a.
1
c.
n − 1
b.
n
d.
None of these choices.
10. Researchers determined that 60 Puffs tissues is the average number of tissues used during a cold.
Suppose a random sample of 100 Puffs users yielded the following data on the number of tissues used
during a cold: = 52 and s = 22. Suppose the alternative we wanted to test was H1:
< 60. The
correct rejection region for
= 0.05 is:
a.
reject H0 if t > 1.6604.
c.
reject H0 if t > 1.9842 or Z < −1.9842.
b.
reject H0 if t < −1.6604.
d.
reject H0 if t < −1.9842.
COMPLETION
1. When the population standard deviation is ____________________ and the population is normal, the
test statistic for testing hypotheses about
is the t-distribution with n − 1 degrees of freedom.
2. When the population standard deviation is unknown and the population is ____________________,
the test statistic for testing hypotheses about
is the t–distribution with n − 1 degrees of freedom.
3. When the population standard deviation is unknown and the population is normal, the test statistic for
testing hypotheses about
is the ____________________-distribution with ____________________
degrees of freedom.
4. The t-test for a population mean is ____________________, meaning that if the population is
nonnormal, the results of the test and confidence interval are still valid as long as the nonnormality is
not extreme.
5. When a population is small, we must adjust the test statistic and interval estimator using the
____________________ population correction factor.
6. ____________________ populations allow us to use the confidence interval estimate of a mean to
produce a confidence interval estimate of the population total.
7. The t-statistic has two variables: the sample ____________________ and the sample
____________________.
8. Because of the greater uncertainty, the t-statistic will display greater ____________________ than the
z-statistic.
SHORT ANSWER
Single Mothers’ Ages
A random sample of 10 single mothers was drawn from a Obstetrics Clinic. Their ages are 22, 17, 27,
20, 23, 19, 24, 18, 19, and 24 years.
1. {Single Mothers’ Ages Narrative} Estimate the population mean with 90% confidence.
2. {Single Mothers’ Ages Narrative} Test to determine if we can infer at the 5% significance level that
the population mean is not equal to 20.
3. {Single Mothers’ Ages Narrative} What is the required condition of the techniques used in the
previous questions? What graphical device can you use to check to see if that required condition is
satisfied?
Concert Tickets
A simple random sample of 100 concert tickets was drawn from a normal population. The mean and
standard deviation of the sample were $120 and $25, respectively.
4. {Concert Tickets Narrative} Test the hypothesis H0:
= 125 vs. H1:
125 at the 10% significance
level.
5. {Concert Tickets Narrative} Estimate the population mean with 90% confidence.
6. {Concert Tickets Narrative} Explain how to use the confidence interval to test the hypotheses at
=
0.10.
Hourly Fees
A random sample of 15 hourly fees for car washers (including tips) was drawn from a normal
population. The sample mean and sample standard deviation were = $14.9 and s = $6.75.
7. {Hourly Fees Narrative} Can we infer at the 5% significance level that the mean fee for car washers
(including tips) is greater than 12?
8. {Hourly Fees Narrative} Can we infer at the 5% significance level that the population mean is greater
than 12, assuming that you know the population standard deviation is equal to 6.75?
Tire Rotation
The manager of a service station is in the process of analyzing the number of times car owners rotate
the tires on their cars. She believes that the average motorist rotates his or her car’s tires less frequently
than recommended by the owner’s manual (two times per year). In a preliminary survey she asked 14
car owners how many times they rotated their cars’ tires in the last 12 months. The results are 1, 1, 2, 0,
3, 3, 0, 1, 0, 1, 2, 3, 3, and 1.
9. {Tire Rotation Narrative} Does this data provide sufficient evidence at the 10% significance level to
indicate that the manager is correct?
10. {Tire Rotation Narrative} What condition is required in order to analyze this data using a t-test?
11. The air pumps at service stations come equipped with a gauge to regulate the air pressure of tires. A
mechanic believes that the gauges are in error by at least 3 pounds per square inch. To test his belief he
takes a random example of 50 air pump gauges and determines the difference between the true
pressure (as measured by an accurate measuring device) and the pressure shown on the air pump
gauge. The mean and the standard deviation of the sample are = 3.4 and s = 1.2. Can the mechanic
infer that he is correct at the 5% significance level? Assume tire pressures have a normal distribution.
12. A life insurance representative believes that the mean age of people who buy their first life insurance
plan is less than 35. To test his belief he takes a random sample of 15 customers who have just
purchased their first life insurance. Their ages are 42, 43,28, 34, 30, 36, 25, 29, 32, 33, 27, 30, 22, 37,
and 40. There is not enough evidence to say the data are nonnormal. Can we conclude at the 1%
significance level that the insurance representative is correct?
Mystic Pizza
Mystic Pizza in Mystic, Connecticut, advertises that they deliver your pizza within 15 minutes of
placing an order or it is free. A sample of 25 customers is selected at random. The average delivery
time in the sample was 13 minutes with a sample standard deviation of 4 minutes.
13. {Mystic Pizza Narrative} We want to know whether Mystic can make this claim or not. Test to
determine if we can infer at the 5% significance level that the population mean delivery time is less
than 15 minutes.
14. {Mystic Pizza Narrative} What is the required condition of the technique used in the previous
question?
Energy Drink Consumption
A researcher at the University of Washington medical school believes that energy drink consumption
may increase heart rate. Suppose it is known that heart rate (in beats per minute) is normally
distributed with an average of 70 bpm for adults. A random sample of 25 adults was selected and it
was found that their average heartbeat was 73 bpm after energy drink consumption, with a standard
deviation of 7 bpm.
15. {Energy Drink Consumption Narrative} Formulate the null and alternative hypotheses.
16. {Energy Drink Consumption Narrative} Test the hypotheses in the previous question at the 10%
significance level to determine if we can infer that energy drink consumption increases heart rate.
17. Employees in a large company are entitled to 15-minute water breaks. A random sample of the
duration of water breaks for 10 employees was taken with the times shown as: 12, 16, 14, 18, 21, 17,
19, 15, 18, and 16. Assuming that the times are normally distributed, is there enough evidence at the
5% significance level to indicate that on average employees are taking longer water breaks than they
are entitled to?
18. During a natural gas shortage, a gas company randomly sampled residential gas meters in order to
monitor daily gas consumption. On a particular day, a sample of 100 meters showed a sample mean of
250 cubic feet and a sample standard deviation of 50 cubic feet. Provide a 90% confidence interval
estimate of the mean gas consumption for the population.
19. The chi-squared distribution can be used in constructing confidence intervals and carrying out
hypothesis tests regarding the value of a population variance.
20. A condition of using the chi-squared test statistic for testing the variance is that the population random
variable have a normal distribution.
21. A left-tailed area in the chi-squared distribution equals 0.95. For 6 degrees of freedom the critical
value equals 12.592.
22. The area to the right of a certain critical value on a chi-squared distribution is 0.025. For 5 degrees of
freedom, the critical value is 11.143.
23. The test statistic used to test hypotheses about the population variance is given by
2 = (n − 1)s2 /
2,
which is chi-squared distributed with n − 1 degrees of freedom when the population random variable is
normally distributed with variance equal to
2.
24. A random sample is drawn from a normal distribution with mean
and variance
2. The random
variable (n − 1)S2 /
2 has a chi-squared probability distribution with n degrees of freedom.
25. Two uses for the population variance are to measure risk and consistency.
26. The statistic s2 is an unbiased and consistent estimator of
2.
27. Which of the following is an example illustrating the use of variance?
a.
As a measure of risk.
b.
As a judge of consistency.
c.
To search for and reduce variability in a process.
d.
All of these choices are true.
ANS:
28. A random sample of 25 observations is selected from a normally distributed population. The sample
variance is 10. In the 95% confidence interval for the population variance, the upper limit is:
a.
19.353
b.
17.331
c.
17.110
d.
6.097
29. The statistic (n − 1)s2 /
2 has a chi-squared distribution with n − 1 degrees of freedom if:
a.
the sample has a Student t-distribution with degrees of freedom equal to n − 1.
b.
the sample is normally distributed with variance equal to s2.
c.
the population is normally distributed with variance equal to
2.
d.
All of these choices are true.
30. Which of the following conditions is needed regarding the chi-squared test statistic for the test of
variance?
a.
The population random variable must be normal.
b.
The test statistic must be a non-negative number.
c.
The test statistic must have a chi-squared distribution with n − 1 degrees of freedom.
d.
All of these choices are true.
31. In a hypothesis test for the population variance, the hypotheses are H0:
2 = 30 vs. H1:
2 < 30. If the
sample size is 20 and the test is being carried out at the 5% level of significance, the null hypothesis is
rejected if:
a.
2 < 30.144.
b.
2 > 10.851.
c.
2 < 10.117.
d.
2 > 31.410.
32. In a hypothesis test for the population variance, the hypotheses are H0:
2 = 100 vs. H1:
2 100. If the
sample size is 15 and the test is being carried out at the 10% level of significance, the rejection region
is:
a.
2 < 6.571 or
2 > 23.685.
b.
2 < 7.790 or
2 > 21.064.
c.
2 < 8.547 or
2 > 22.307.
d.
2 < 7.261 or
2 < 24.996.
33. The sum of squared deviations from the mean divided by the population variance has a(n)
____________________ distribution with ____________________ degrees of freedom.
34. The test statistic used to test hypotheses about the population variance has a(n)
____________________ distribution with ____________________ degrees of freedom.
35. The test statistic to test hypotheses about the population variance has a chi-squared distribution with n
− 1 degrees of freedom when the population random variable has a(n) ____________________
distribution.
36. The chi-squared test and estimator of the population variance ____________________(are/are not)
valid if the population is slightly to moderately nonnormal.
37. The test statistic used to test hypotheses about the population variance has a chi-squared distribution
with ____________________ degrees of freedom.
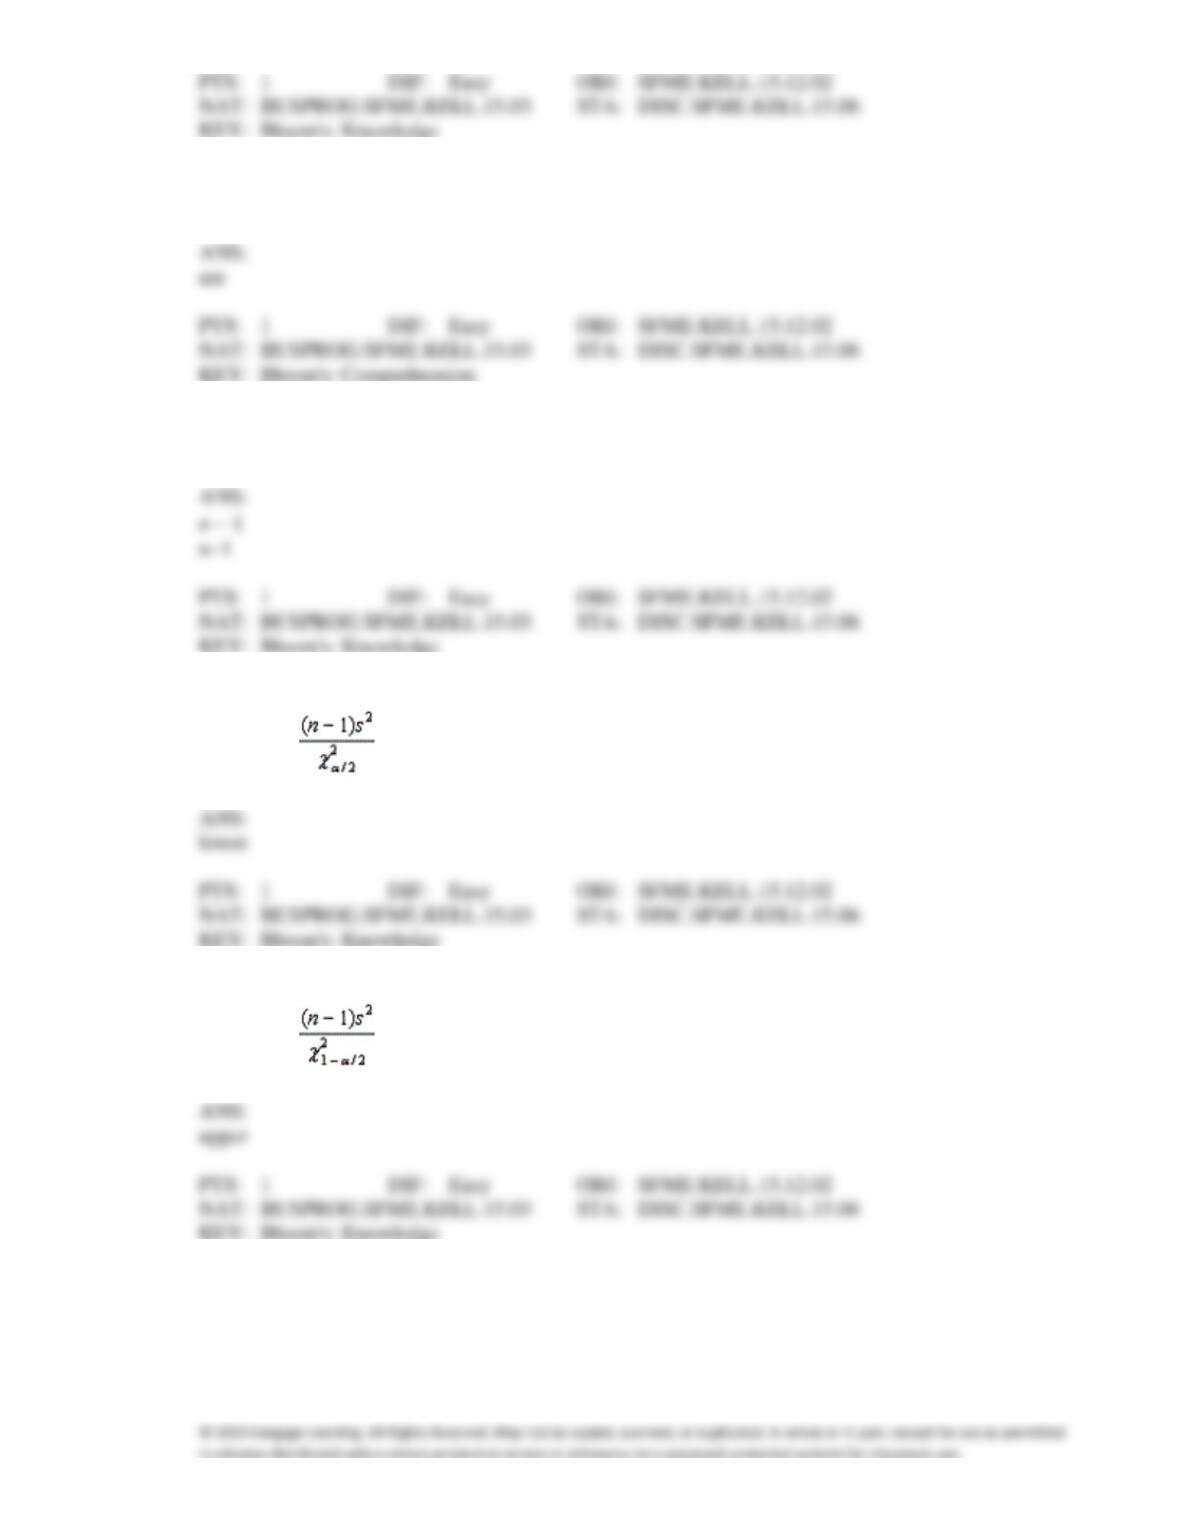
38. The ____________________ confidence limit of the confidence interval estimator of the population
variance is .
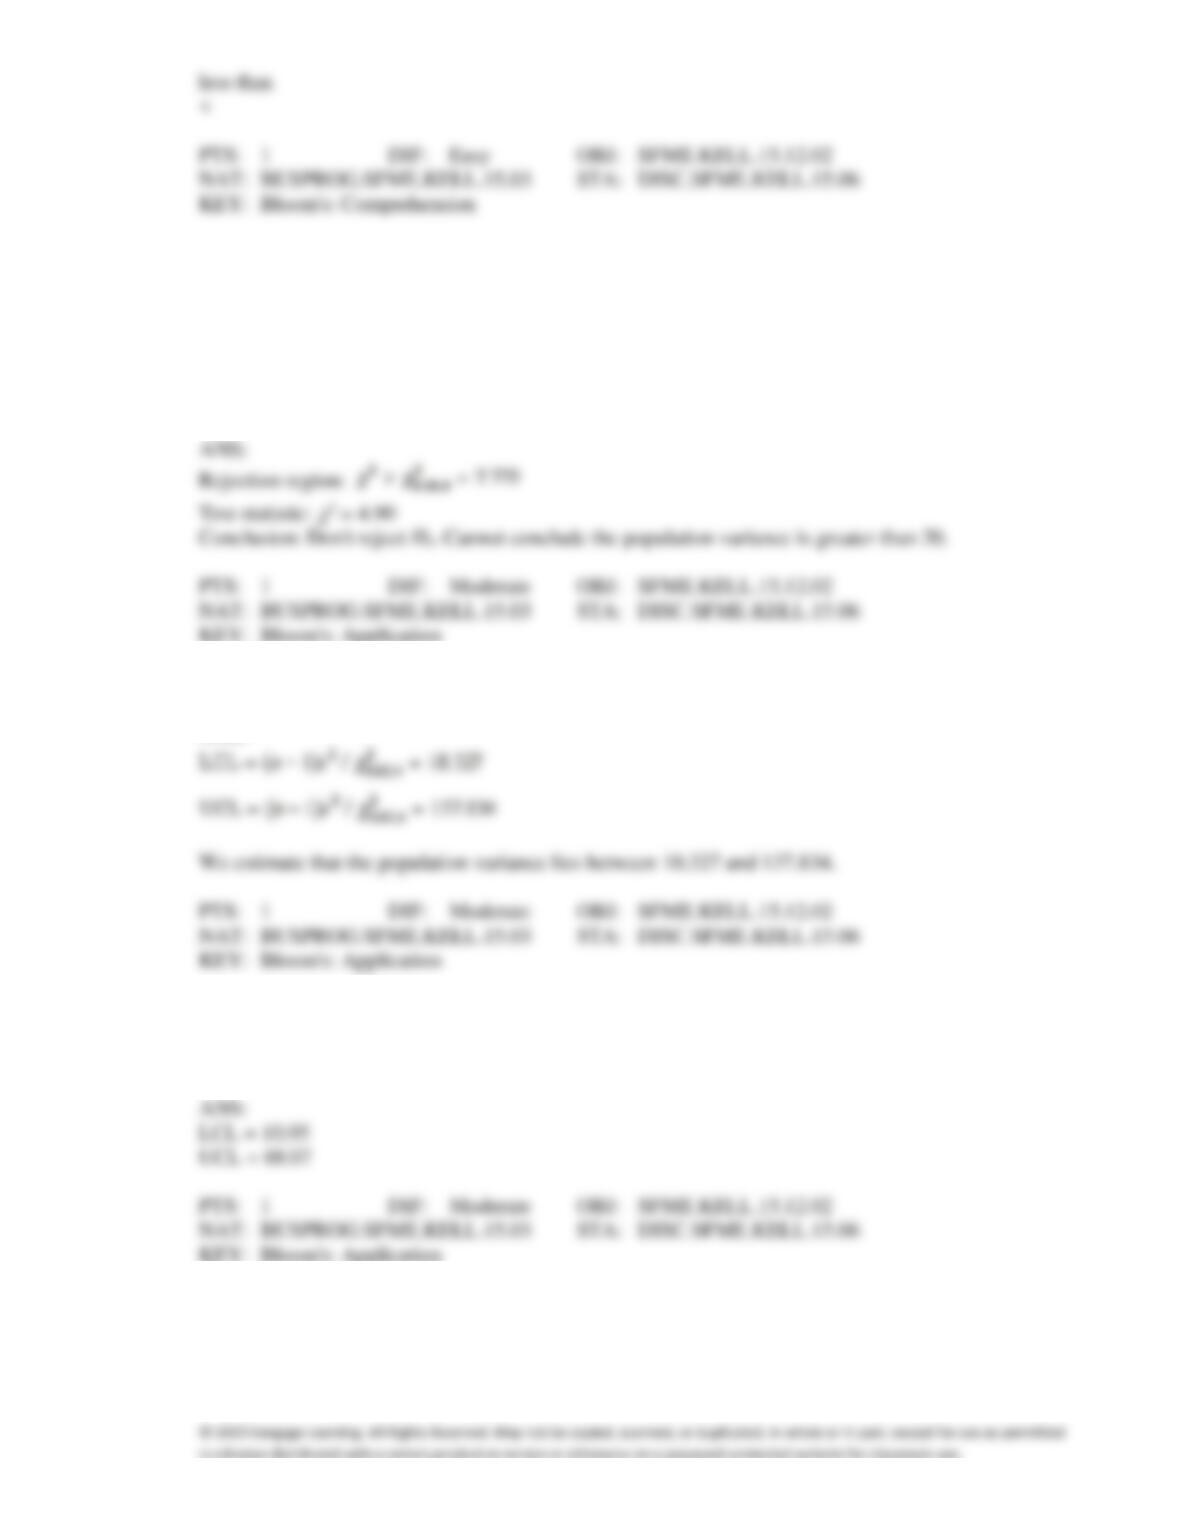
39. The ____________________ confidence limit of the confidence interval estimator of the population
variance is .
40. If we are testing for an improvement in the consistency of an operation or the manufacturing of a
product, the alternative hypothesis would have a(n) ____________________ sign in it.
ANS:
Science Quiz Scores
Consider the hypotheses H0:
2 = 20 vs. H1:
2 > 20. Assume that Science scores on a 25-point quiz
for a random sample of 5 students were drawn from a normal population. These were: 18, 16, 10, 13,
and 23.
41. {Science Quiz Scores Narrative} Test the hypotheses at the 10% significance level.
42. {Science Quiz Scores Narrative} Estimate the population variance with 90% confidence.
ANS:
43. An investor is concerned with the risk associated with a portfolio of stocks. He draws a random sample
of nine monthly returns (expressed as a percentage of the initial investment). These data follow: 2, 5,
−6, 10, 1, 2, −3, 0, and 7. Find a 95% confidence interval estimate of the population variance.
44. A pharmaceutical company has just developed a new capsule to alleviate the symptoms of allergies
and colds. However, they are concerned about the variability in the amount of time until the drug
becomes effective. In a random sample of 10 individuals who suffer from allergies, the amount of time
(in hours) for the capsule to take effect was recorded and listed as follows: 5, 7, 6, 10, 9, 12, 8, 17, 4,
and 16. Estimate with 90% confidence the variance of the time for the drug to become effective.
45. The sales manager of a large multinational corporation is concerned that some salespersons perform
very well and others quite poorly. To help analyze the problem he draws a random sample of 20
salespersons, determines their commission incomes (in thousands of dollars), and calculates the
following statistics: = $37.2, and s = $7.8. Do these statistics provide sufficient evidence at the 5%
significance level to conclude that the population variance exceeds $35 million2?
Applicants’ Grades
The grades of a sample of 10 applicants, selected at random from a large population, are 71, 86, 75, 63,
92, 70, 81, 59, 80, and 90.
46. {Applicants’ Grades Narrative} Compute the sample variance.
47. {Applicants’ Grades Narrative} Construct a 90% confidence interval estimate for the population
variance.
ANS:

48. {Applicants’ Grades Narrative} Construct a 90% confidence interval estimate for the population
standard deviation.
49. In determining the sample size needed to estimate the population proportion p, we let the sample
proportion = 1 if we have no knowledge of even the approximate values of .
50. The lower limit of the 90% confidence interval for the population proportion p, given that n = 400 and
= 0.10, is 0.0247.
51. The sampling distribution of is approximately normal if the sample size is more than 30.
52. In testing a hypothesis about a population proportion p, the z test statistic measures how close the
computed sample proportion has come to the hypothesized population parameter.
ANS: