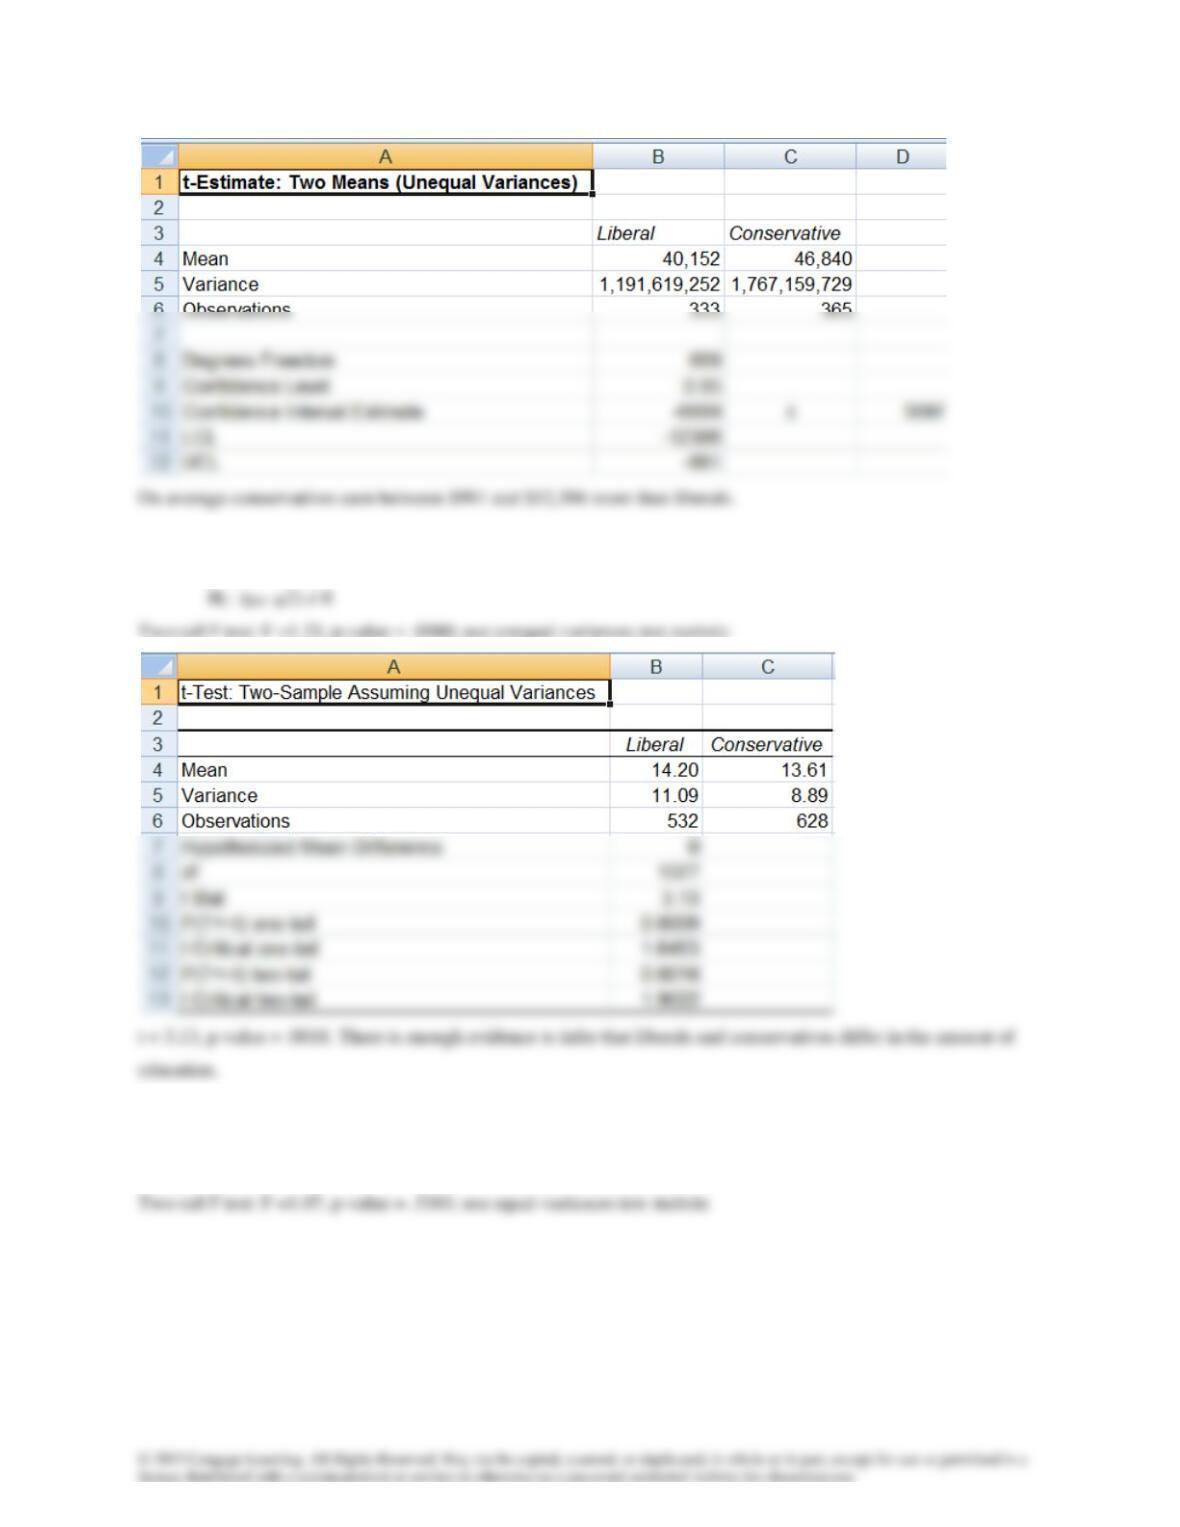
13.55 H0: (μ1– μ2) = 0
13.56 H0: (μ1– μ2) = 0
H1: (μ1– μ2) < 0
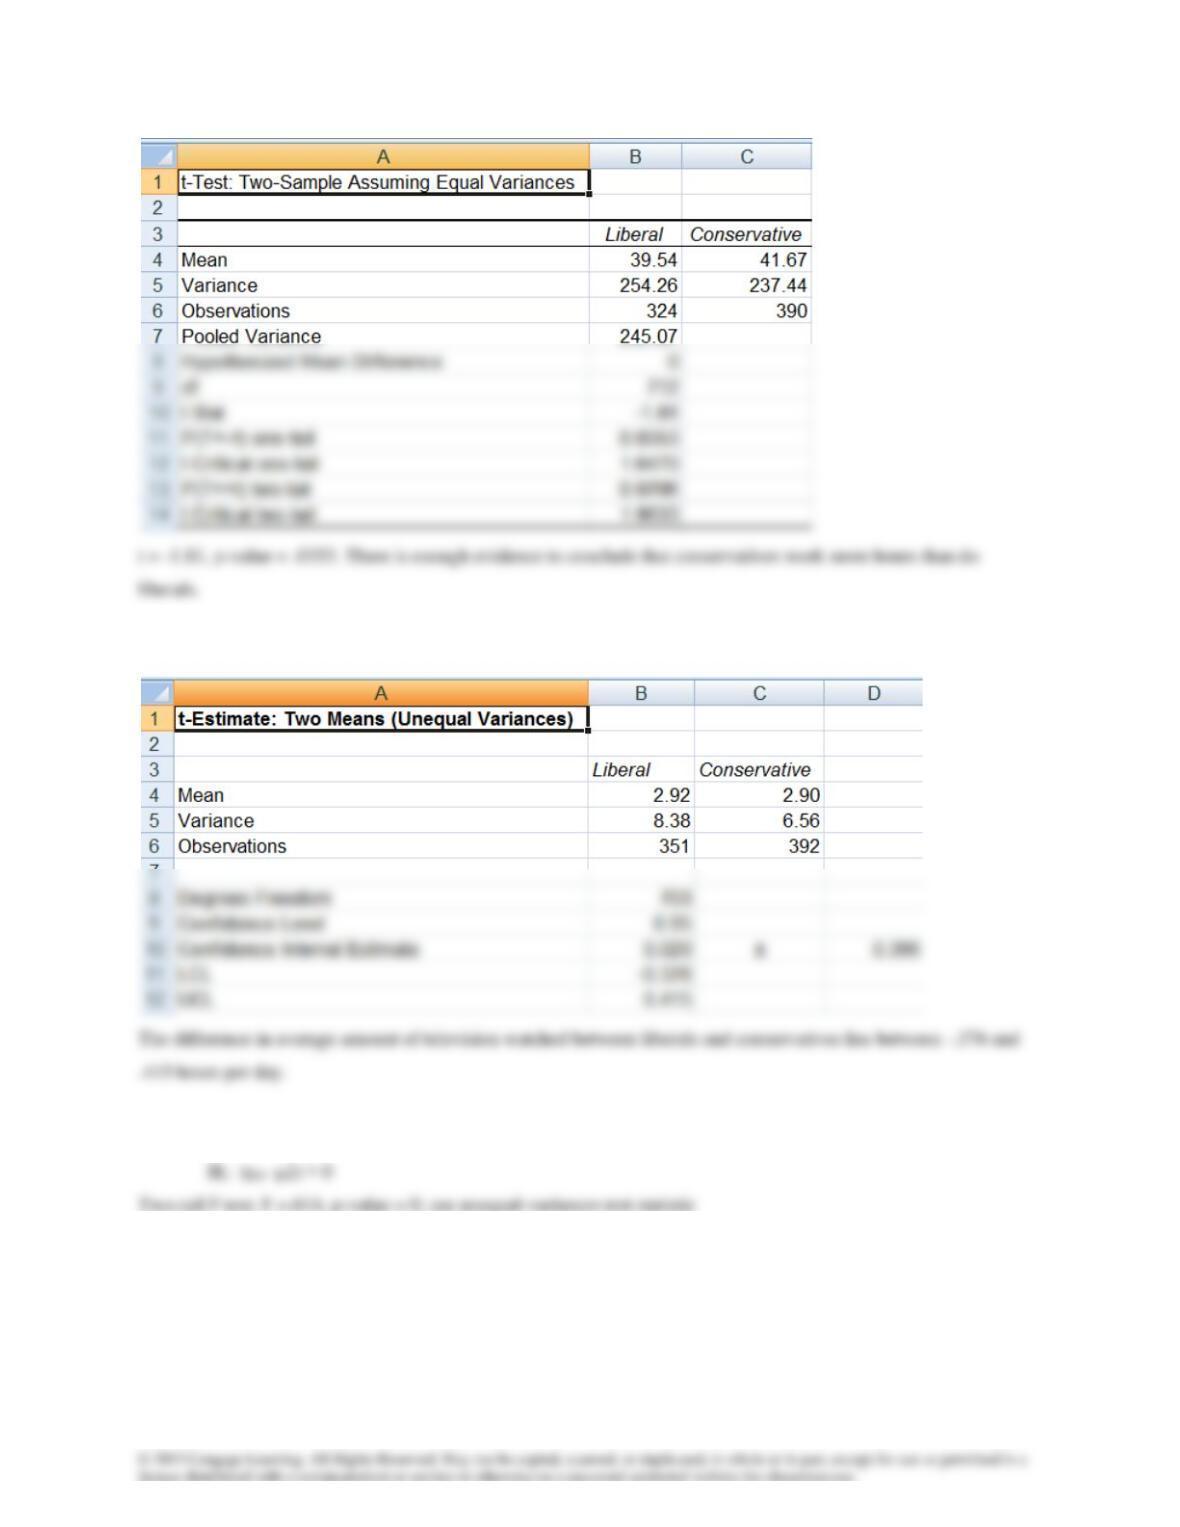
13.57 Two-tail F test: F =1.28, p-value = .0183; use unequal-variances estimator
13.58 H0: (μ1– μ2) = 0
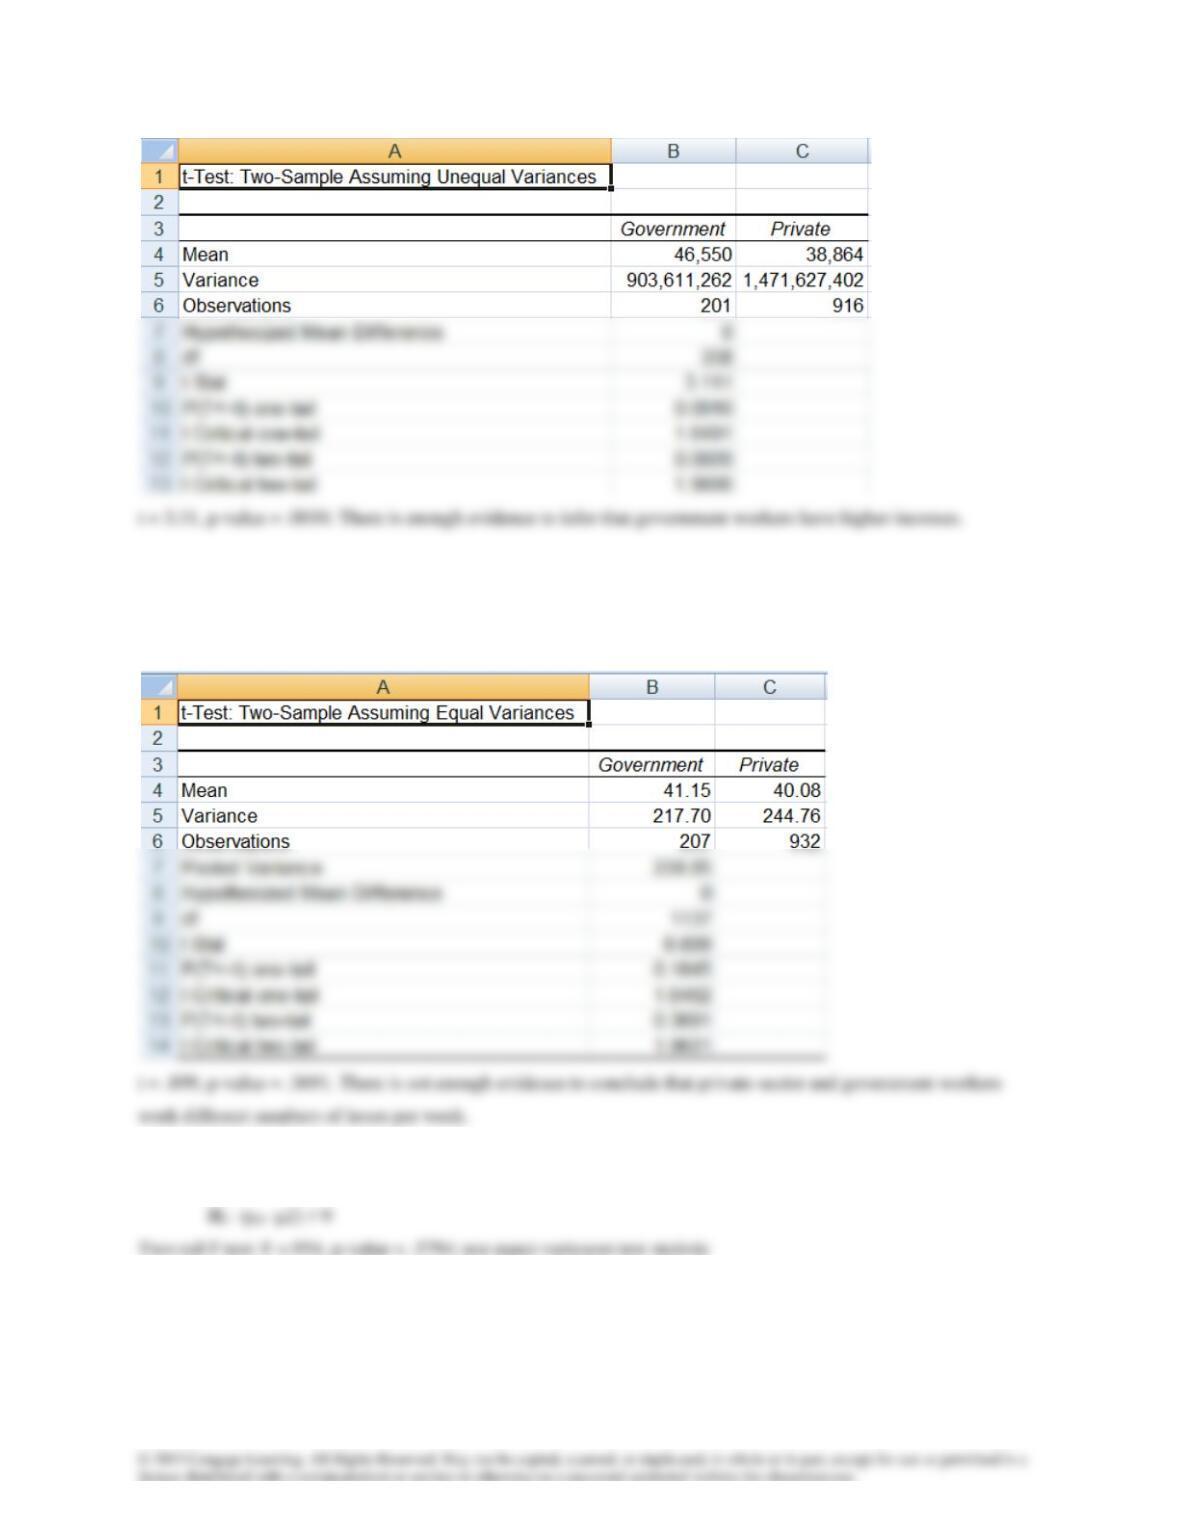
13.59 H0: (μ1– μ2) = 0
H1: (μ1– μ2) ≠ 0
Two-tail F test: F =.889, p-value = .2990; use equal-variances test statistic
13.60 H0: (μ1– μ2) = 0
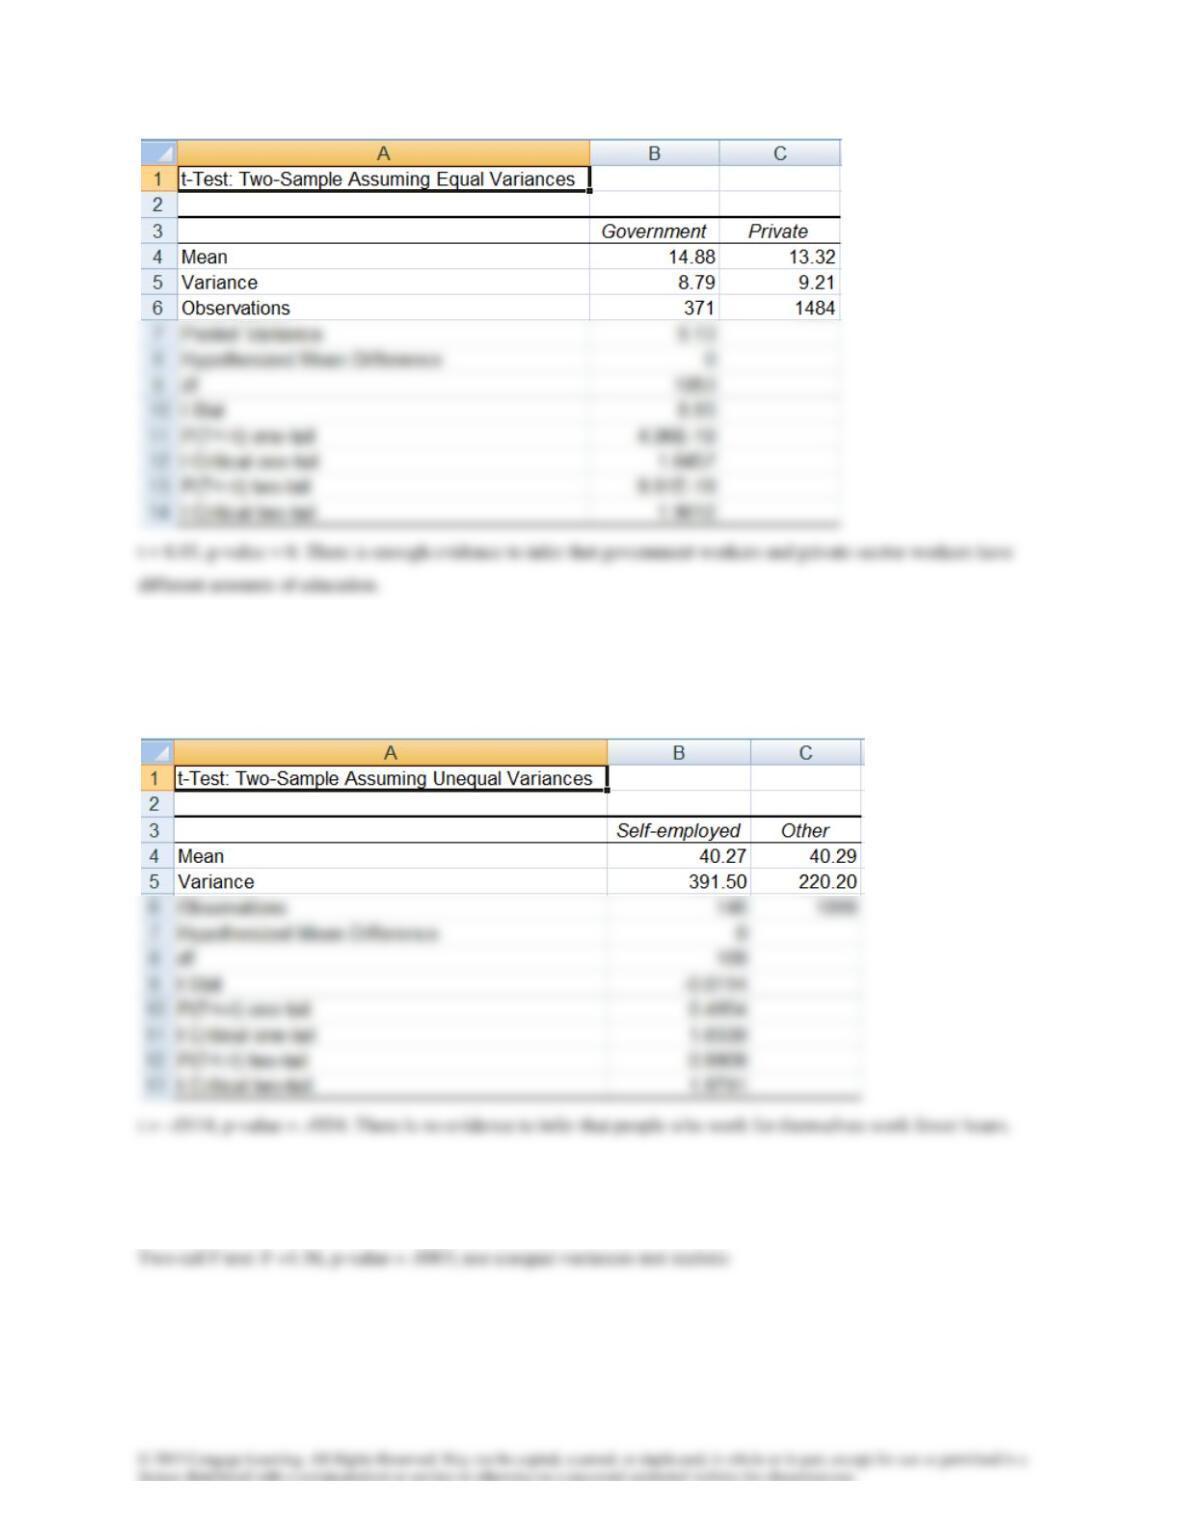
13.61 H0: (μ1– μ2) = 0
H1: (μ1– μ2) < 0
Two-tail F test: F =1.78, p-value = 0; use unequal-variances test statistic
13.62 H0: (μ1– μ2) = 0
H1: (μ1– μ2) > 0
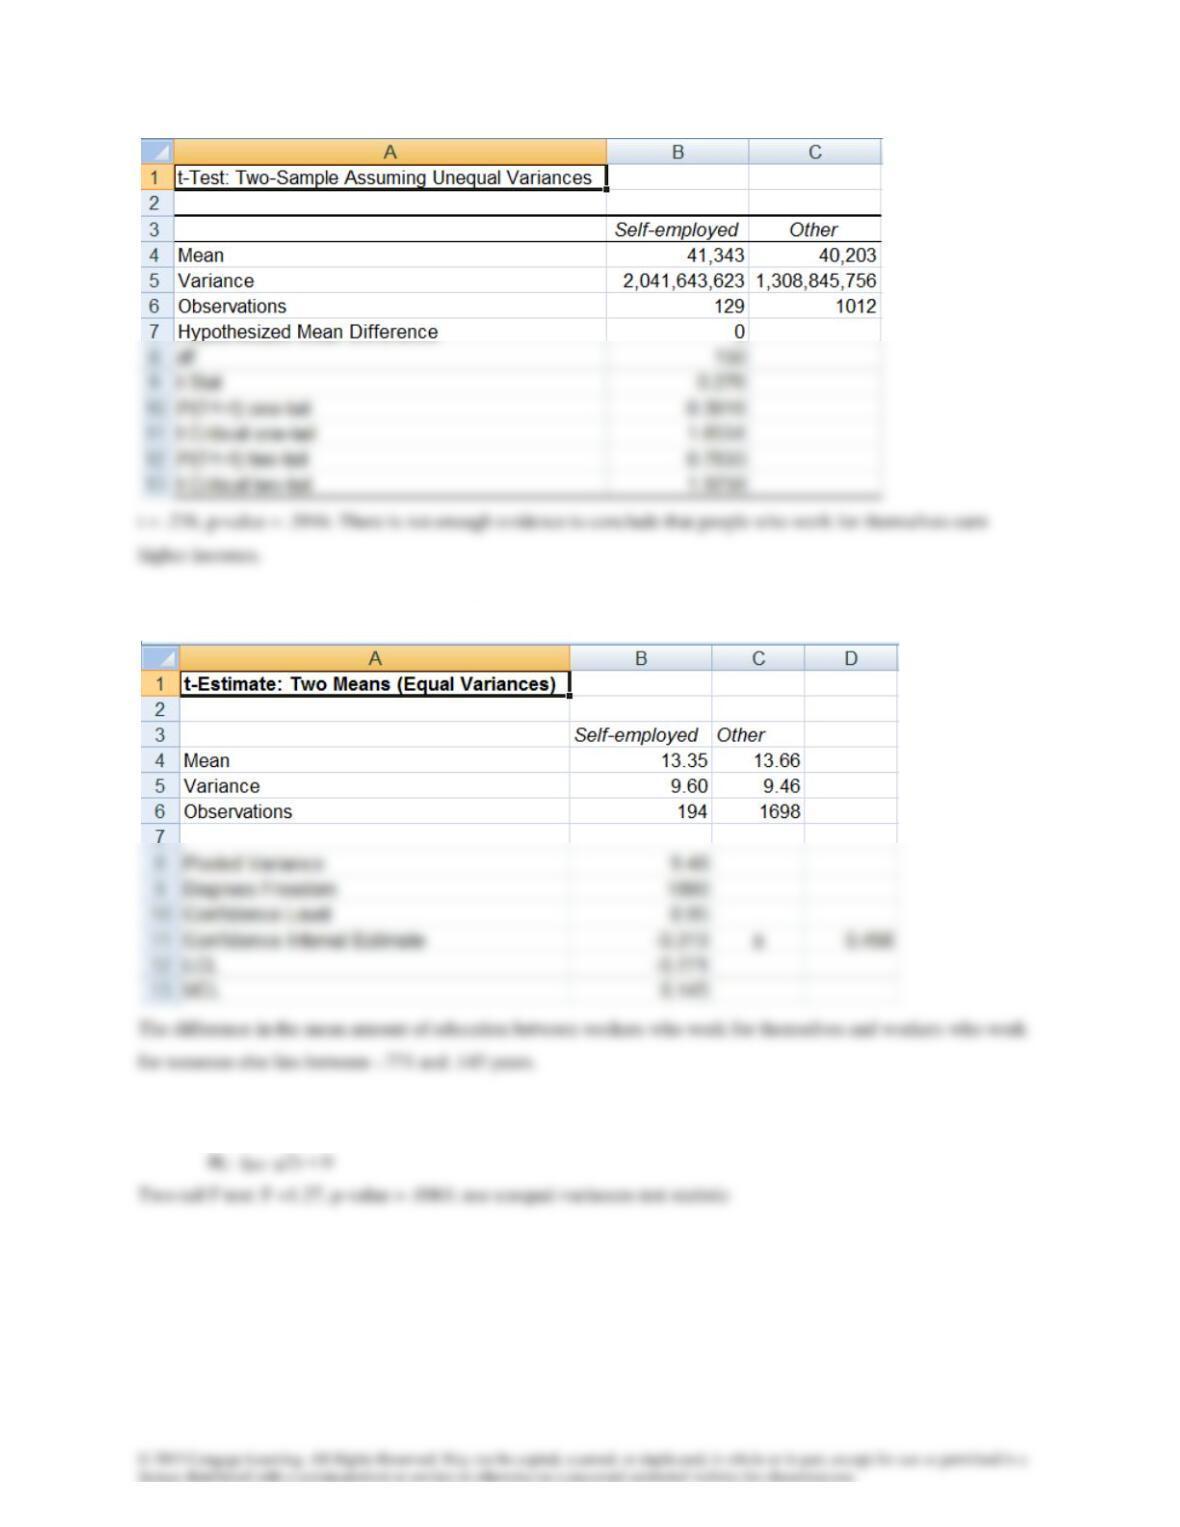
13.63 Two-tail F test: F =1.01, p-value = .8734; use equal-variances estimator
13.64 H0: (μ1– μ2) = 0
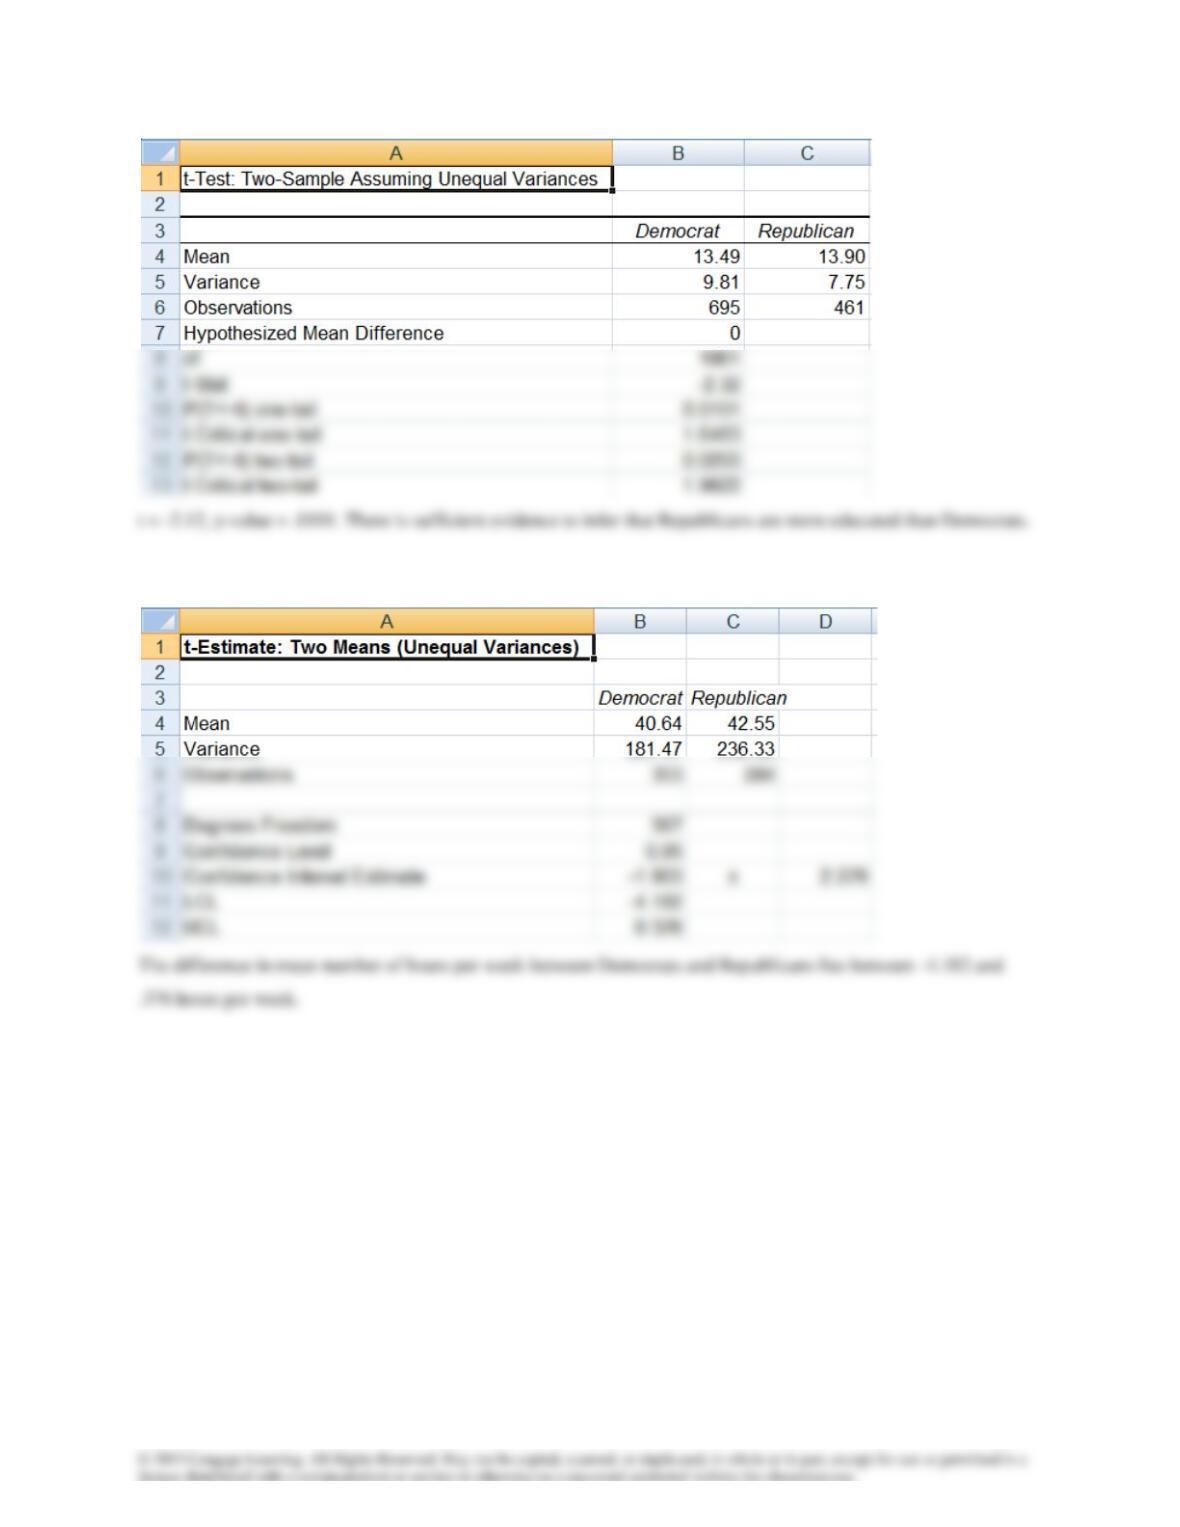
13.65 Two-tail F test: F =.768, p-value = .0188; use unequal-variances estimator
13.66 H0: (μ1– μ2) = 0
H1: (μ1– μ2) < 0
Two-tail F test: F =.650, p-value = 0; use unequal-variances test statistic
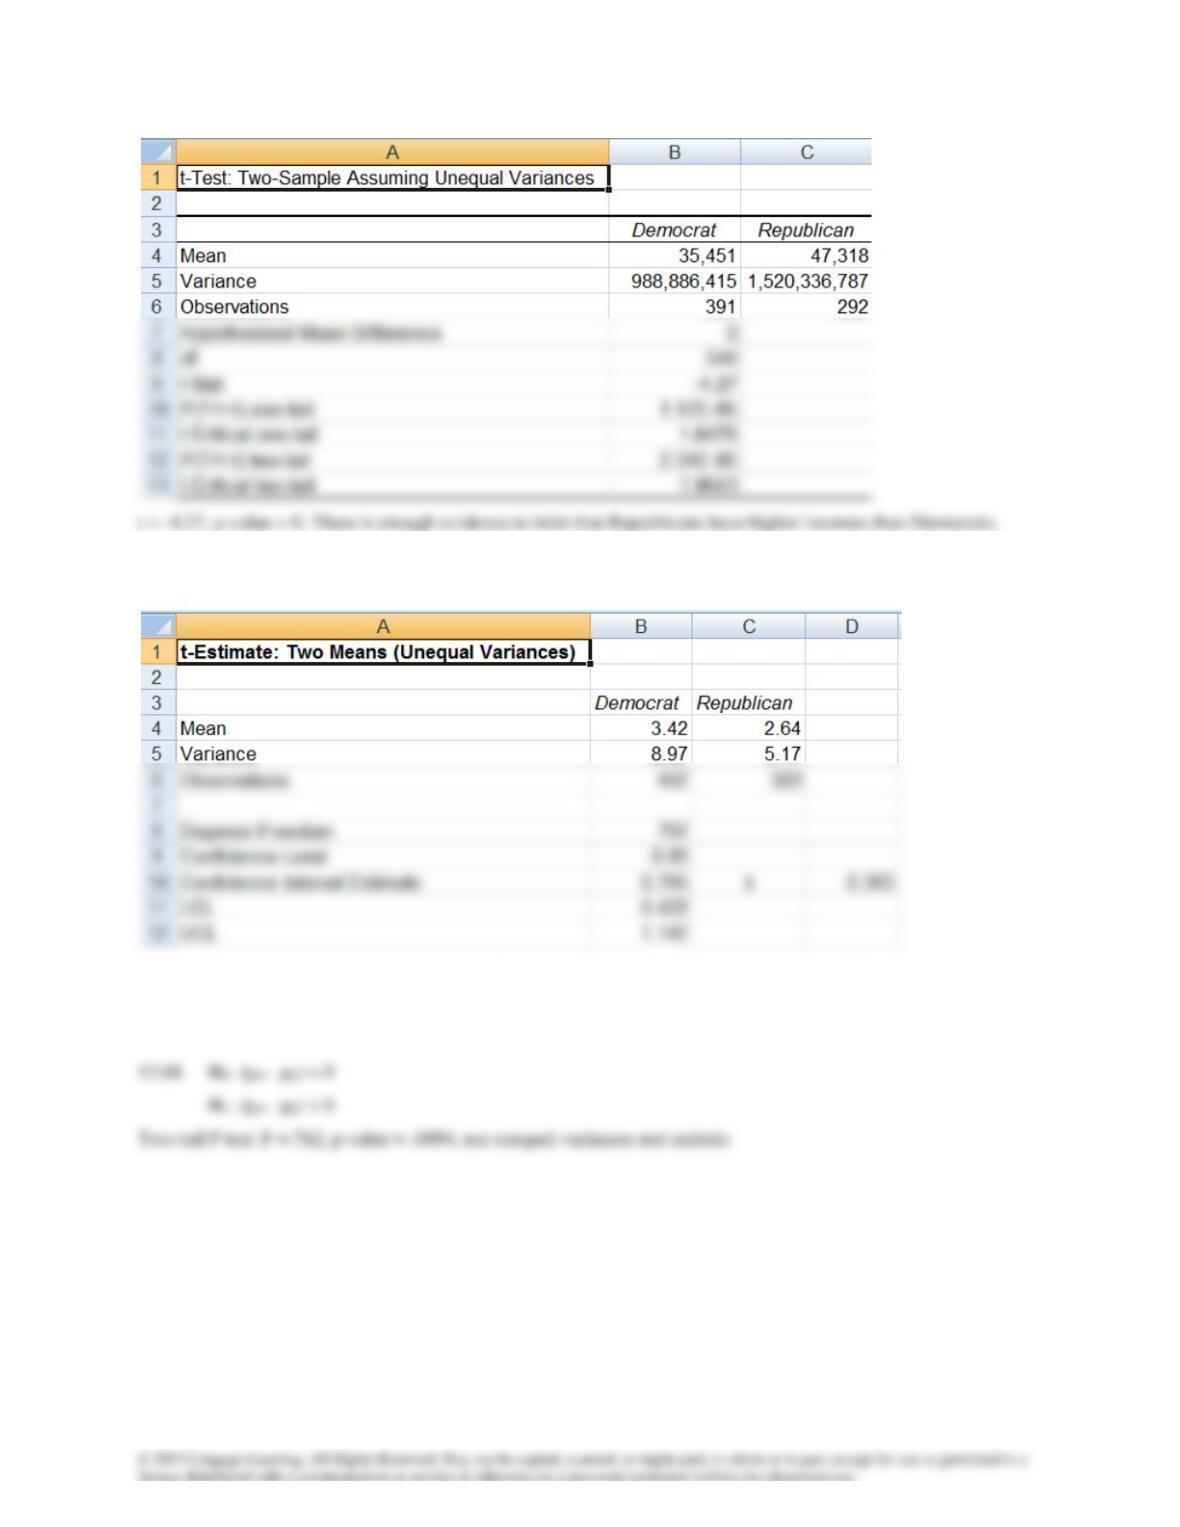
13.67 Two-tail F test: F =1.73, p-value = 0; use unequal-variances estimator
The difference in mean number of hours per day of television between Democrats and Republicans lies between
.422 and 1.147 hours per day.
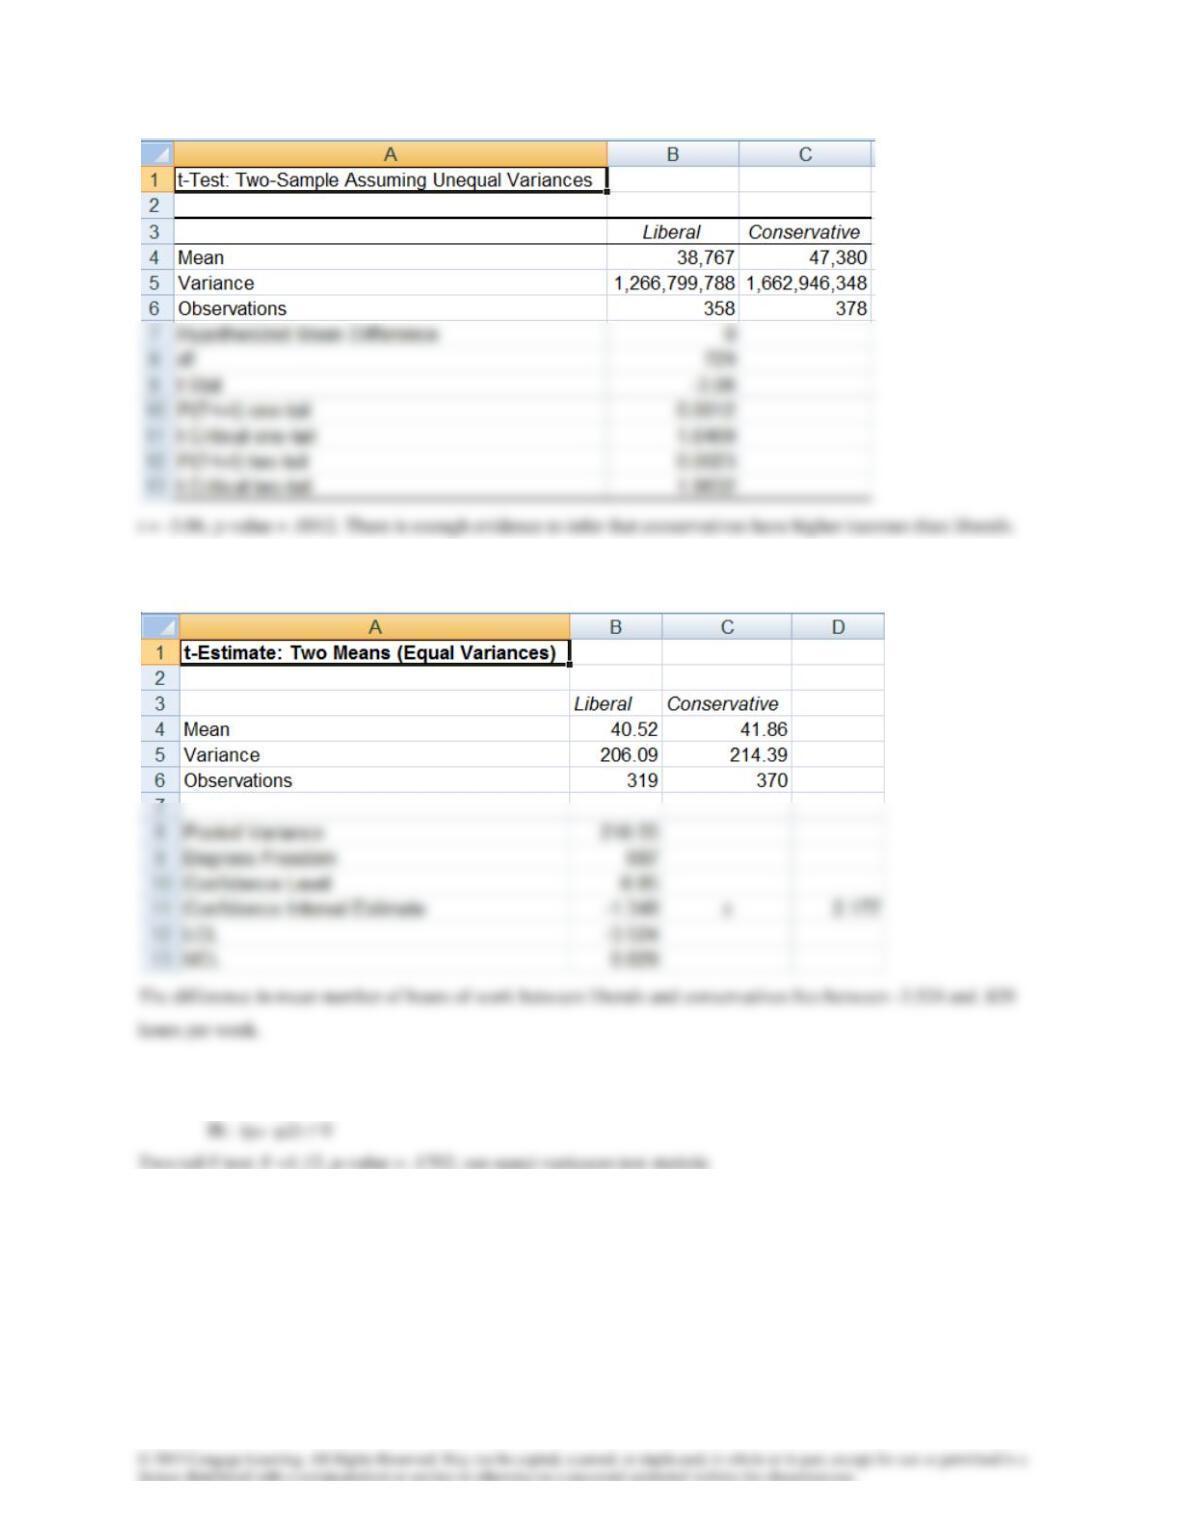
13.69 Two-tail F test: F =.961, p-value = .7173; use equal-variances estimator
13.70 H0: (μ1– μ2) = 0
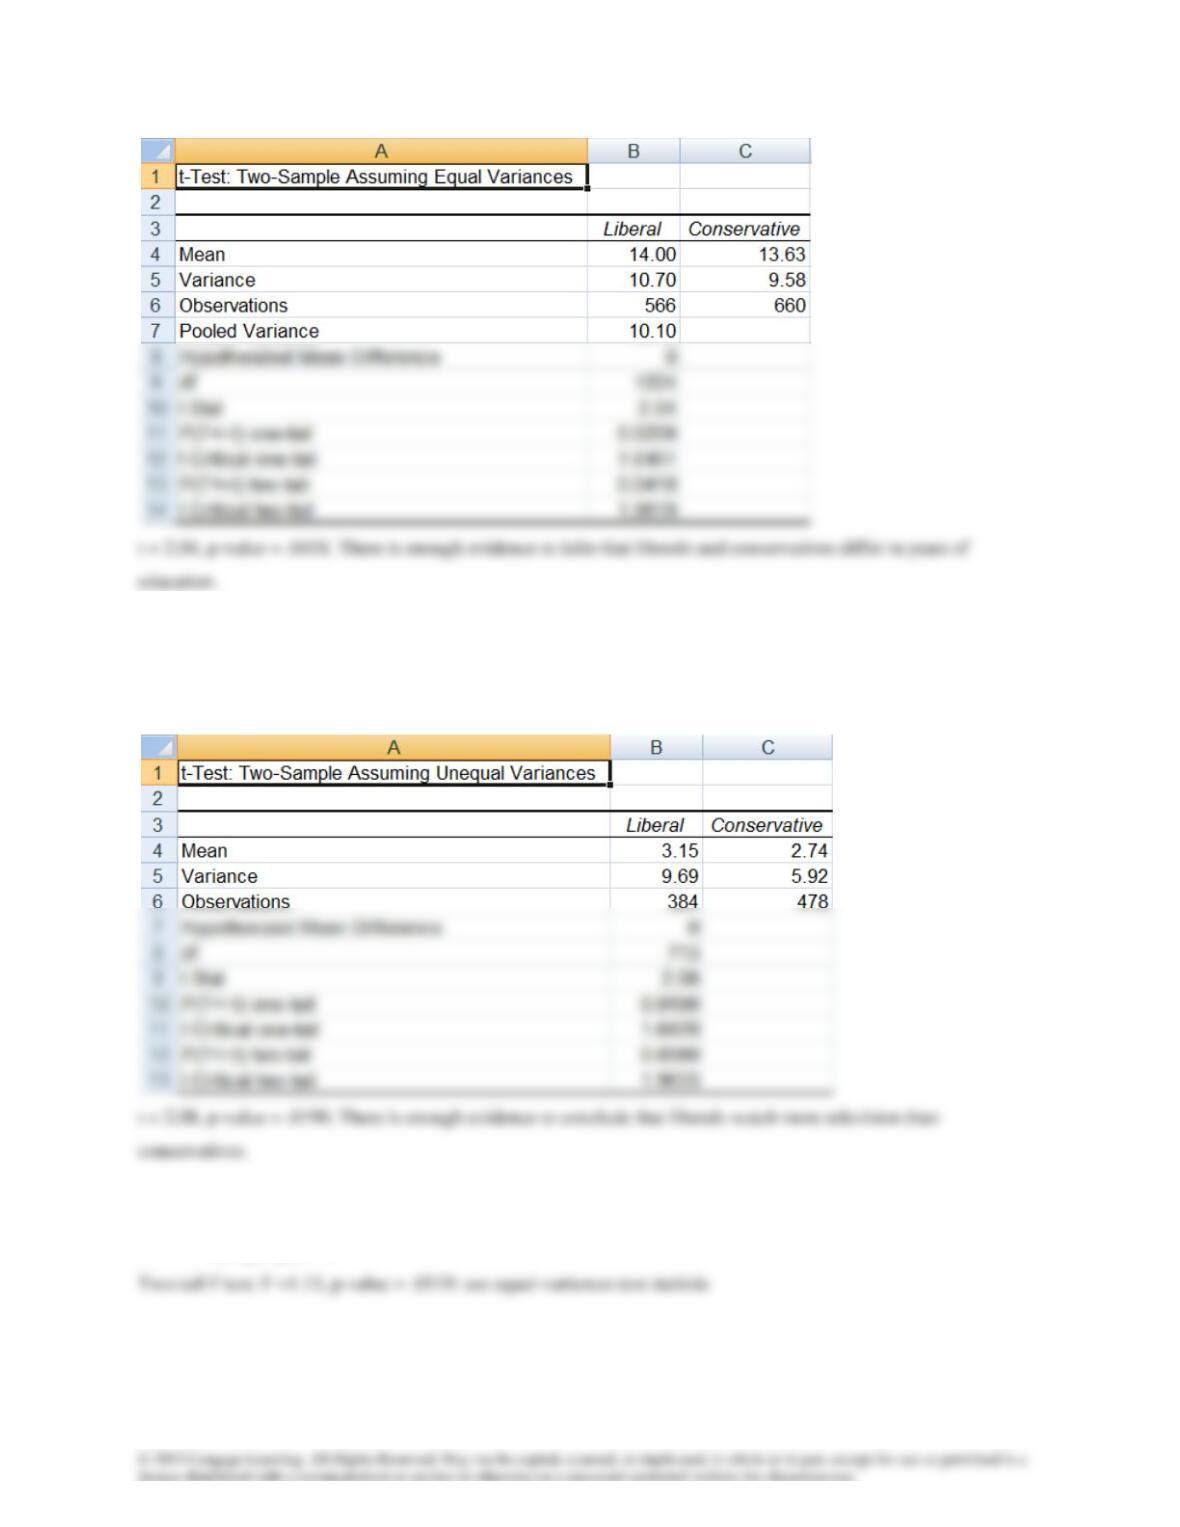
13.71 H0: (μ1– μ2) = 0
H1: (μ1– μ2) > 0
Two-tail F test: F =1.64, p-value = 0; use unequal-variances test statistic
13.72 H0: (μ1– μ2) = 0
H1: (μ1– μ2) < 0
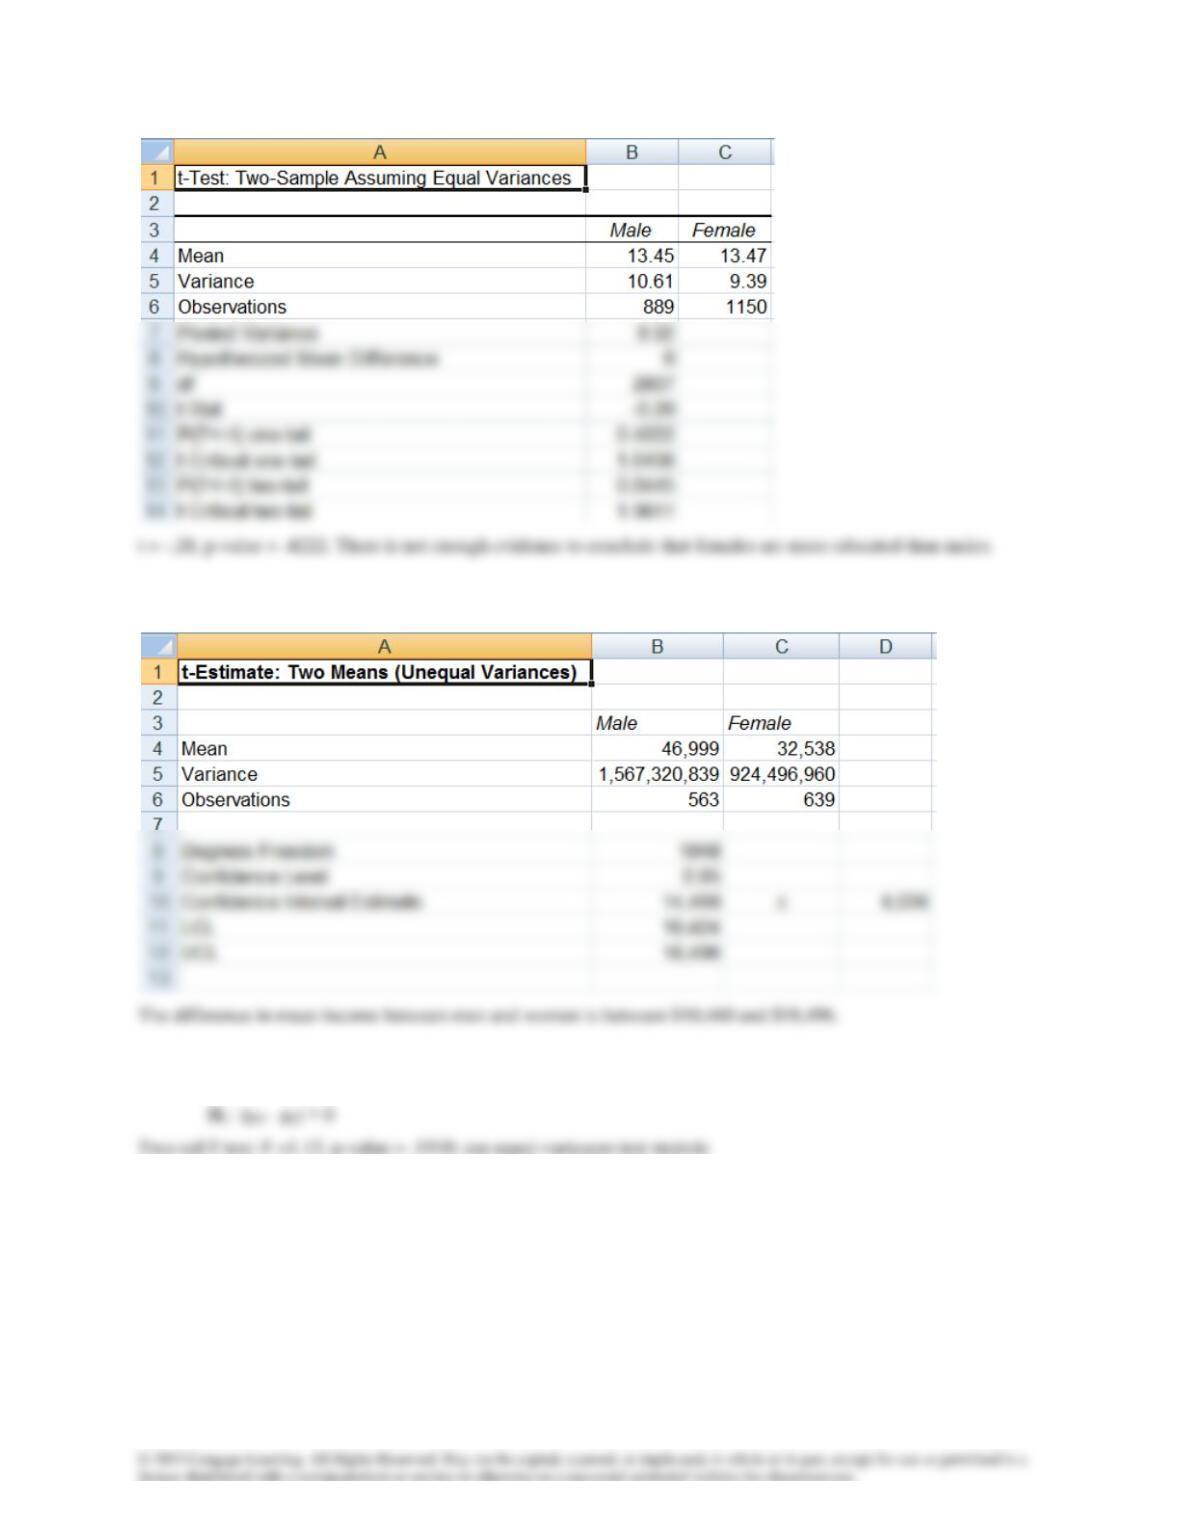
13.73 Two-tail F test: F =1.70, p-value = 0; use unequal-variances estimator
13.74 H0: (μ1– μ2) = 0
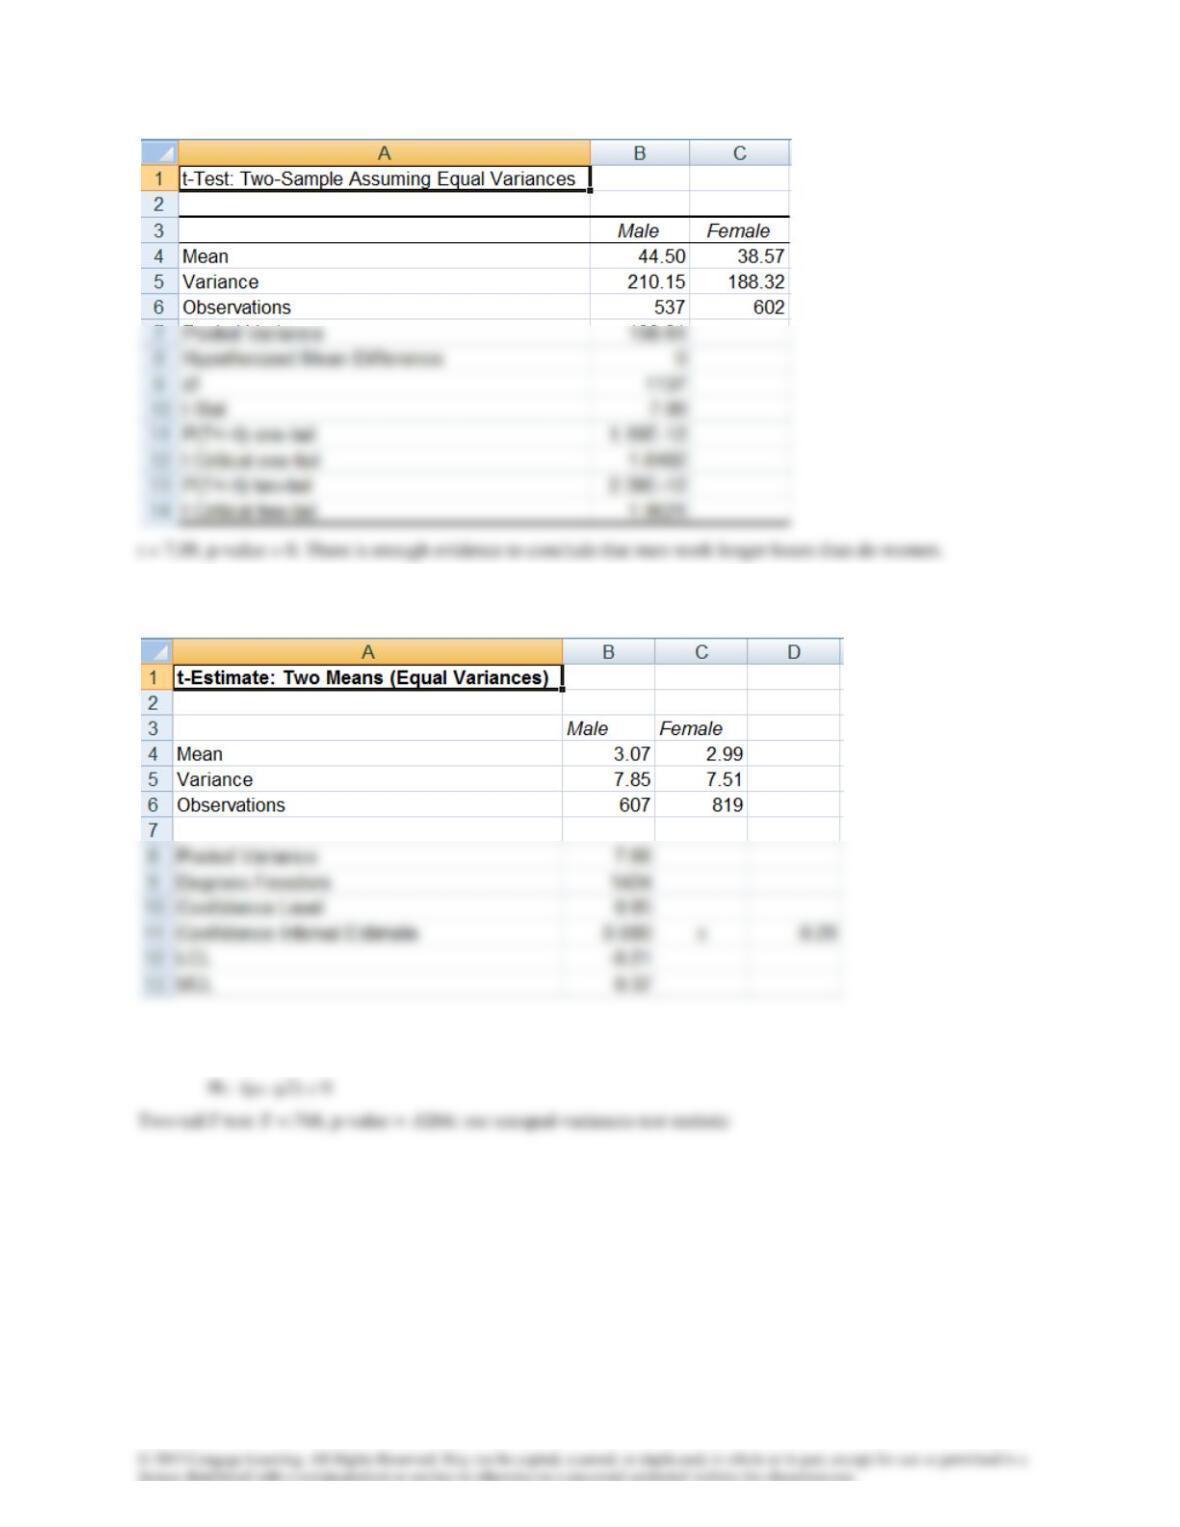
13.75 Two-tail F test: F =1.04, p-value = .5646; use equal-variances estimator
13.76 H0: (μ1– μ2) = 0
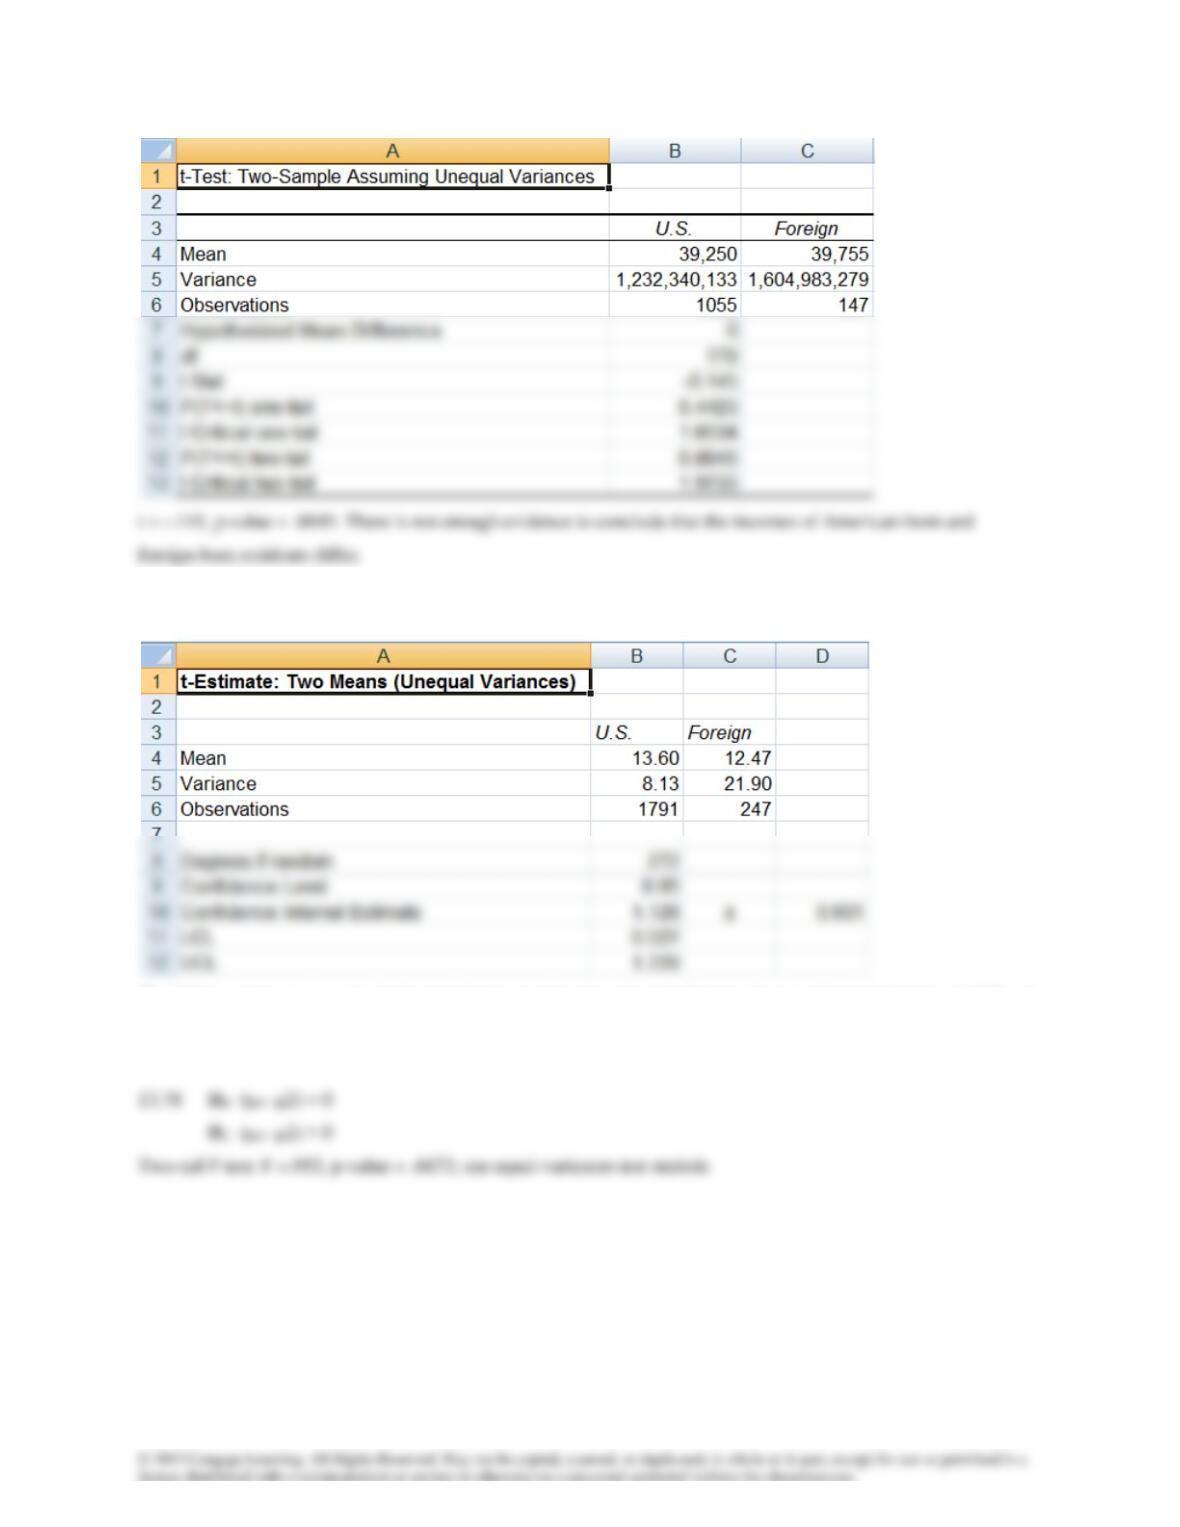
13.77 Two-tail F test: F =.371, p-value = 0; use unequal-variances estimator
The difference in mean years of education between American-born and foreign born residents lies between .527 and
1.729 years.
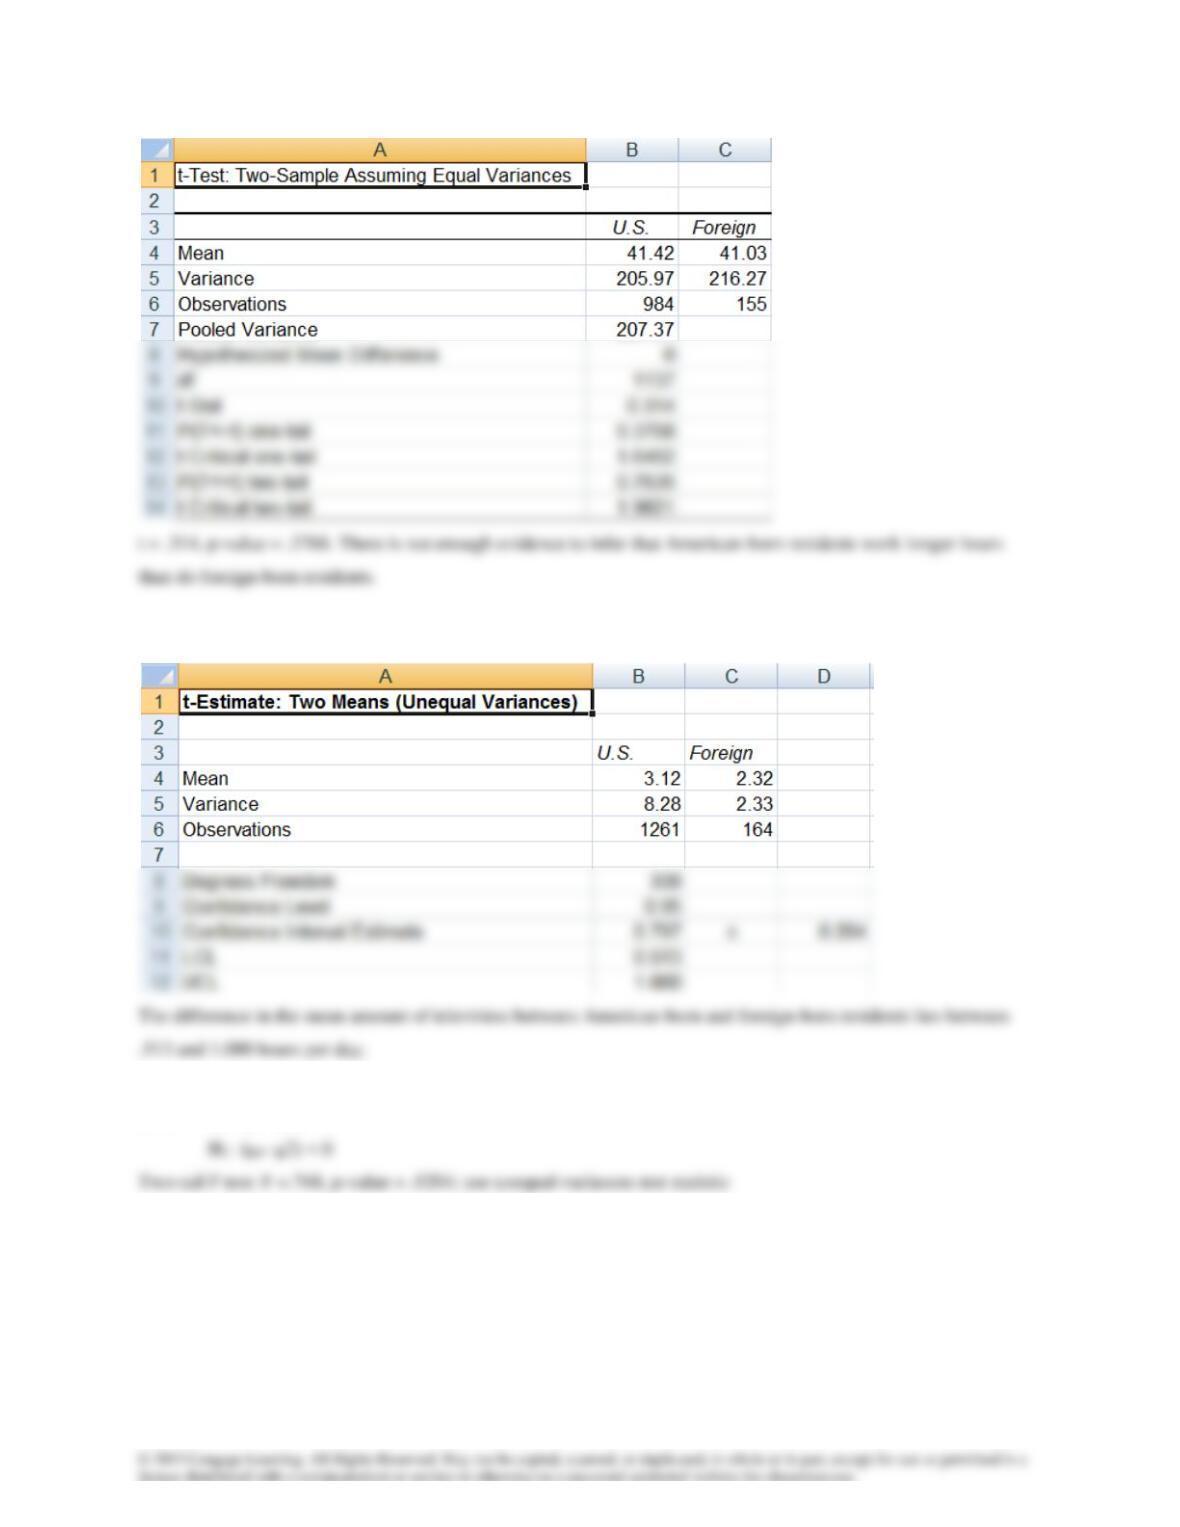
13.79 Two-tail F test: F =3.55, p-value = 0; use unequal-variances estimator
13.80 H0: (μ1– μ2) = 0
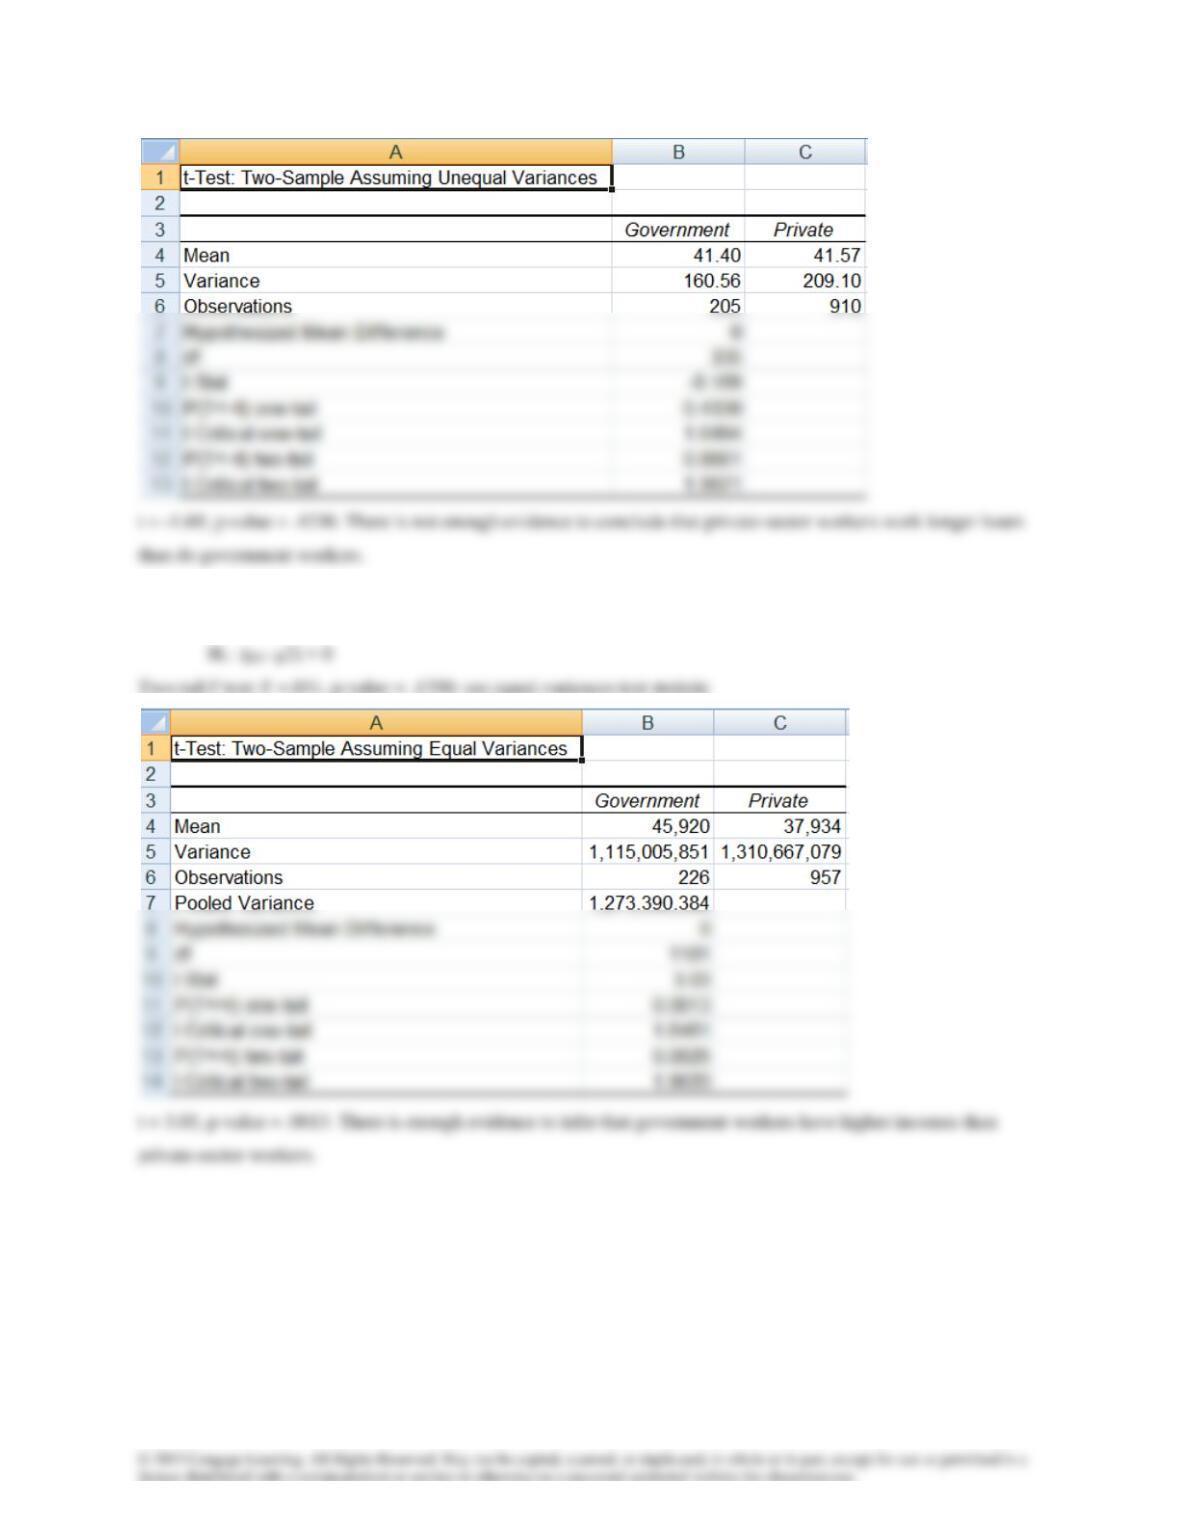
13.81 H0: (μ1– μ2) = 0
13.82 Two-tail F test: F =1.05, p-value = .5446; use equal-variances estimator
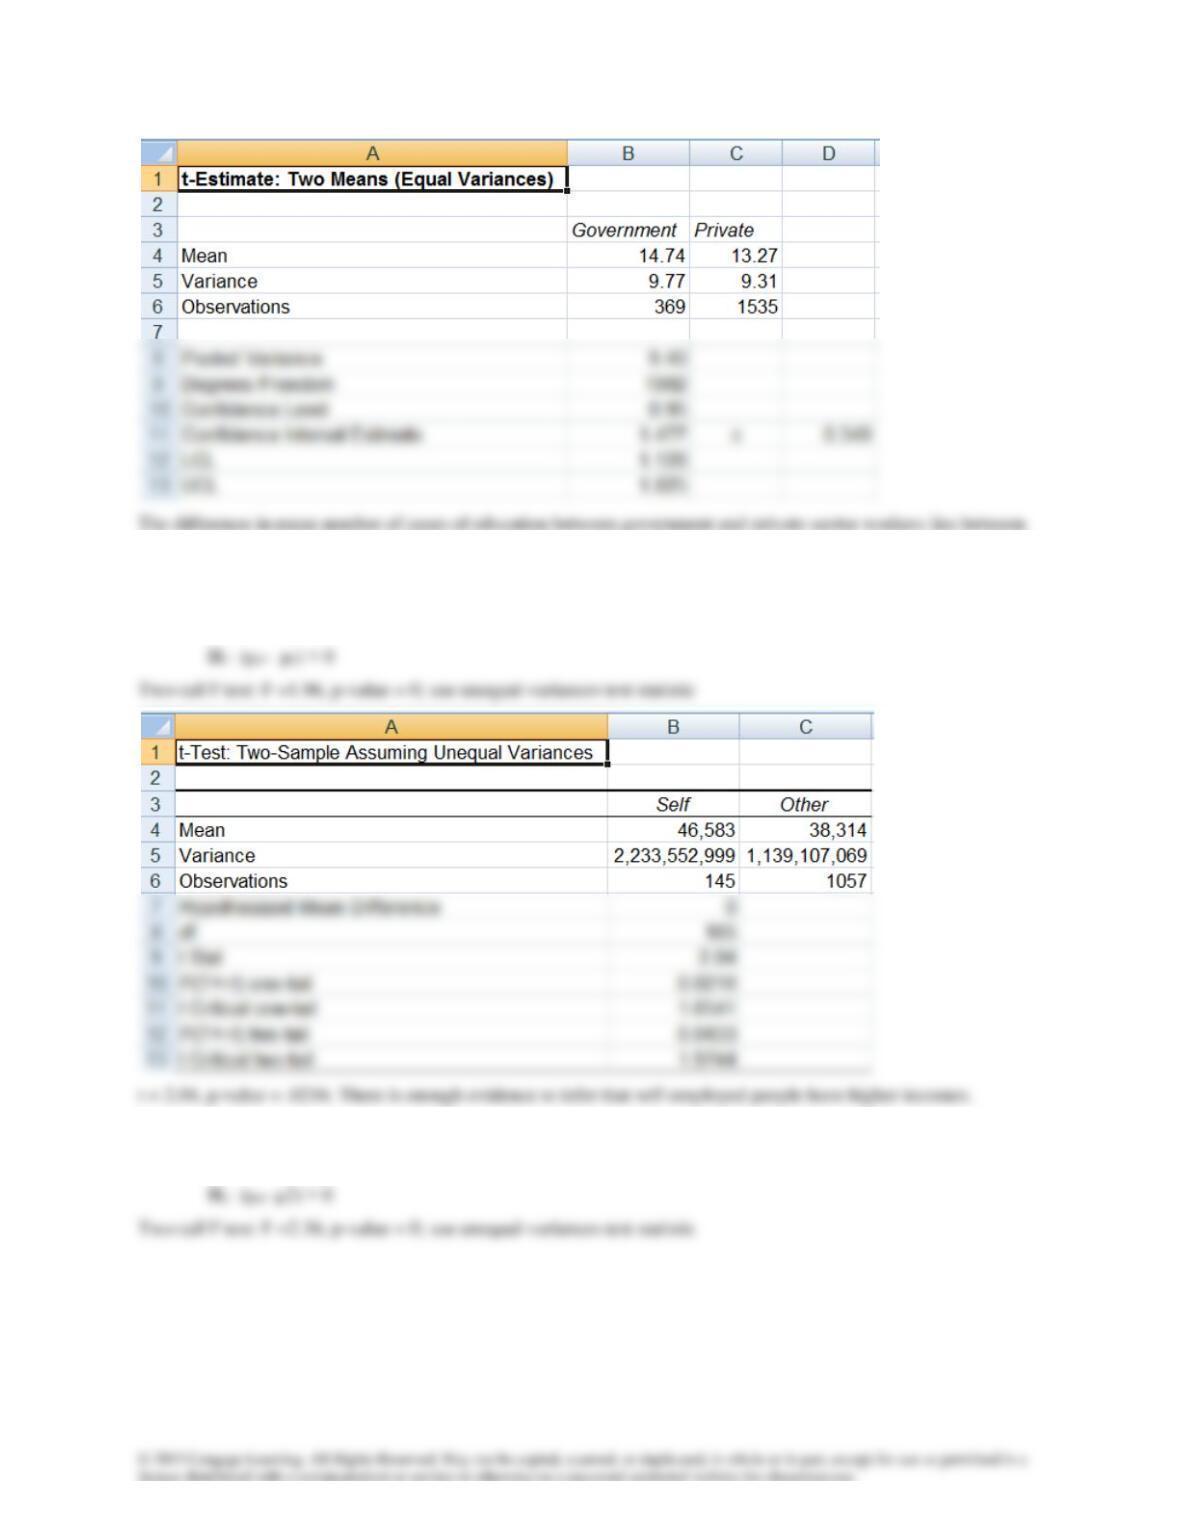
1.128 and 1.825 years.
13.83 H0: (μ1– μ2) = 0
13.84 H0: (μ1– μ2) = 0
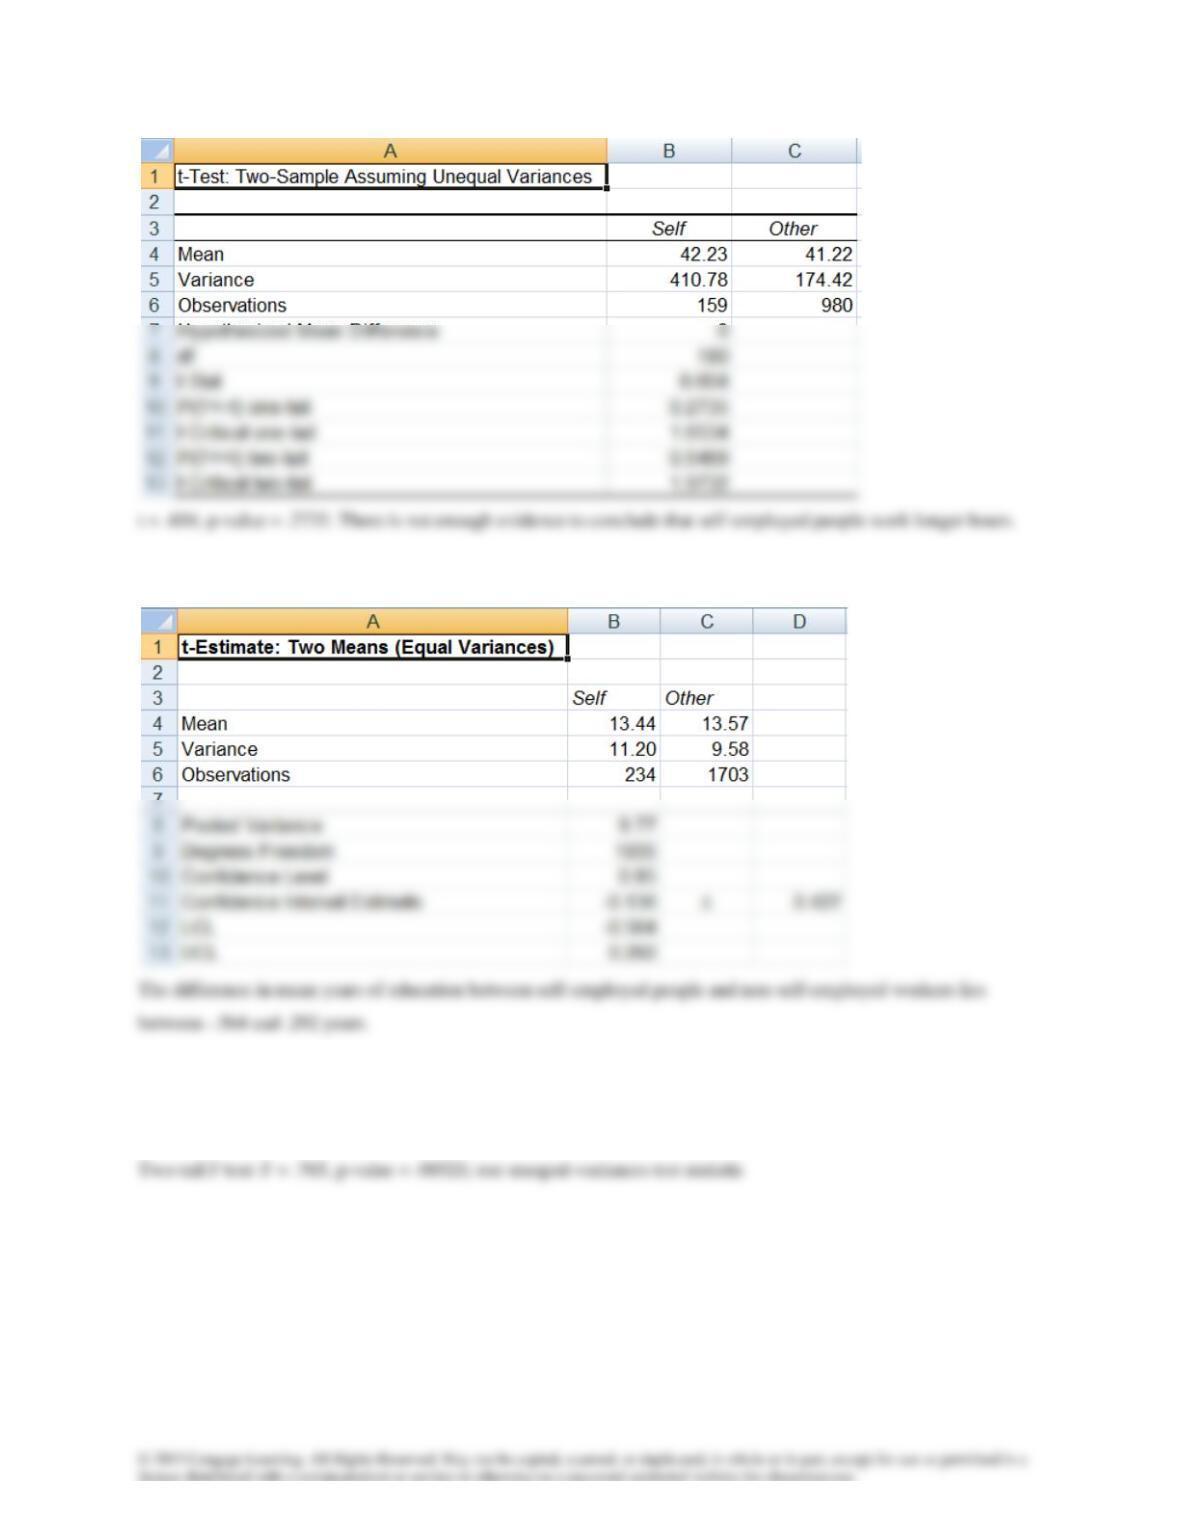
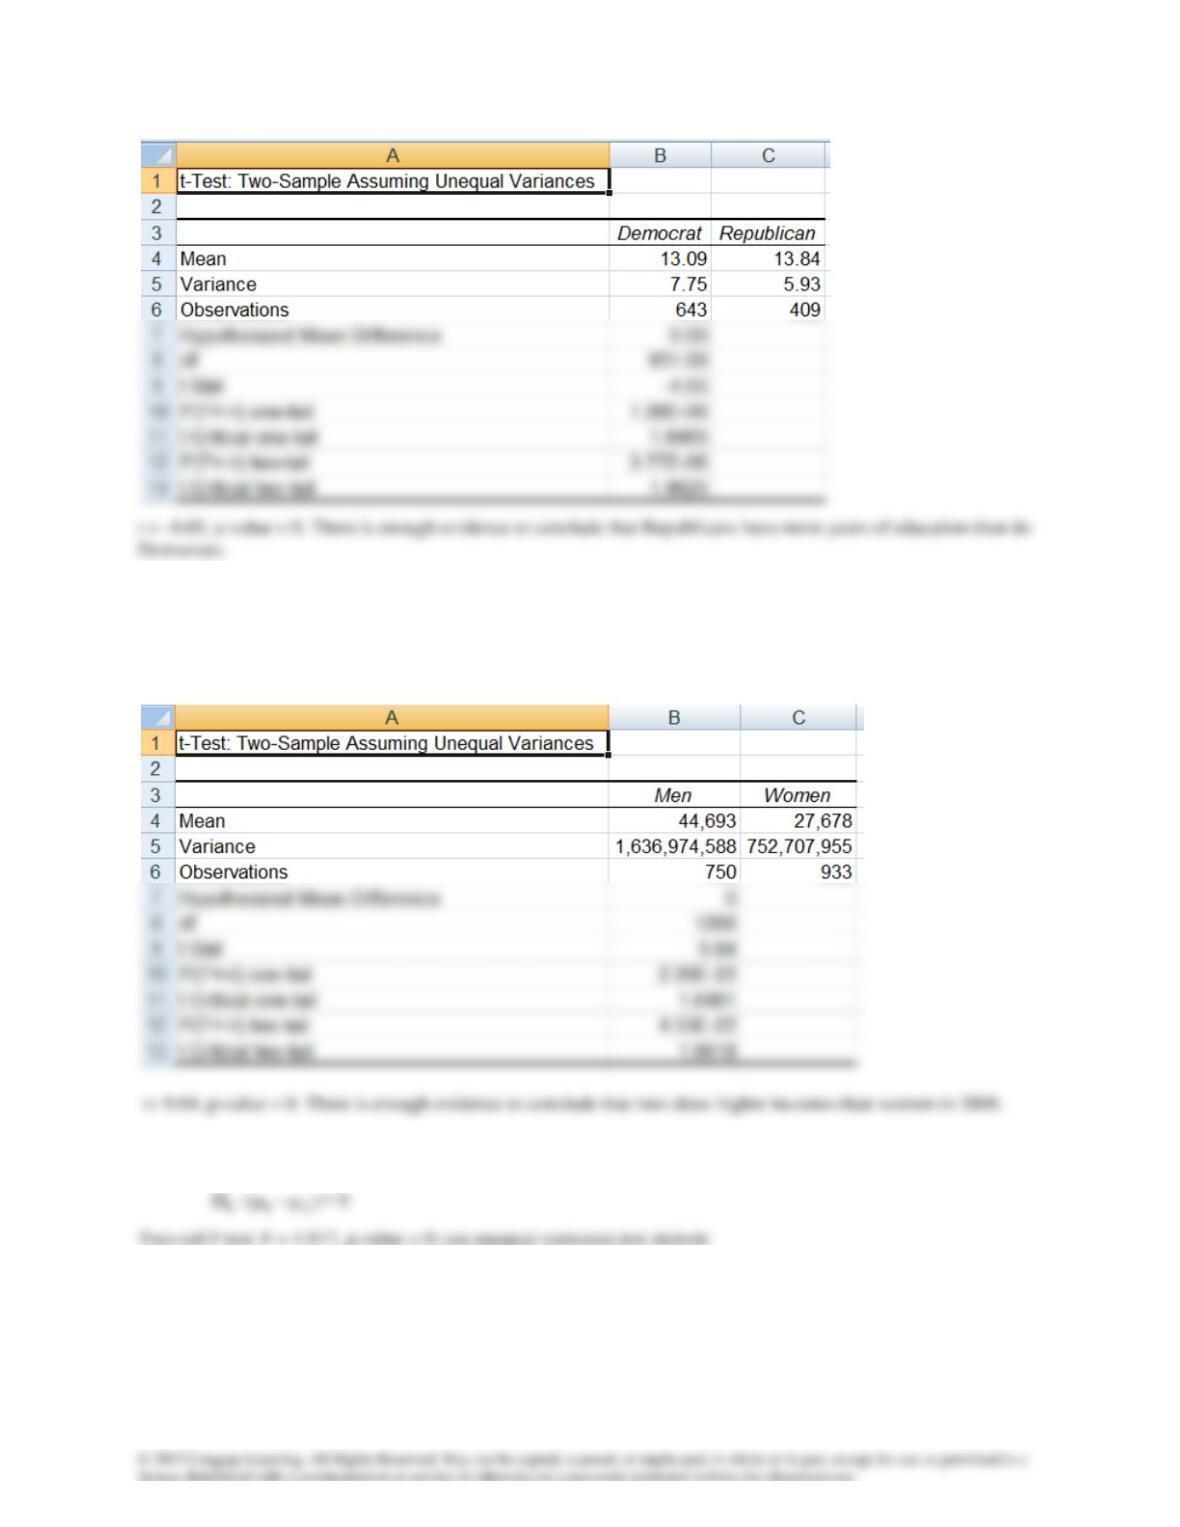
13.85 Two-tail F test: F =1.17, p-value = .1016; use equal-variances test statistic
13.86
)(:H 210 −
= 0
)(:H 211 −
< 0
13.87
)(:H 210 −
= 0
)(:H 211 −
> 0
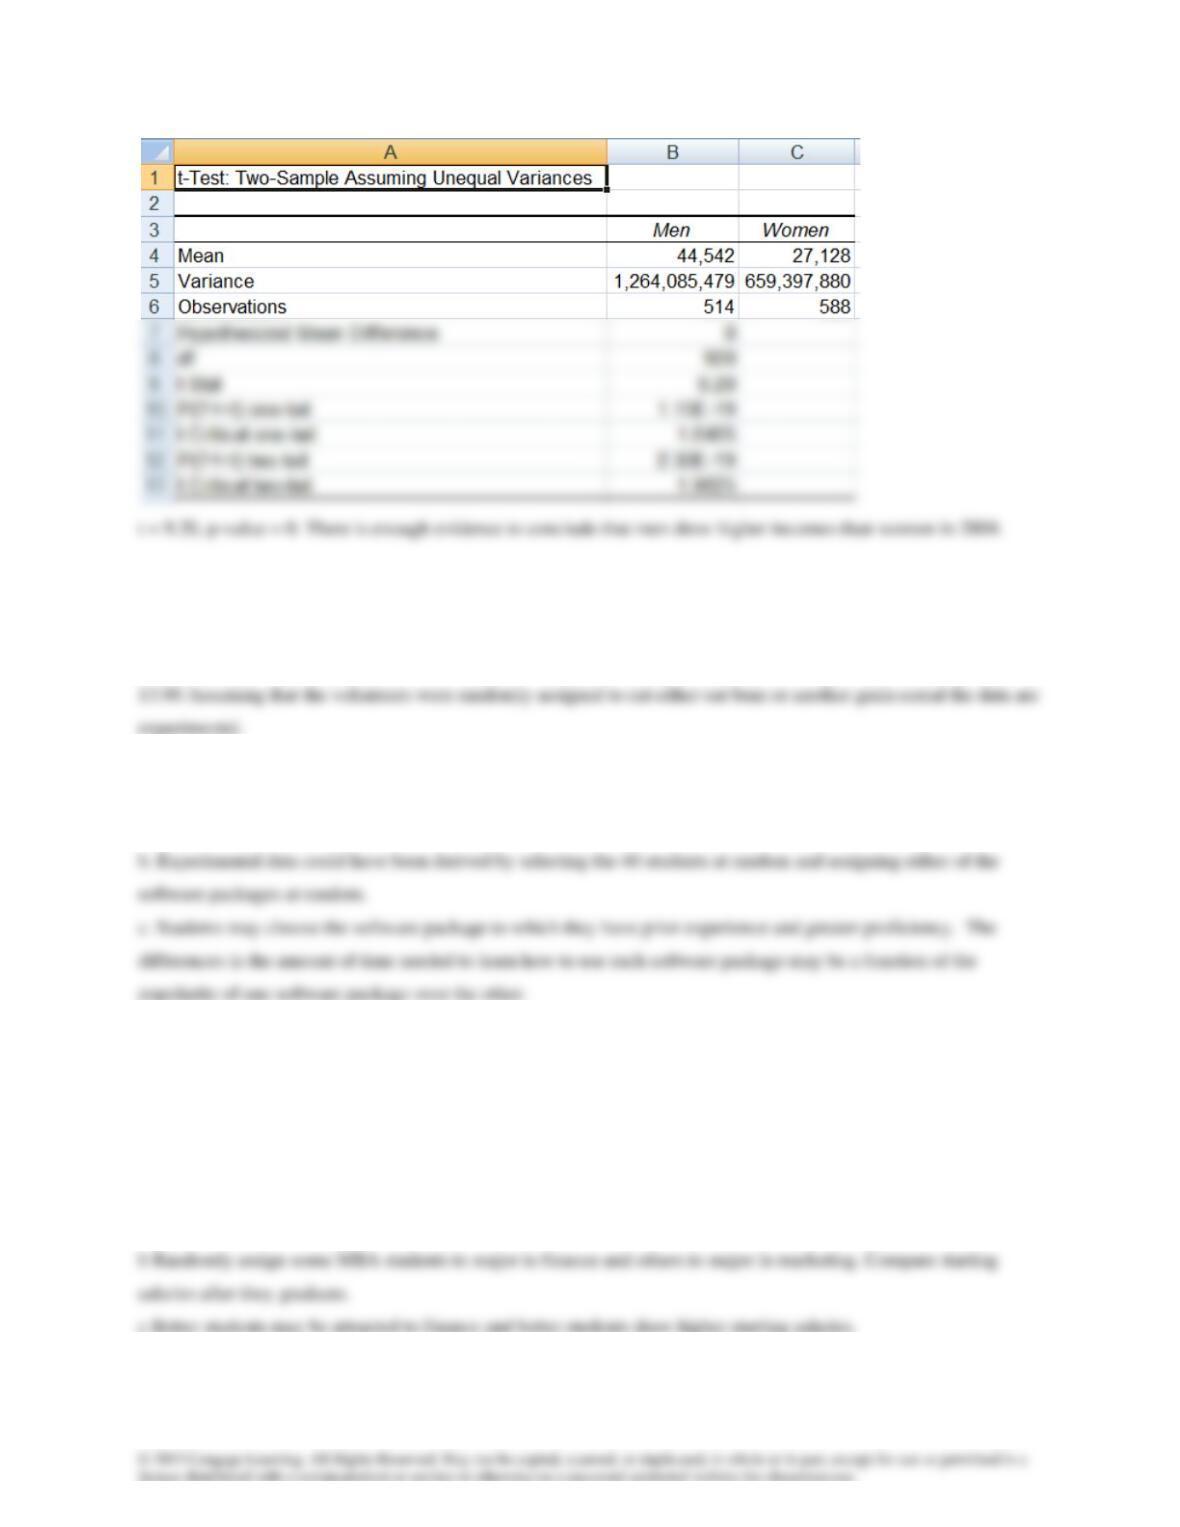
Two-tail F test: F = 2.175, p-value = 0; use unequal-variances test statistic
13.88
)(:H 210 −
= 0
)(:H 211 −
13.89 The data are observational. Experimental data could be produced by randomly assigning babies to either
Tastee or the competitor’s product.
13.91a. Since 40 students were selected randomly, but were given the choice as to which software package to use,
the data must be observational.
13.92a Let students select the section they wish to attend and compare test results.
b Randomly assign students to either section and compare test results.
13.93 Randomly assign patients with the disease to receive either the new drug or a placebo.
13.94a Randomly select finance and marketing MBA graduates and determine their starting salaries.
13.95a The data are observational because to obtain experimental data would entail randomly assigning some people
to smoke and others not to smoke.
13.96
D0 :H
= 0
D1 :H
< 0
13.97
D0 :H
= 0
D1 :H
< 0
13.98
D0 :H
= 0
D1 :H
> 0
13.99a
D0 :H
= 0
D1 :H
0
13.100 a
D0 :H
= 0
D1 :H
0
Rejection region:
796.1ttt 11,05., ==
13.101
D0 :H
= 0
D1 :H
0
13.102
D0 :H
= 0
D1 :H
0
13.103 a
D
D
2/D n
s
tx
=
16.875.19
40
63.30
684.175.19 =
; LCL = 11.59, UCL = 27.91
b
D0 :H
= 0