CHAPTER 21: STATISTICAL PROCESS CONTROL
TRUE/FALSE
1. Chance variation in general cannot be eliminated without changing the process.
2. Chance variation was built into the produce when the production process was first set up.
3. Assignable variation is caused by specific events or factors that are frequently temporary.
4. A malfunctioning valve in a filling machine can create assignable variation.
5. A new machine can cause a change in the mean of a process distribution. This is a result of a level
shift.
6. If a machine part is slowly losing its ability to work, causing the standard deviation of the process to
increase, this is an example of assignable variation called a trend.
7. A predictable change in operators for the day shift and night shift can create assignable variation called
a cycle.
8. In statistical process control, a Type I error occurs if we conclude that the process is in control when it
actually isn’t.
9. In statistical process control, a Type II error occurs if we conclude that the process is in control when it
actually isn’t.
10. If the average run length of a process is 385, that means the sample size should be 385 for each sample
collected.
11. If the average run length of a process is 385, then the control chart will wrongly conclude that the
process is out of control once every 385 samples on average.
12. The centerline of an control chart is the mean of the samples being collected.
MULTIPLE CHOICE
1. Which of the following is an example of assignable variation in a process?
a.
The valve on the machine that fills paint cans has malfunctioned.
b.
The operator of the paint filling machine experiences fatigue during his shift.
c.
A temperature or humidity change has occurred in the factory.
d.
All of these choices are true.
2. Variations in a process that are caused by specific events or factors that are frequently temporary and
can usually be identified and eliminated are known as:
a.
chance variation.
c.
assignable variation.
b.
common variation.
d.
All of these choices are true.
3. Variations in a process that are caused by a number of randomly occurring events that cannot be
eliminated without changing the process are known as:
a.
assignable variation.
c.
special variation.
b.
common variation.
d.
None of these choices.
4. Which of the following is an example of chance variation in a process?
a.
Two randomly selected boxes of cereal that don’t weigh exactly 16 ounces (the labeled
weight).
b.
Two randomly selected boxes of cereal that don’t weigh exactly the same.
c.
Normal fluctuations in the process that randomly occur.
d.
None of these choices.
5. When the control chart shows a slow and steady shift (up or down) in the process distribution mean,
the result is referred to as:
a.
a level shift.
c.
a trend.
b.
a cycle.
d.
instability.
6. Which of the following process results indicate that a statistical process is out of control?
a.
A repeated series of small observations followed by large observations.
b.
An increase in the standard deviation.
c.
A slow and steady shift (up or down) in the process distribution mean.
d.
All of these choices are true.
7. When the control chart shows a repeated series of small observations followed by large
observations, the result is referred to as:
a.
a cycle.
c.
a level shift.
b.
a trend.
d.
instability.
8. How do we know when a process is in control?
a.
The control chart shows sample means that are randomly distributed between the
control limits.
b.
Each observation sampled is drawn from an identical distribution.
c.
The control chart shows no patterns or cycles in the plotted sample means.
d.
All of these choices are true.
9. When the control chart shows a change in the mean of the process distribution, the result is referred
to as:
a.
a trend.
c.
a level shift.
b.
a cycle.
d.
instability.
10. The lower and upper control limits of an control chart are usually set at:
a.
one standard error from the centerline.
b.
two standard errors from the centerline.
c.
three standard errors from the centerline.
d.
None of these choices.
11. What do you look for to determine when a process is in a state of statistical control?
a.
A control chart with a series of consecutive points that are above the center line and a
series of consecutive points that are below the center line.
b.
A control chart in which no points fall outside either the upper control limit or the lower
control limit and no patterns are present.
c.
A control chart in which all the points are exactly the same.
d.
All of these choices are true.
12. When no point lies outside the control limits of a chart, we conclude that variation in the process is:
a.
caused by chance and there is not enough evidence to infer that the process is out of
control.
b.
caused by chance and there is enough evidence to infer that the process is out of control.
c.
caused by assignable causes and there is enough evidence to infer that the process is under
control.
d.
caused by assignable causes and there is not enough evidence to infer that the process is
out of control.
13. In designing a control chart, the statistician must select a sample size and a sampling frequency. These
decisions are based on which factors:
a.
Cost of making Type I and Type II errors.
b.
Length of the production run.
c.
Typical change in the process distribution when the process goes out of control.
d.
All of these choices are true.
14. Which of the following is NOT something you can do with an operating characteristic curve?
a.
Decide what sample size to use in designing a control chart.
b.
Decide how many samples to select in designing a control chart.
c.
Find the probability of making a Type I error.
d.
Find the probability of making a Type II error.
15. Which of the following elements affects the chance of making a Type II error?
a.
The sample size.
c.
The chance of making a Type I error.
b.
The mean of the process.
d.
All of these choices are true.
16. If the control limits of an chart are set at 2 standard errors from the centerline instead of the
commonly used 3 standard errors, this will result in
a.
an increased chance for a Type I error and a decreased chance for a Type II error.
b.
an increased chance for a Type I error and an increased chance for a Type II error.
c.
a decreased chance for a Type I error and an increased chance for a Type II error.
d.
a decreased chance for a Type I error and a decreased chance for a Type II error.
17. When the control chart shows an increase in the standard deviation of the process, the result is
referred to as:
a.
a trend.
c.
a level shift.
b.
a cycle.
d.
instability.
18. An chart for a normally distributed random variable has control limits set at 3 standard errors from
the centerline. One sample mean falls outside the control limits when the process is actually under
control. The probability that this happened by chance is:
a.
.997
c.
.050
b.
.500
d.
.003
COMPLETION
1. ____________________ variation is caused by a number of randomly occurring events that are part of
the production process.
ANS:
2. ____________________ variation is caused by specific events or factors that are frequently
temporary.
3. A level shift is a change in the ____________________ of the process distribution.
4. ____________________ is the term used when the standard deviation of a process distribution
increases.
5. A trend indicates there is a slow and steady shift in the ____________________ of a process
distribution.
6. The key to quality is to detect when the process goes out of control. The ____________________
chart is the statistical method that we use to detect problems.
7. A hypothesis test is used to determine whether there is sufficient evidence to infer that the process
mean has changed. This means H0 is: the process is ____________________ control.
8. The ____________________ is the expected number of samples that must be taken on average, before
the control chart indicates that the process has gone out of control.
9. The average run length indicates how often a false alarm is expected to occur. That is, the average run
length is one divided by the probability of a Type ____________________ error.
10. Suppose previously your company decided that a process is out of control when the mean shifts by
about 1 standard deviation. Now your company wants to declare a process as being out of control
when the mean shifts by .50 standard deviations. In order to do this, the samples must be collected
____________________ often and/or the sample sizes must be ____________________.
11. If you change the control limits from 3 standard errors from the centerline to 2 standard deviations
from the centerline, this ____________________ the probability of a Type I error and
____________________ the probability of a Type II error.
12. You stopped a production process because you felt the process was out of control according to your
control chart. However, it turns out the process was in control, costing you $20,000 in downtime of the
equipment and laborers. This is an example of a costly Type____________ error.
SHORT ANSWER
1. Assume that the control limits of an chart are defined as 3 standard errors above and below the
centerline. Calculate the probability that a sample mean falls outside the control limits when the
process is in fact under control.
2. Assume that the control limits of an chart are defined as 2.5 standard errors above and below the
centerline. Calculate the probability that a sample mean falls outside the control limits when the
process is in fact under control.
3. Assume that the control limits of an chart are defined as 2 standard errors above and below the
centerline. Calculate the probability that a sample mean falls outside the control limits when the
process is in fact under control.
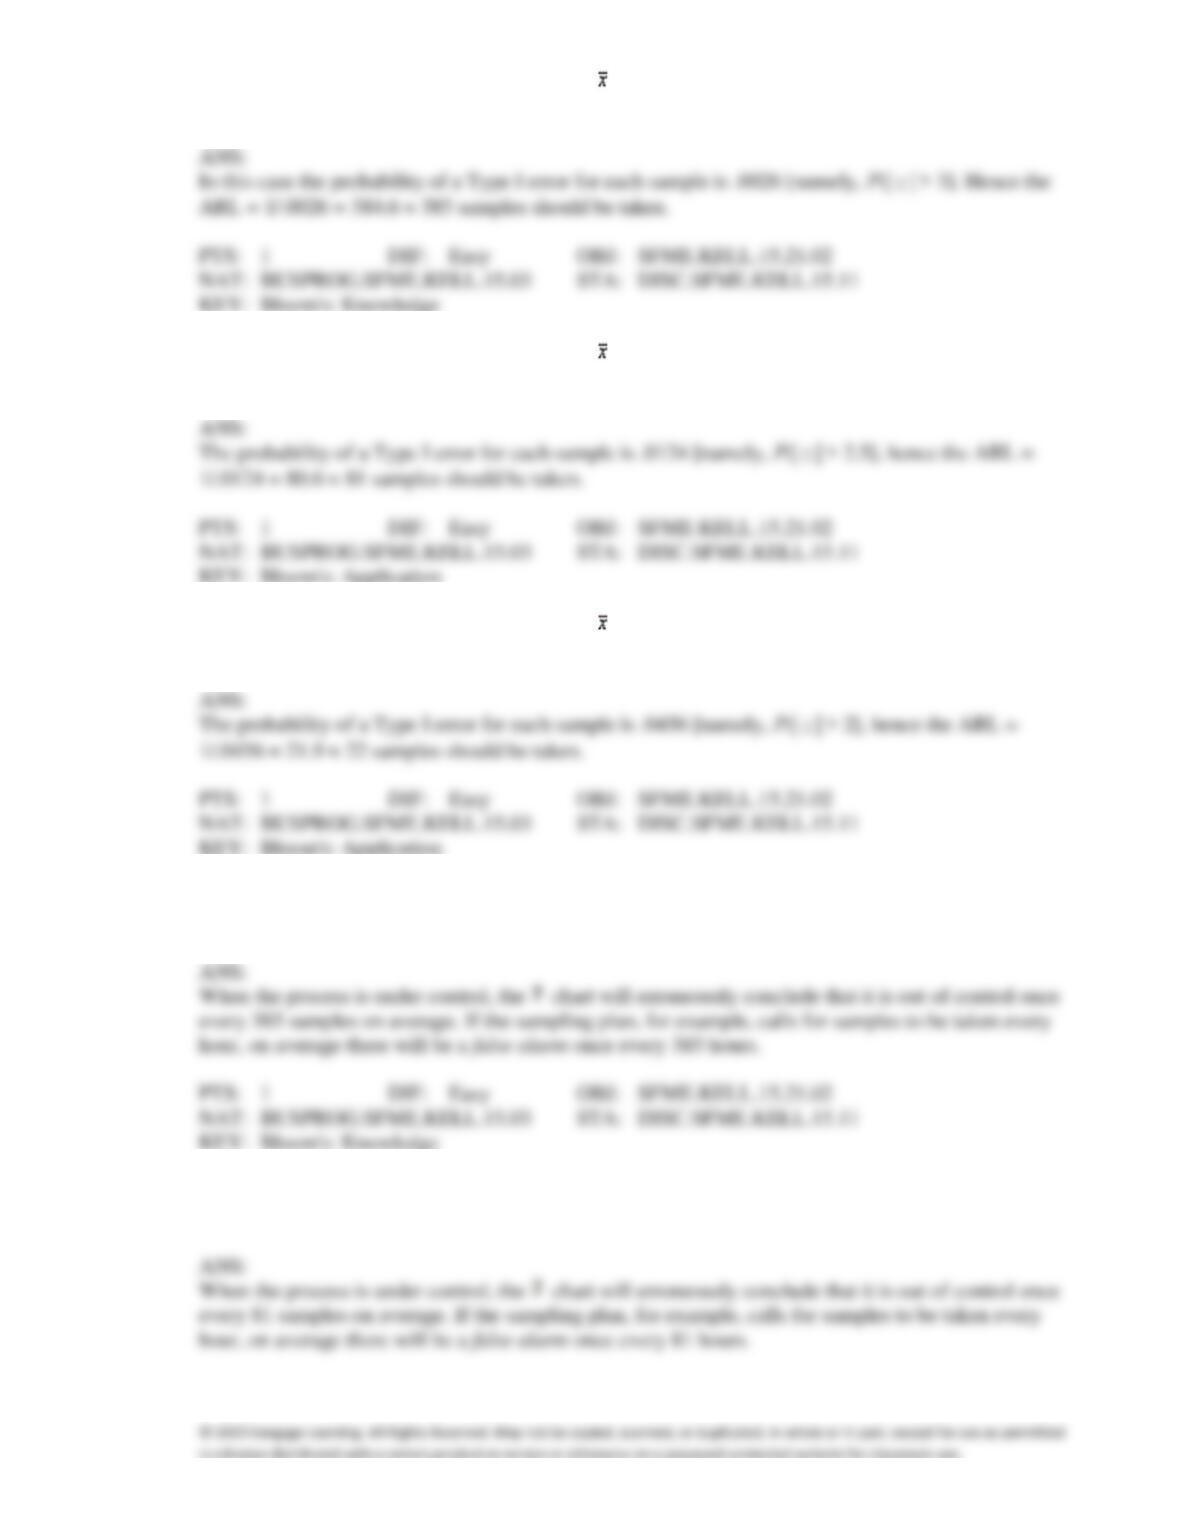
4. What is the average run length (ARL) until an control chart signals a false alarm if the control limits
are set at 3 standard errors from the centerline?
5. What is the average run length (ARL) until an control chart signals a false alarm if the control limits
are set at 2.5 standard errors from the centerline?
6. What is the average run length (ARL) until an control chart signals a false alarm if the control limits
are set at 2 standard errors from the centerline?
7. Assume a process has limits set at 3 standard errors from the centerline. The average run length
(ARL) is 385. What does this mean?
8. Assume a process has limits set at 2.5 standard errors from the centerline. The average run length
(ARL) is 81. What does this mean?
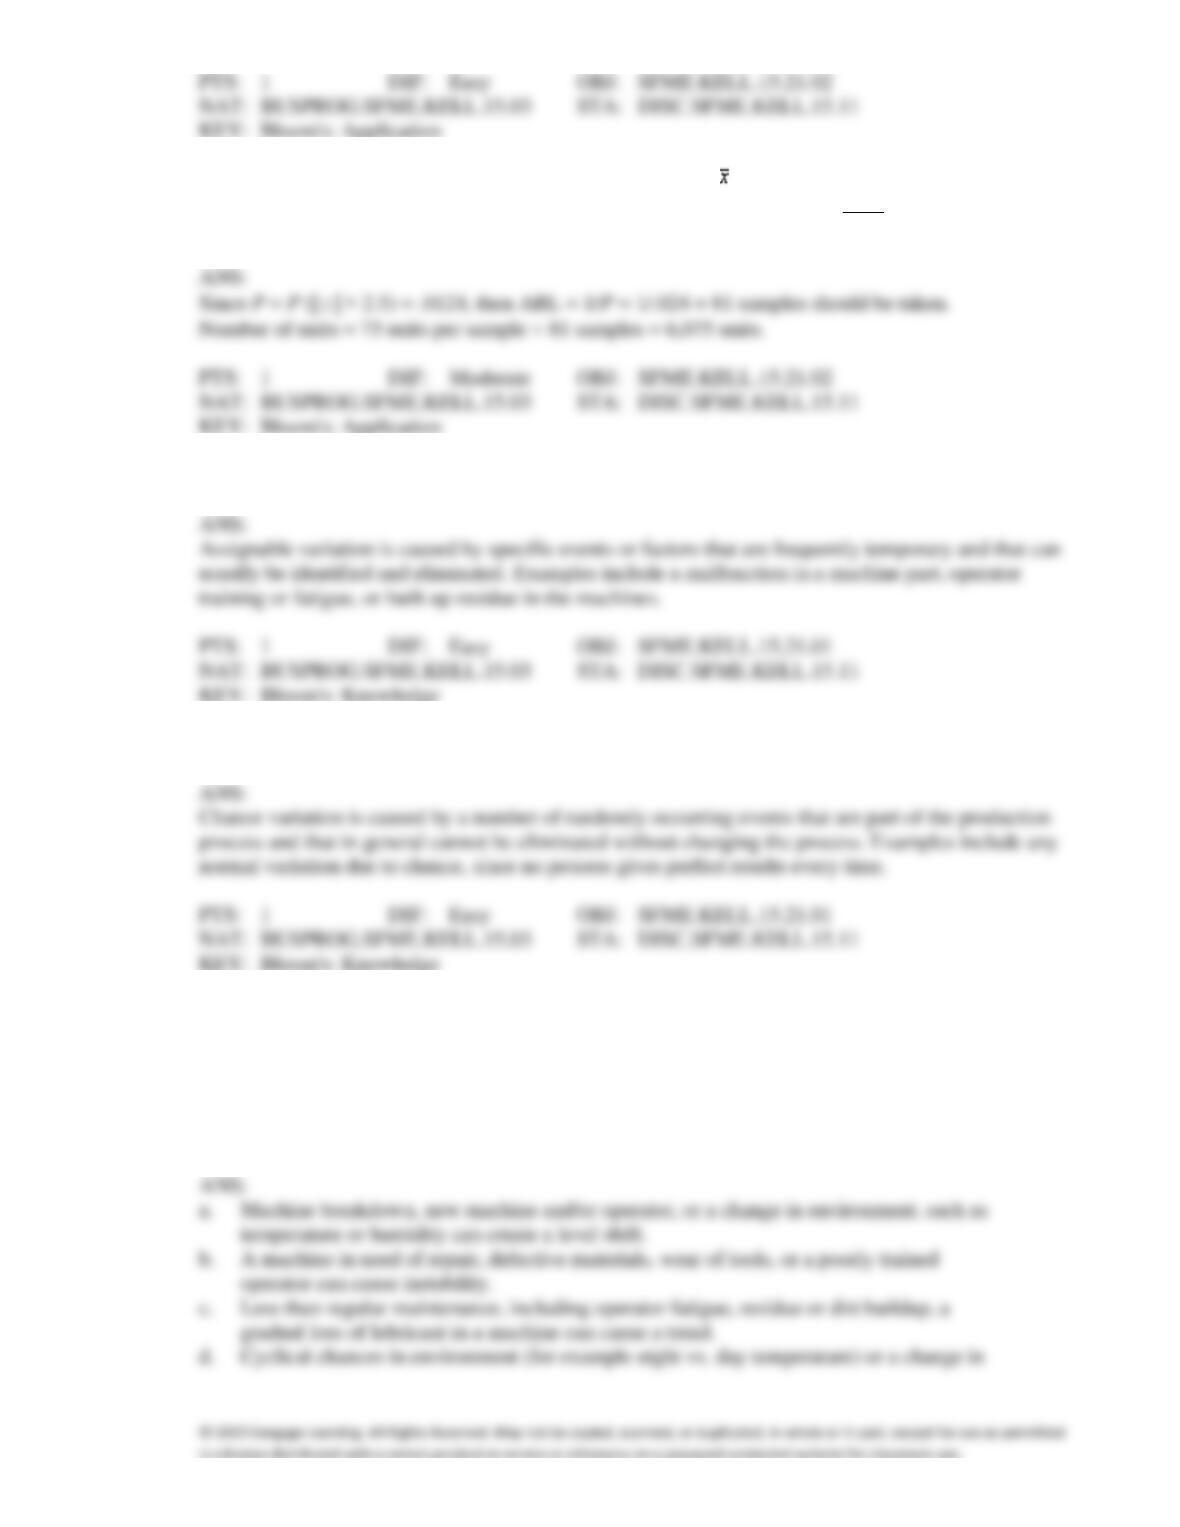
9. A production facility produces 75 units per hour and uses an chart to monitor its quality. The control
limits are seat at 2.5 standard errors from the mean. On average, how many units will be produced
until the control chart signals that the process is out of control, when it is in fact under control?
10. Discuss what we mean by assignable variation in a process and give an example.
11. Discuss what we mean by chance variation in a process and give an example.
12. Suppose you are producing a product implementing statistical process control.
a.
Give an example of assignable variation that would create a level shift.
b.
Give an example of assignable variation that would create instability.
c.
Give an example of assignable variation that would create a trend.
d.
Give an example of assignable variation that would create a cycle.
temperature or humidity can create a level shift.
operator can cause instability.
d.
Cyclical chances in environment (for example night vs. day temperature) or a change in
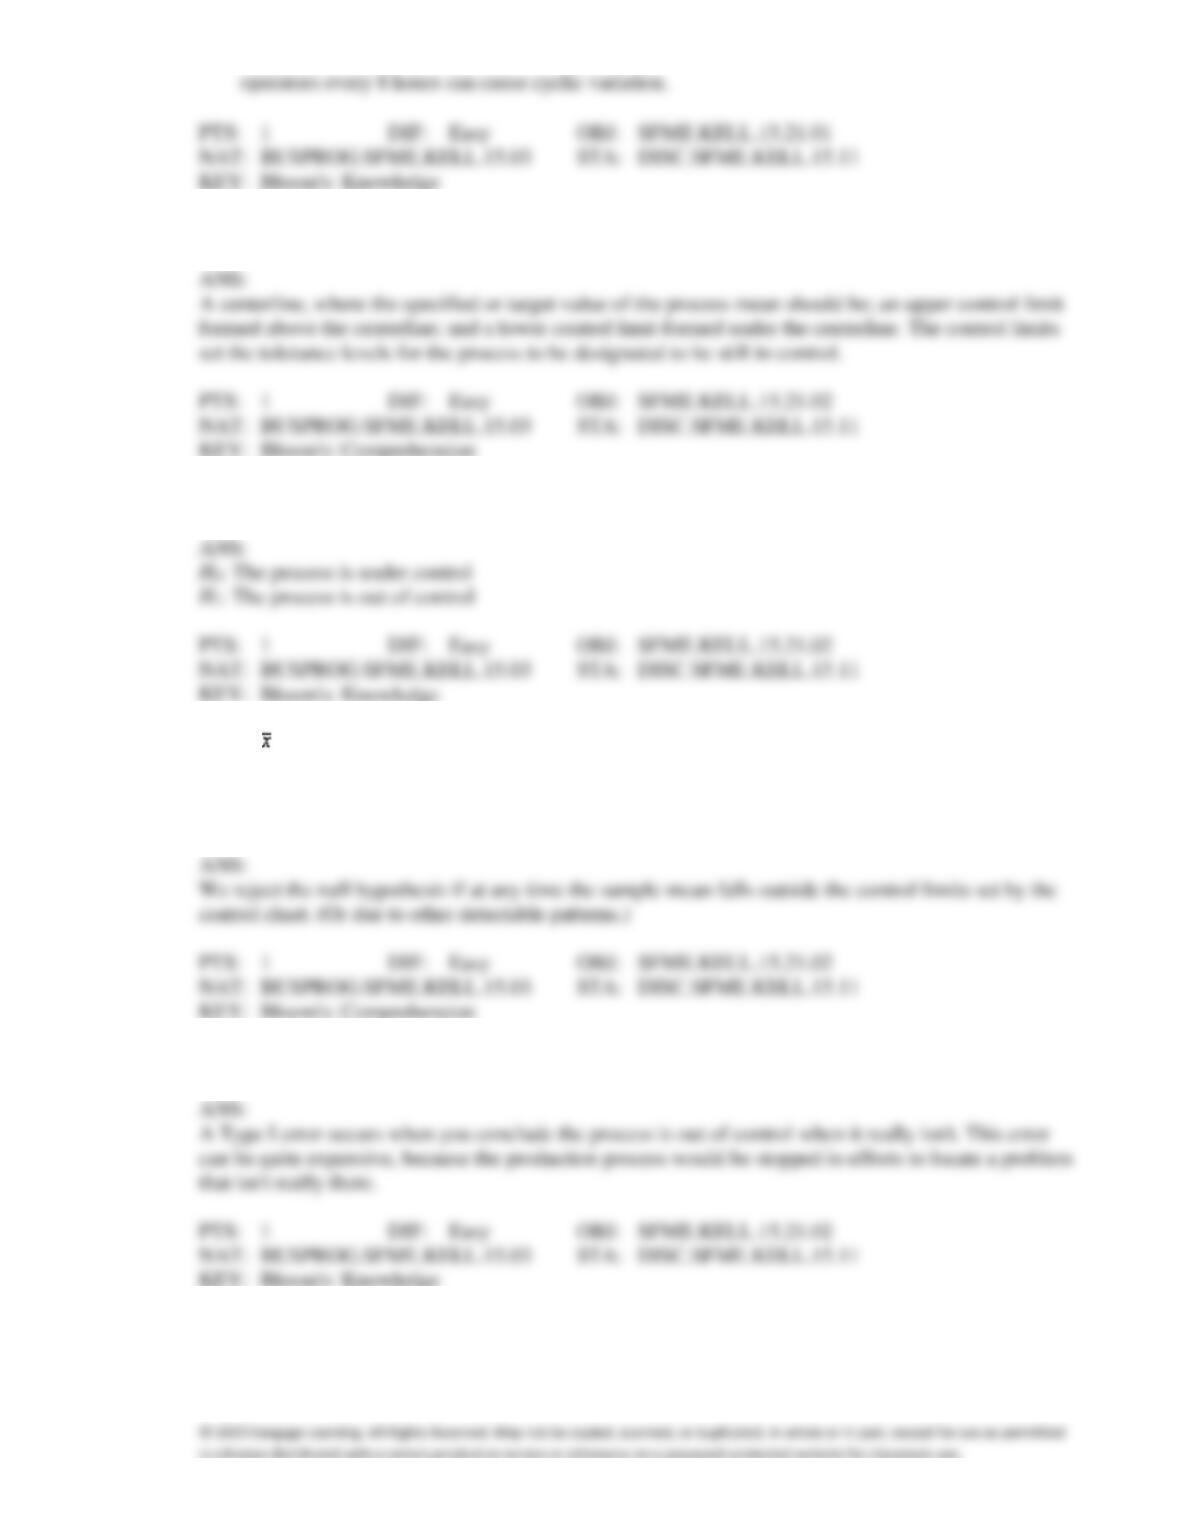
13. Describe the three essential parts of a control chart.
14. What are the null and alternative hypotheses used to determine whether or not a process is in control?
15. For an control chart, you test a series of sample means. For each series of samples, we want to
determine whether there is sufficient evidence to infer that the process mean has changed (i.e. reject
H0: the process is under control). Under what situation would you reject the null hypothesis based on
the control chart?
16. Describe what a Type I error is, and what its impact is, in terms of a production process.
17. Describe what a Type II error is, and what its impact is, in terms of a production process.
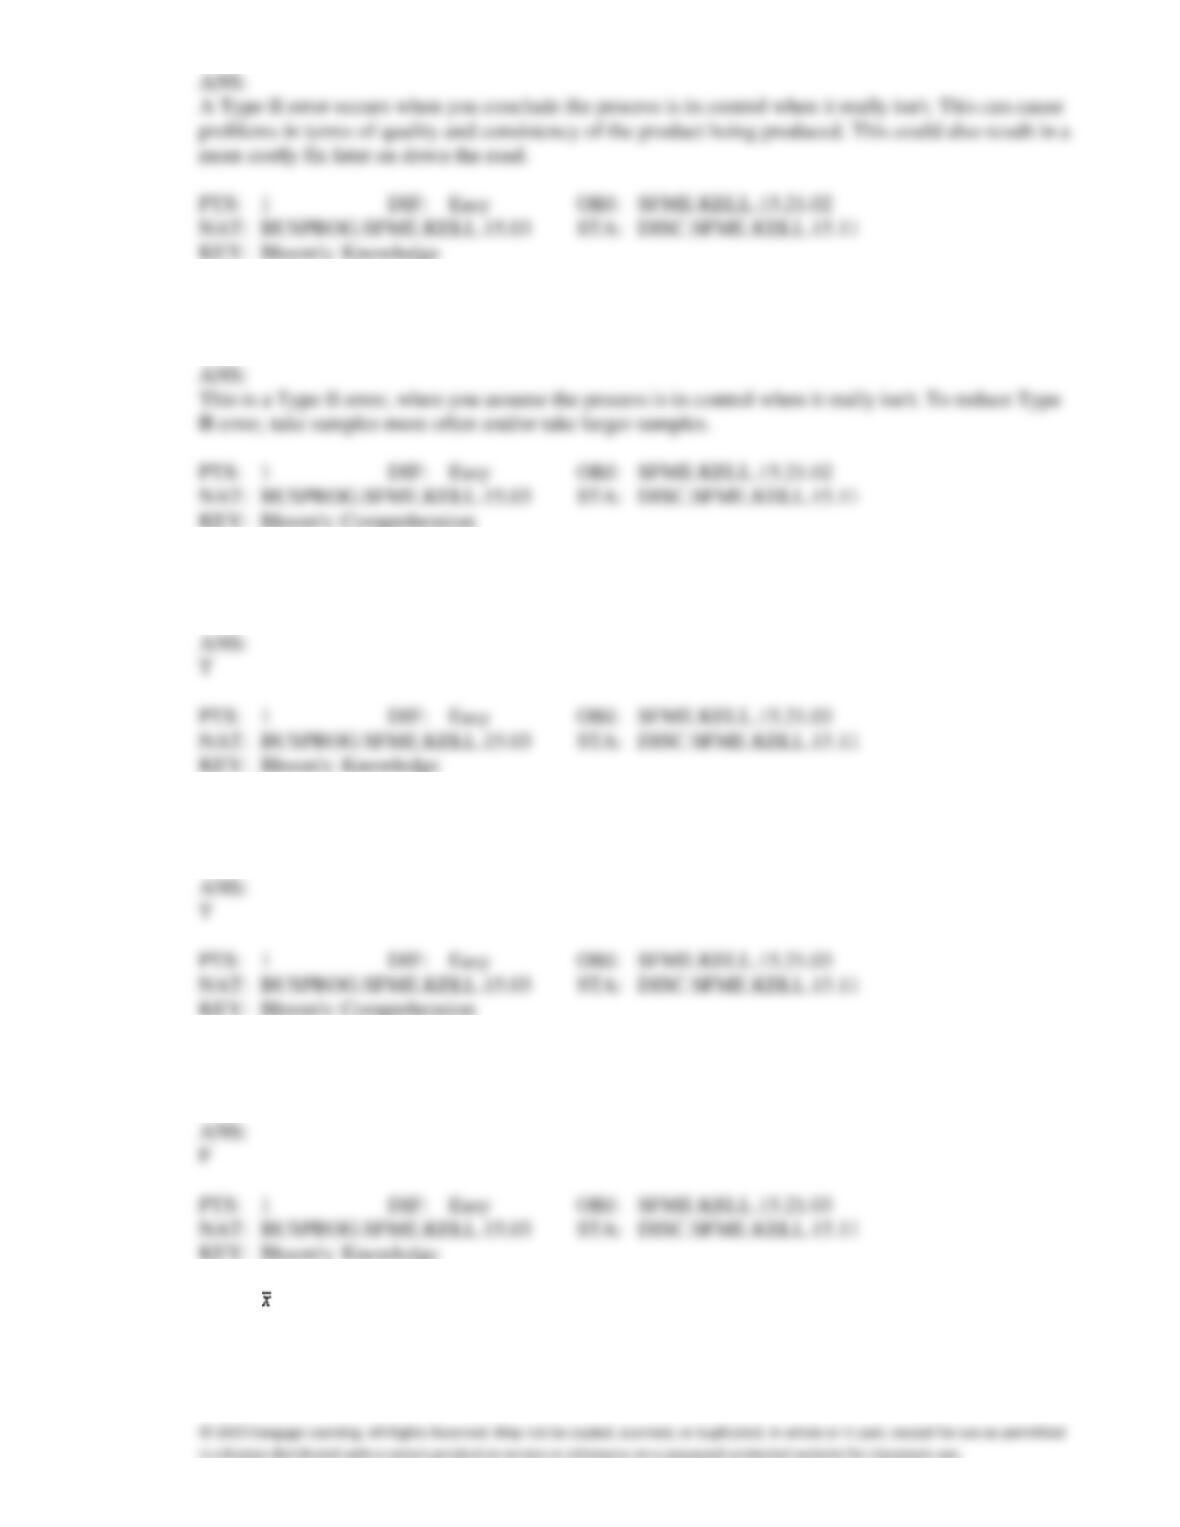
18. A malfunction in the process goes unnoticed and later causes great expense in terms of operator and
machine downtime. What type of error was caused here and how could it be decreased?
19. The process capability index measures the capability of the process to produce units whose dimensions
fall with in the specifications.
20. Control charts for variables are appropriate whenever we are interested in monitoring measurements,
such as weights, diameters, or temperature.
21. When the purpose of sampling is to detect when a process becomes too variable, the control chart of
choice will be an S chart.
22. For an chart, the lower and upper control limits are usually set at three standard errors from the
centerline.
ANS:
23. A process capability index (Cp) of 2.0 describes a production process where the specification limits are
equal to 3 standard errors above and below the centerline.
24. A coffee machine fills cups with an average of 6 ounces with a standard deviation of .25 ounces. A
sample of 9 cups is taken. The lower and upper control limits for a 3-sigma control chart are 5.75
and 6.25, respectively.
25. The process capability index is defined as Cp = (USL − LSL) / 6, where USL and LSL are the upper
and lower specification limits.
26. The process capability index measures the capability of the process to produce units whose dimensions
fall outside the specification limits.
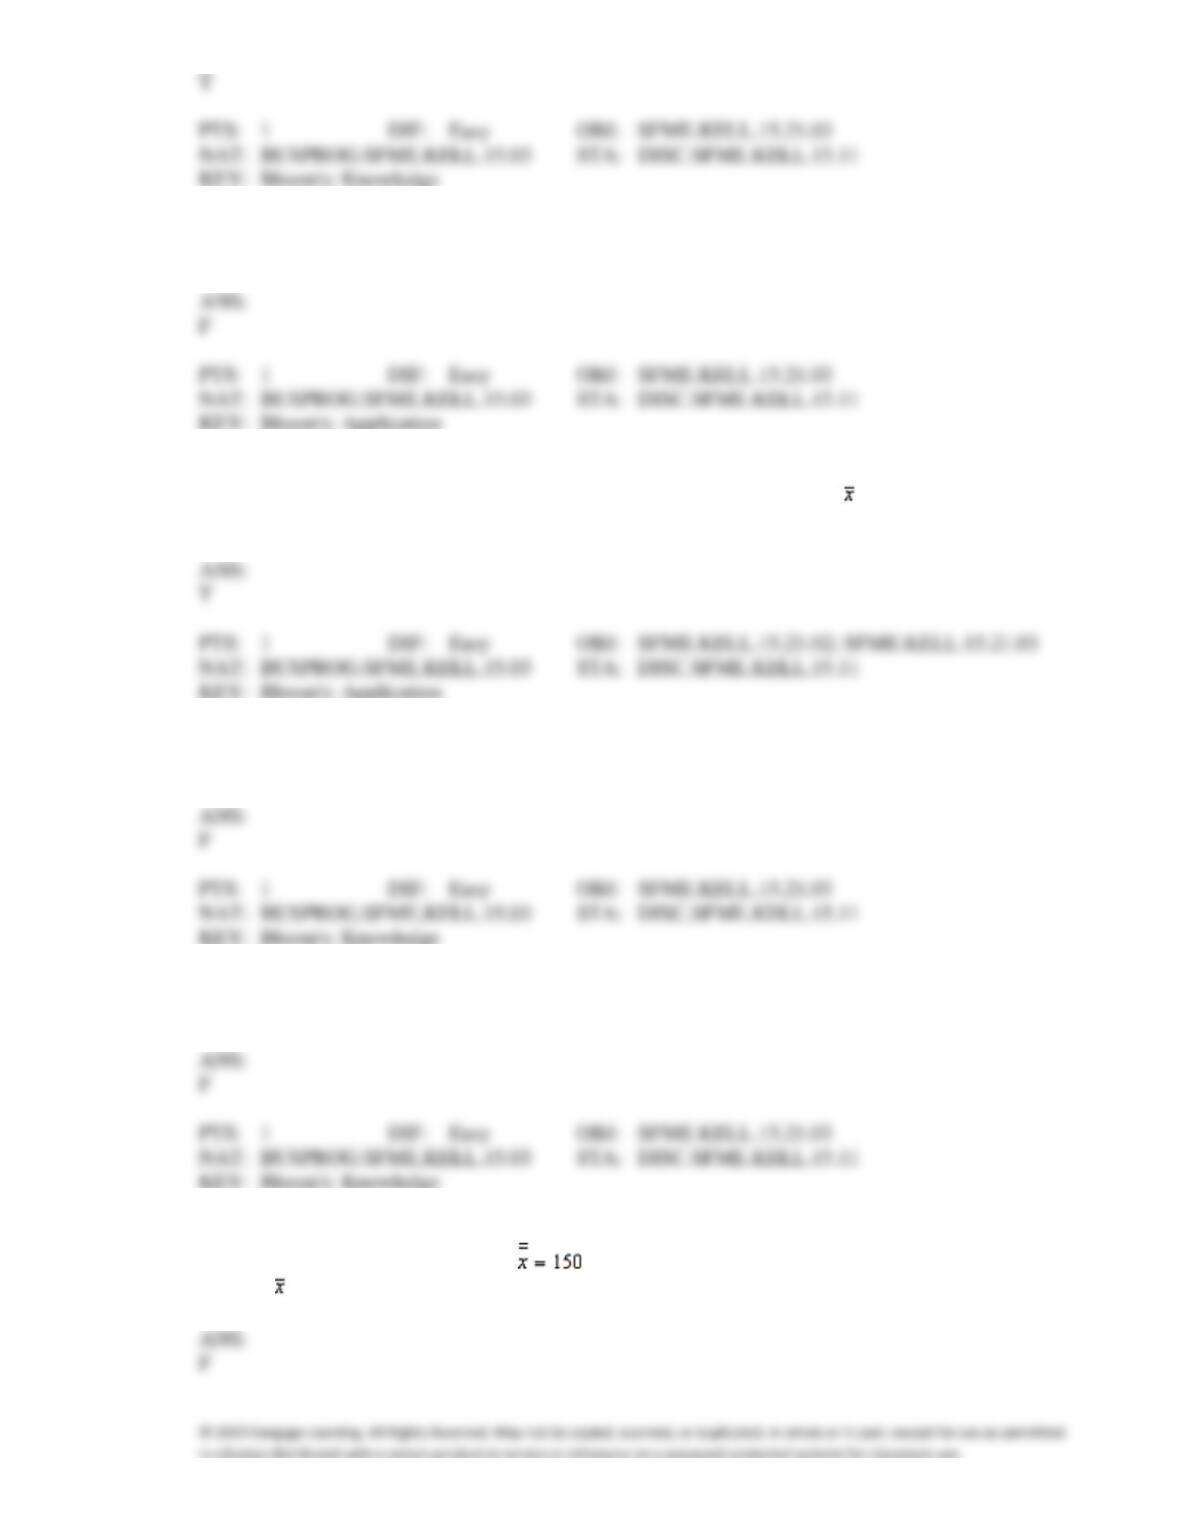
27. The mean of the sample means and the pooled standard deviation of 36 samples of size 9 taken from a
production process under control are , and S = 6, respectively. The lower control limit of the
3-sigma chart is 147.
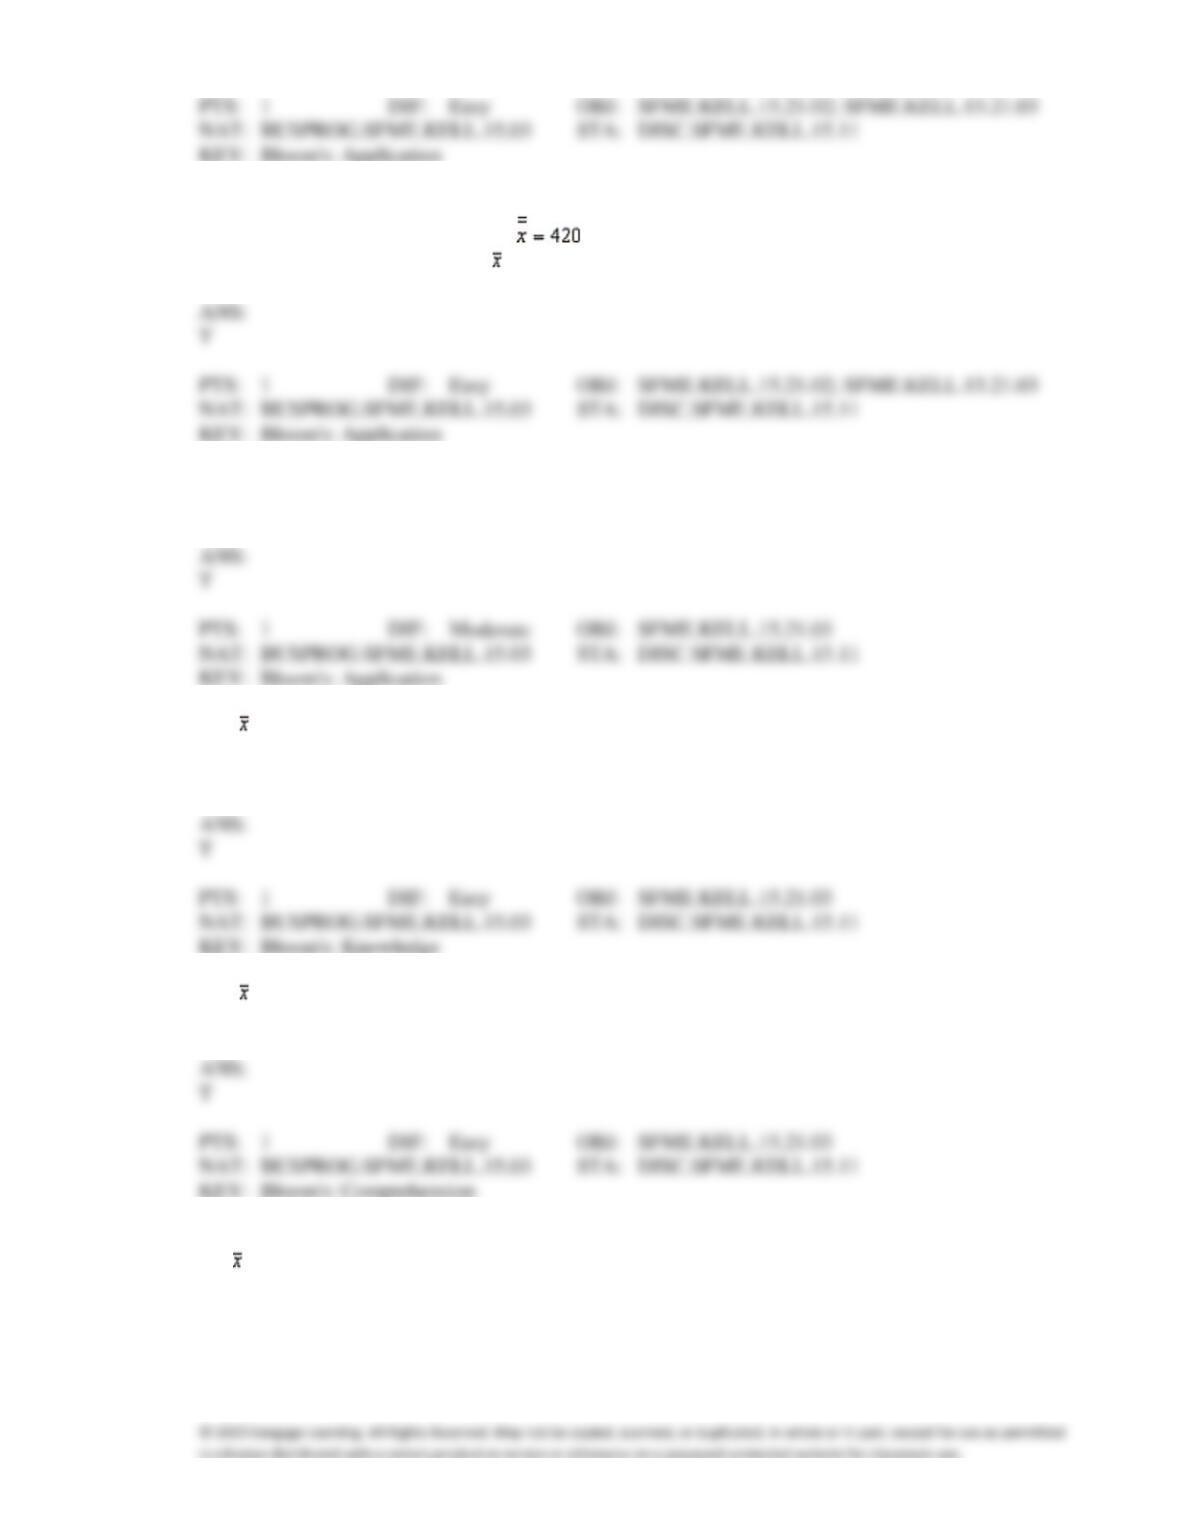
28. The mean of the sample means and the pooled standard deviation of 40 samples of size 9 taken from a
production process under control are , and S = 12, respectively. The lower control limit and the
upper control limit of the 3-sigma chart are 408 and 432, respectively.
29. A process capability index Cp of 1.0 describes a production where the difference in the specification
limits is equal to 6 standard errors.
30. The chart is employed to determine whether the process distribution means have changed. To
determine whether the process distribution standard deviation has changed, we use the S (which stands
for standard deviation) chart.
31. The chart helps with questions about whether the process is producing the correct or acceptable
mean.
32. To determine whether the process distribution standard deviation has changed, we use a(n):
a.
chart.
b.
S chart.
c.
p chart.
d.
All of these choices are true.
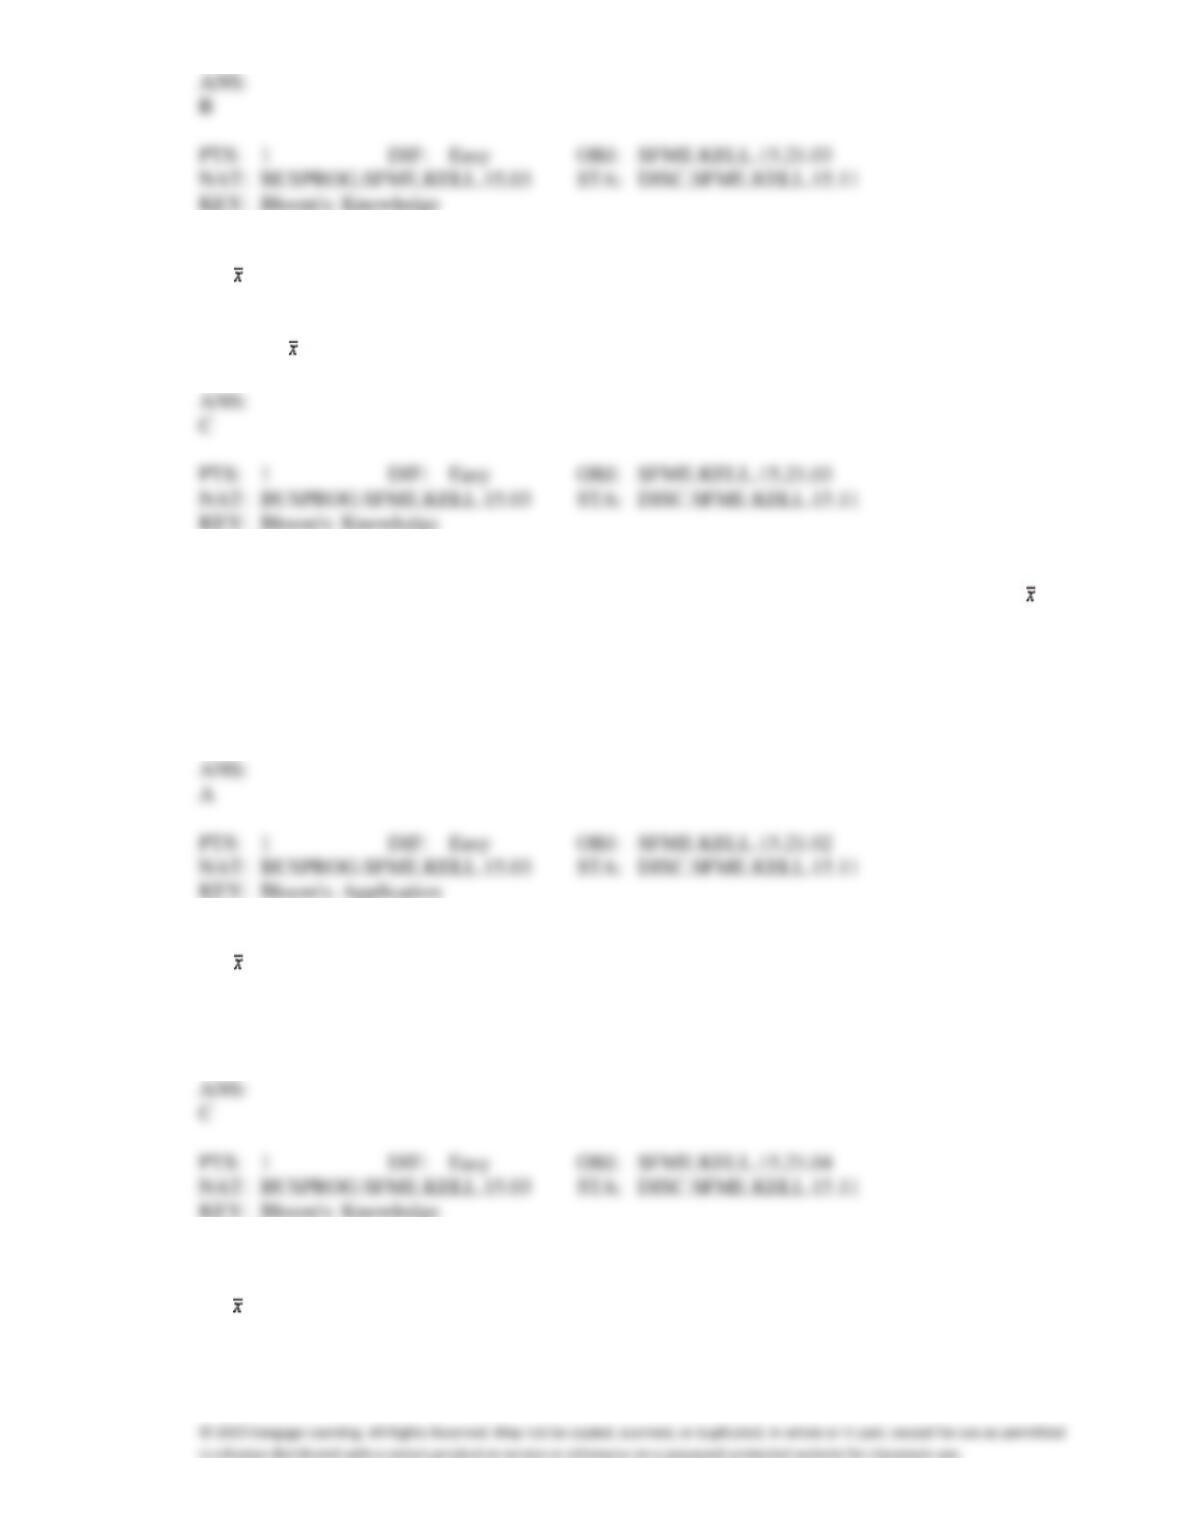
33. Control charts used to determine if the process distribution standard deviation has changed are:
a.
and p charts.
b.
p and R charts.
c.
R and S charts.
d.
S and charts.
34. The mean of the sample means and the pooled standard deviation of 25 samples of size 4 taken from a
production process under control are found to be 150 and 10, respectively. The centerline for the
chart is:
a.
150
b.
100
c.
250
d.
6
35. To determine whether the proportion of defectives is in line with specifications, we use a(n):
a.
chart.
b.
S chart.
c.
p chart.
d.
All of these choices are true.
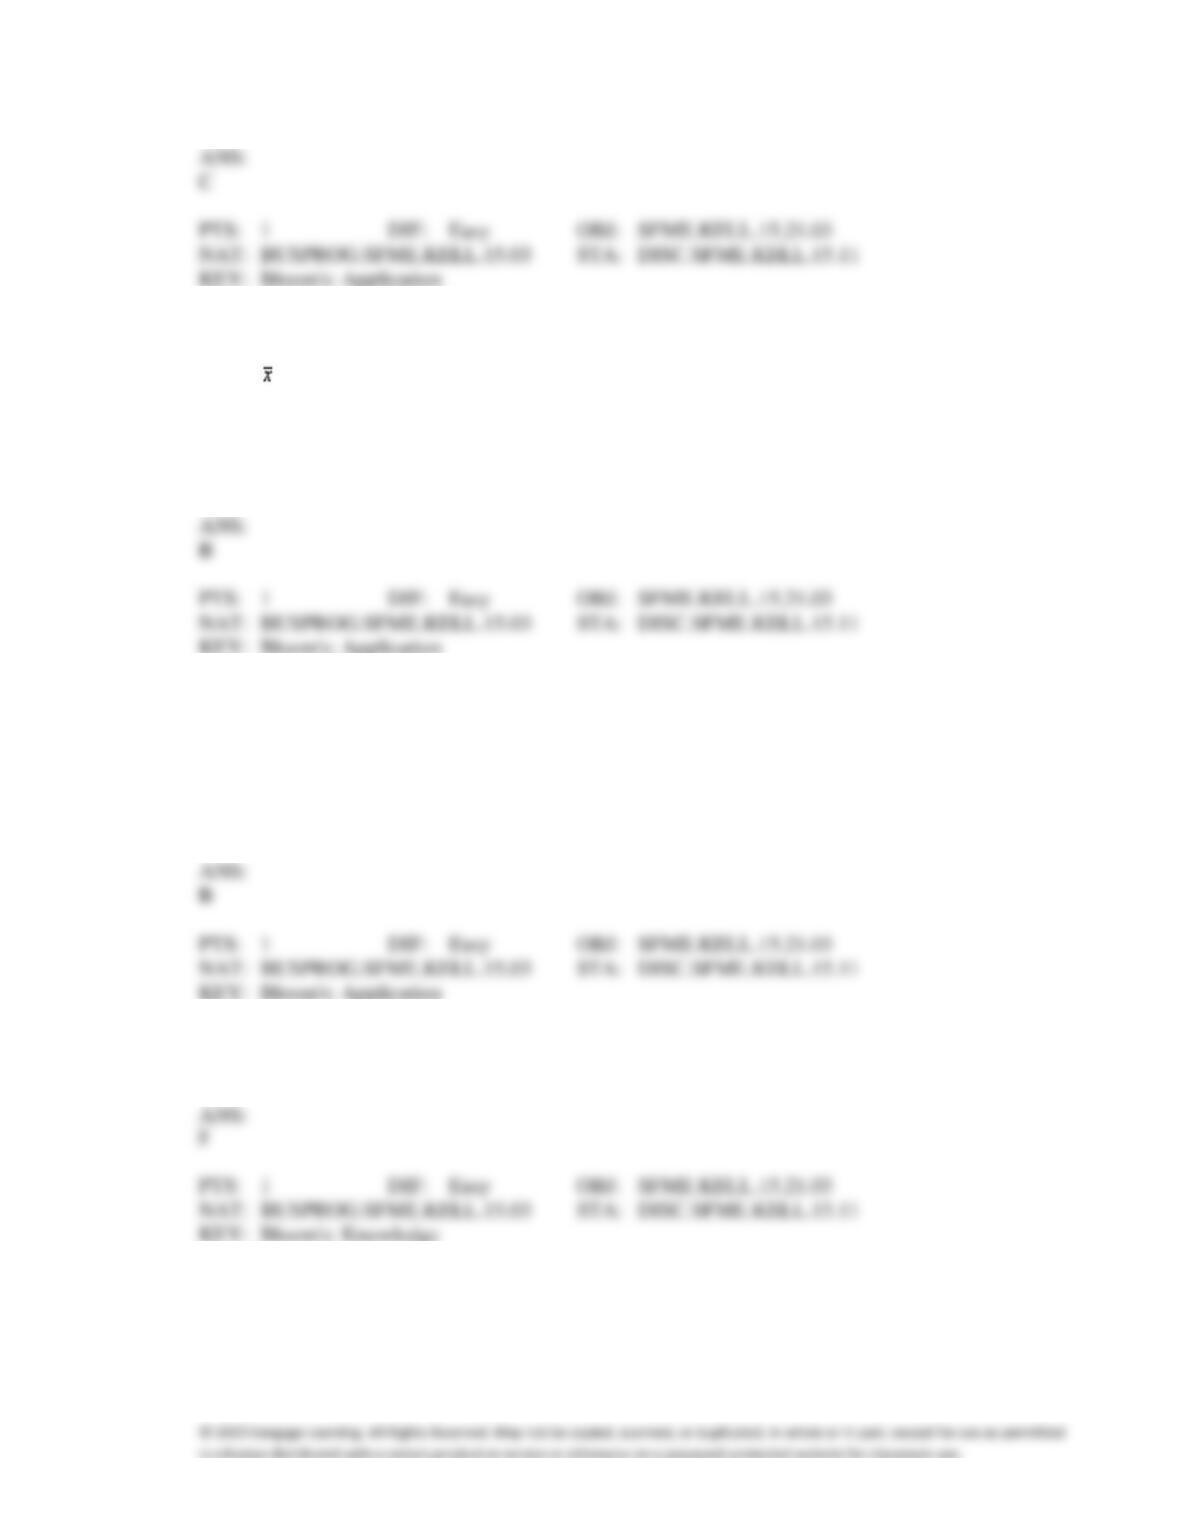
36. The mean of the sample means and the pooled standard deviation of 40 samples of size 5 taken from a
production process under control are found to be 400 and 15, respectively. The lower control limit for
the chart is:
a.
460.37
b.
392.88
c.
379.88
d.
None of these choices.
37. The mean of the sample means and the pooled standard deviation of 50 samples of size 10 taken from
a production process under control are found to be 225 and 16, respectively. The upper control limit
for the chart is:
a.
231.79
b.
240.18
c.
218.21
d.
209.82
38. If the upper and lower specification limits of a process are .852 and .828, respectively, and the process
standard deviation is .002, then the process capability index Cp is
a.
.024
b.
2.000
c.
−2.000
d.
12.000
39. To determine whether the distribution mean of a process has changed, we use a(n)
____________________ chart.
40. To determine whether the process distribution standard deviation has changed, we use a(n)
____________________ chart or a(n) ____________________ chart.
ANS: