119. The coefficient of ____________________ measures the amount of variation in the dependent
variable that is explained by the variation in the independent variable.
Truck Speed and Gas Mileage
An economist wanted to analyze the relationship between the speed of a truck (x) and its gas mileage
(y). As an experiment a truck is operated at several different speeds and for each speed the gas mileage
is measured. These data are shown below.
Speed
25
35
45
50
60
65
70
Gas Mileage
40
39
37
33
30
27
25
120. {Truck Speed and Gas Mileage Narrative} Calculate the standard error of estimate, and describe what
this statistic tells you about the regression line.
121. {Truck Speed and Gas Mileage Narrative} Does this data provide sufficient evidence at the 5%
significance level to infer that a linear relationship exists between speed and gas mileage?
122. {Truck Speed and Gas Mileage Narrative} Predict with 99% confidence the gas mileage of a car
traveling 55 mph.
123. {Truck Speed and Gas Mileage Narrative} Calculate the Pearson coefficient of correlation.
124. {Truck Speed and Gas Mileage Narrative} What does the coefficient of correlation tell you about the
direction and strength of the relationship between the two variables?
125. {Truck Speed and Gas Mileage Narrative} Calculate the coefficient of determination and interpret its
value.
126. The following 10 observations of variables x and y were collected.
x
1
2
3
4
5
6
7
8
9
10
y
25
22
21
19
14
15
12
10
6
2
a.
Calculate the standard error of estimate.
b.
Test to determine if there is enough evidence at the 5% significance level to indicate that x
and y are negatively linearly related.
c.
Calculate the coefficient of correlation, and describe what this statistic tells you about the
regression line.
Rejection region: t < t0.05,8 = −1.86
Test statistic: t = −16.40
variables.
127. Consider the following data values of variables x and y.
x
2
4
6
8
10
13
y
7
11
17
21
27
36
a.
Calculate the coefficient of determination, and describe what this statistic tells you about
the relationship between the two variables.
b.
Calculate the Pearson coefficient of correlation. What sign does it have? Why?
c.
What does the coefficient of correlation calculated tell you about the direction and
strength of the relationship between the two variables?
a.
explained by the variation in the independent variable x.
b.
U V’s and Skin Cancer
A medical statistician wanted to examine the relationship between the amount of UV’s (x) and
incidence of skin cancer (y). As an experiment he found the number of skin cancers detected per
100,000 of population and the average daily sunshine in eight states around the country. These data are
shown below.
Average Daily UV’s
5
7
6
7
8
6
4
3
Skin Cancer per 100,000
7
11
9
12
15
10
7
5
128. {UV’s and Skin Cancer Narrative} Calculate the standard error of estimate, and describe what this
statistic tells you about the regression line.
129. {UV’s and Skin Cancer Narrative} Can we conclude at the 1% significance level that there is a linear
relationship between sunshine and skin cancer?
130. {UV’s and Skin Cancer Narrative} Calculate the coefficient of determination and interpret it.
131. {UV’s and Skin Cancer Narrative} Calculate the Pearson coefficient. What sign does it have? Why?
132. {UV’s and Skin Cancer Narrative} What does the coefficient of correlation calculated tell you about
the direction and strength of the relationship between the two variables?
133. {Sales and Experience Narrative} Determine the standard error of estimate and describe what this
statistic tells you about the regression line.
134. (Sales and Experience Narrative} Determine the coefficient of determination and discuss what its
value tells you about the two variables.
135. {Sales and Experience Narrative} Calculate the Pearson correlation coefficient. Interpret this result.
136. {Sales and Experience Narrative} Conduct a test of the population coefficient of correlation to
determine at the 5% significance level whether more experience is related to higher sales, as the
manager speculates.
137. {Sales and Experience Narrative} Conduct a test of the population slope to determine at the 5%
significance level whether a positive linear relationship exists between years of experience and sales.
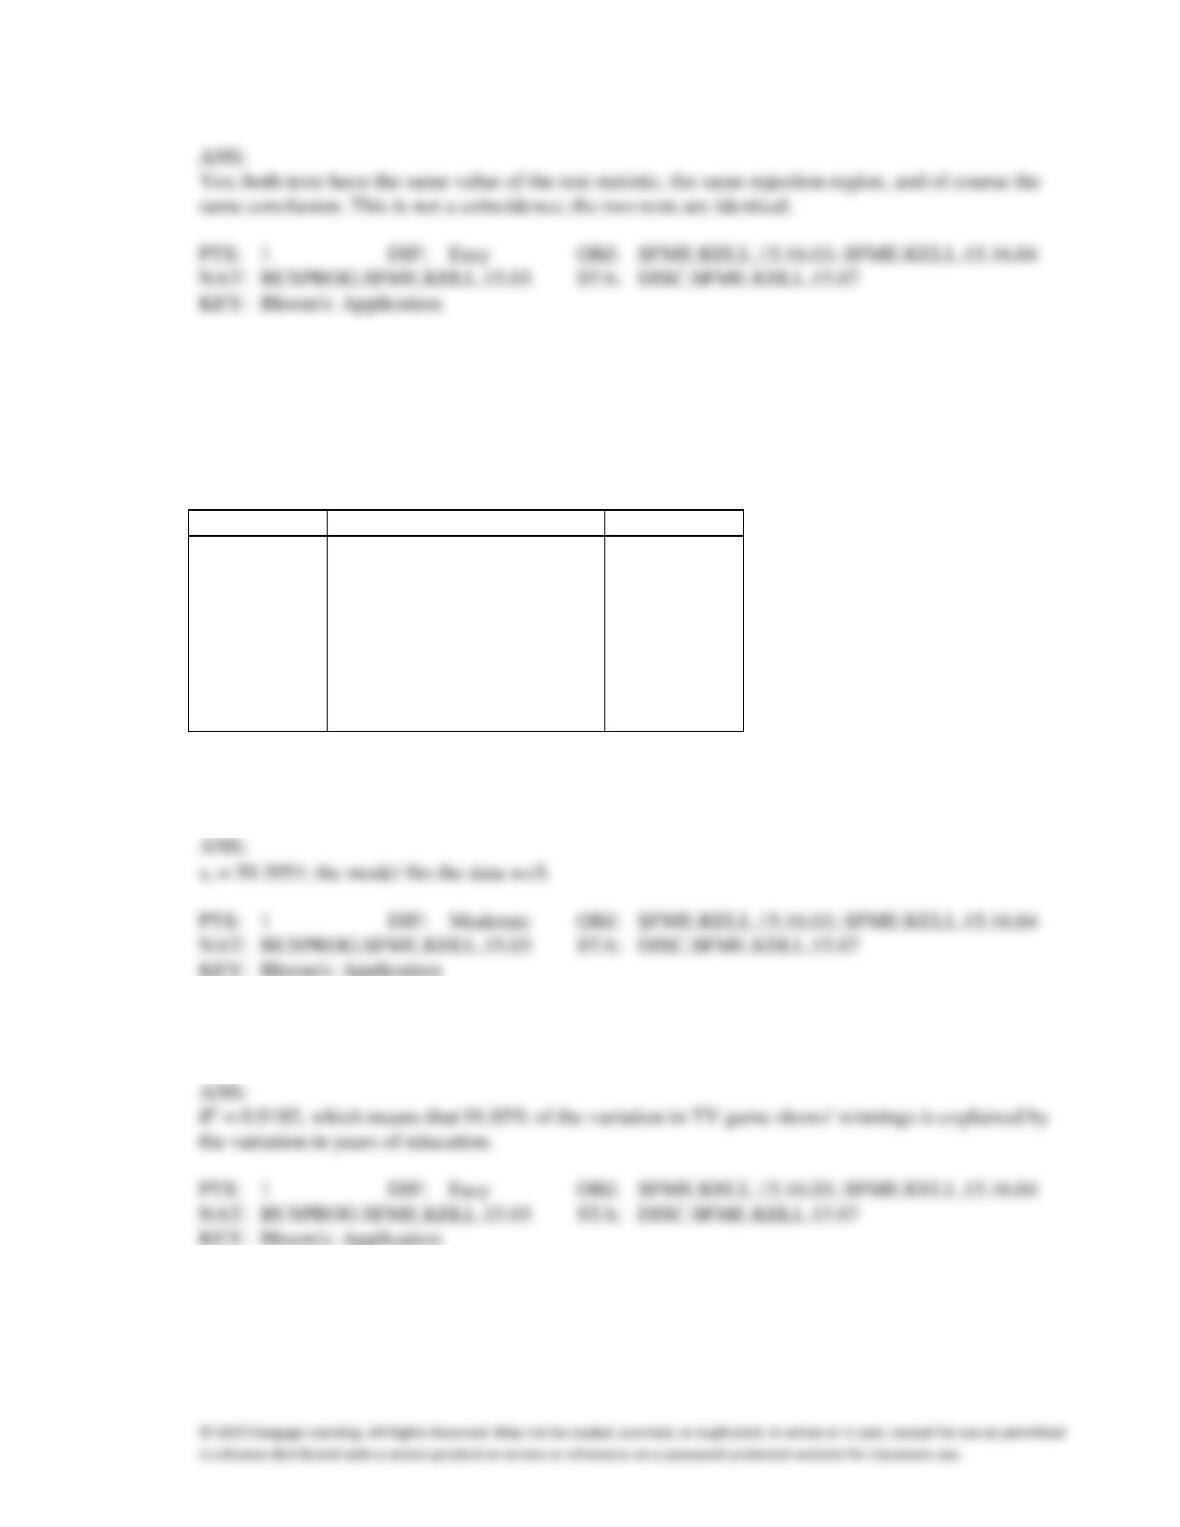
138. {Sales and Experience Narrative} Do the tests of
and
1 in the previous two questions provide the
same results? Explain.
Game Show Winnings & Education
An ardent fan of television game shows has observed that, in general, the more educated the
contestant, the less money he or she wins. To test her belief she gathers data about the last eight
winners of her favorite game show. She records their winnings in dollars and the number of years of
education. The results are as follows.
Contestant
Years of Education
Winnings
1
11
750
2
15
400
3
12
600
4
16
350
5
11
800
6
16
300
7
13
650
8
14
400
139. {Game Show Winnings & Education Narrative} Determine the standard error of estimate and describe
what this statistic tells you about the regression line.
140. {Game Show Winnings & Education Narrative} Determine the coefficient of determination and
discuss what its value tells you about the two variables.
141. {Game Show Winnings & Education Narrative} Calculate the Pearson correlation coefficient. What
sign does it have? Why?
ANS:
142. {Game Show Winnings & Education Narrative} Conduct a test of the population coefficient of
correlation to determine at the 5% significance level whether a negative linear relationship exists
between years of education and TV game shows’ winnings.
143. {Game Show Winnings & Education Narrative} Conduct a test of the population slope to determine at
the 5% significance level whether a negative linear relationship exists between years of education and
TV game shows’ winnings.
144. {Game Show Winnings & Education Narrative} Do the tests
and
1 in the previous two questions
provide the same results? Explain.
Rock Concert Revenues
A financier whose specialty is investing in rock concerts has observed that, in general, concerts with
“big-name” stars seem to generate more revenue than those concerts whose stars are less well known.
To examine his belief he records the gross revenue and the payment (in $ millions) given to the two
highest-paid performers in the concert for ten concert tours.
Concert
Cost of Two Highest Paid
Gross Revenue
Performers ($mil)
($mil)
1
5.3
48
2
7.2
65
3
1.3
18
4
1.8
20
5
3.5
31
6
2.6
26
7
8.0
73
8
2.4
23
9
4.5
39
10
6.7
58
145. {Rock Concert Revenues Narrative} Determine the standard error of estimate and describe what this
statistic tells you about the regression line.
146. {Rock Concert Revenues Narrative} Determine the coefficient of determination and discuss what its
value tells you about the two variables.
147. {Rock Concert Revenues Narrative} Calculate the Pearson correlation coefficient. Interpret the
results.
148. {Rock Concert Revenues Narrative} Conduct a test of the population coefficient of correlation to
determine at the 5% significance level whether a positive linear relationship exists between payment to
the two highest-paid performers and gross revenue.
149. {Rock Concert Revenues Narrative} Conduct a test of the population slope to determine at the 5%
significance level whether a positive linear relationship exists between payment to the two
highest-paid performers and gross revenue.
150. {Rock Concert Revenues Narrative} Do the
and
1 tests in the previous questions provide the same
results? Explain.
Cost of Books
The editor of a major academic book publisher claims that a large part of the cost of books is the cost
of paper. This implies that larger books will cost more money. As an experiment to analyze the claim,
a university student visits the bookstore and records the number of pages and the selling price of
twelve randomly selected books. These data are listed below.
Book
Number of Pages
Selling Price ($)
1
844
55
2
727
50
3
360
35
4
915
60
5
295
30
6
706
50
7
410
40
8
905
53
9
1058
65
10
865
54
151. {Cost of Books Narrative} Determine the coefficient of determination and discuss what its value tells
you.
152. {Cost of Books Narrative} Can we infer at the 5% significance level that the editor is correct?
ANS:
Grateful Dead Concert
At a recent Grateful Dead concert, a survey was conducted that asked a random sample of 20 people
their age and how many concerts they have attended since the first of the year. It is suspected that
older concert goers tend to go to more of his concerts in one year than younger concert goers. The data
and analysis are shown below.
Age
62
57
40
49
67
54
43
65
54
41
Number of Concerts
6
5
4
3
5
5
2
6
3
1
Age
44
48
55
60
59
63
69
40
38
52
Number of Concerts
3
2
4
5
4
5
4
2
1
3
An Excel output follows:
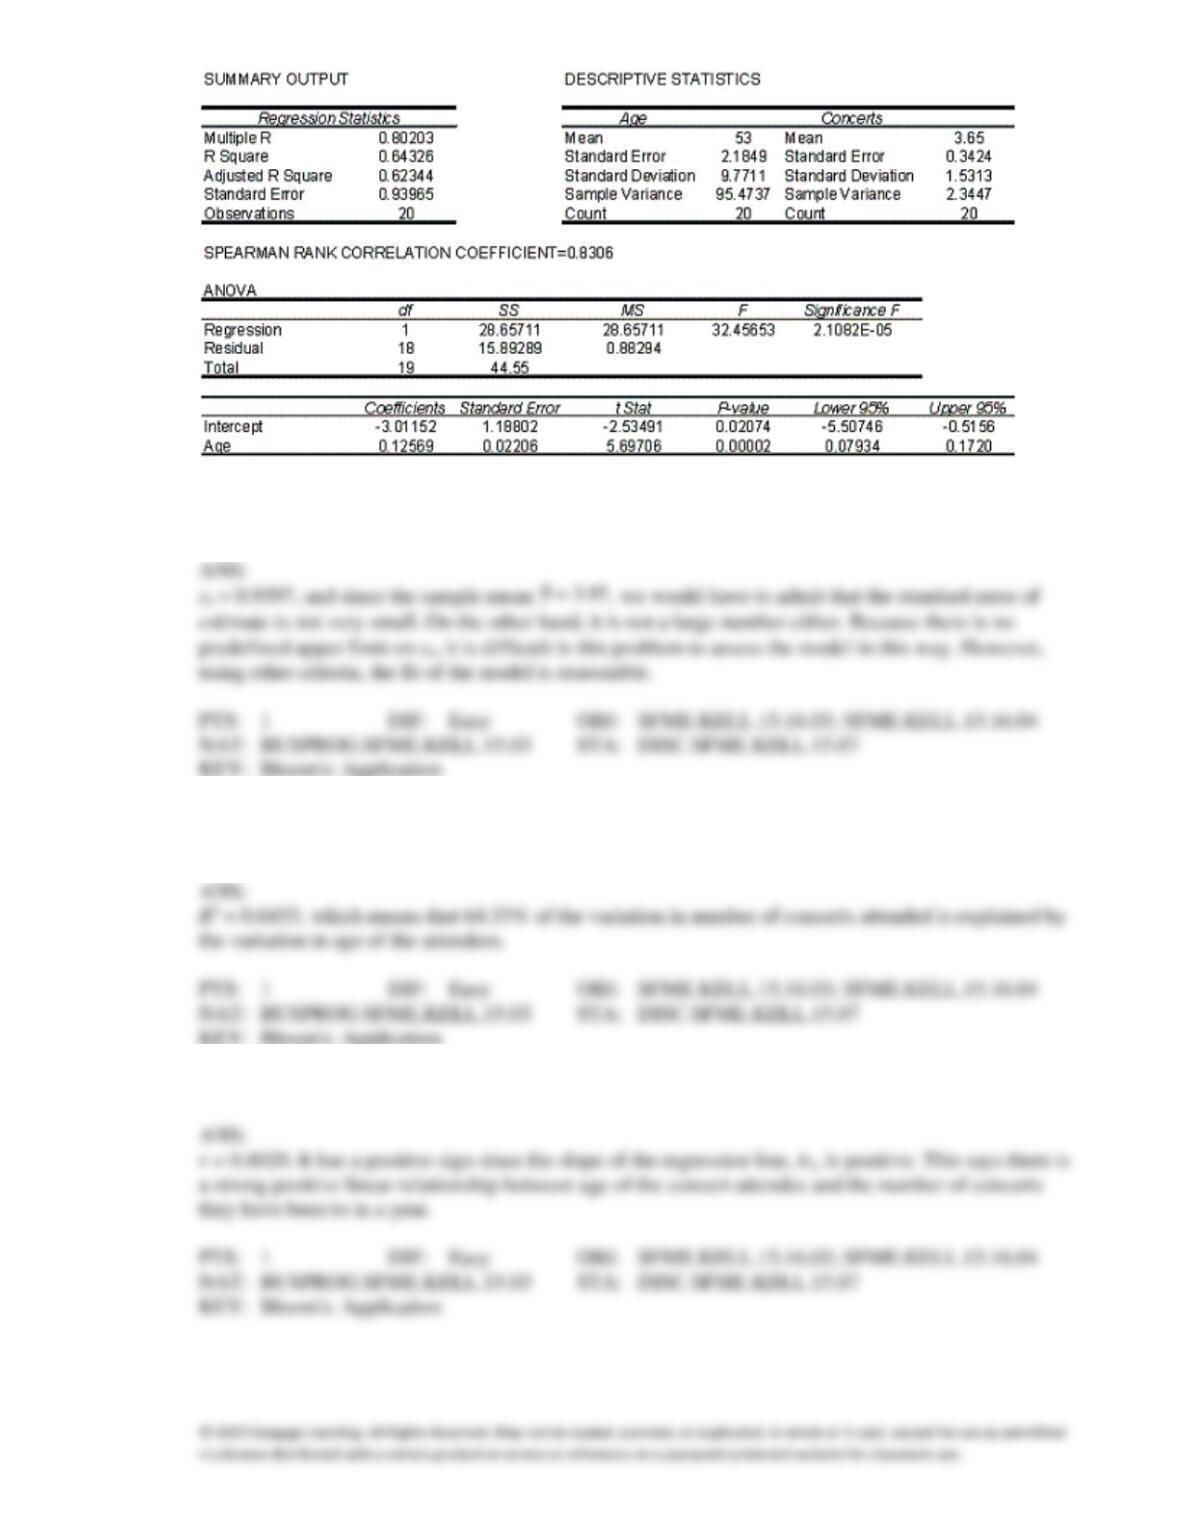
153. {Grateful Dead Concert Narrative} Determine the standard error of estimate and describe what this
statistic tells you about the model’s fit.
154. {Grateful Dead Concert Narrative} Determine the coefficient of determination and discuss what its
value tells you about the two variables.
155. {Grateful Dead Concert Narrative} Calculate the Pearson correlation coefficient and interpret.
156. {Grateful Dead Concert Narrative} Conduct a test of the population coefficient of correlation to
determine at the 5% significance level whether a positive linear relationship exists between age and
number of concerts attended.
157. {Grateful Dead Concert Narrative} Conduct a test of the population slope to determine at the 5%
significance level whether a positive linear relationship exists between age and number of concerts
attended.
158. {Grateful Dead Concert Narrative} Do the
and
1 tests in the previous two questions provide the
same results? Explain.
159. {Oil Quality and Price Narrative} Determine the standard error of estimate and describe what this
statistic tells you.