Chapter 4
4.1 a
12
54081333060 441040 152552
n
x
xi+++++++++++
==
=
12
489
= 40.75
Ordered data: 0, 5, 15, 25, 30, 33, 40, 44, 52, 60, 81, 104; Median = (33 + 40)/2 = 36.5
Mode = all
4.3 a
12
6.63.86.185.124.35.3 8.27.80 .226.12.75.5
n
x
xi+++++++++++
==
=
12
5.102
= 8.54
Ordered data: 1.6, 2.8, 3.4, 5.3, 5.5, 6.6, 7.2, 8.3, 8.7, 12.5, 18.6, 22.0; Median = 6.9
Mode = all
b The mean number of miles jogged is 8.54. Half the sample jogged more than 6.9 miles and half jogged less.
20
Ordered data: 0, 2, 3, 4, 4, 4, 6, 7, 8, 8, 9, 9, 10, 11, 12, 12, 13, 13, 14, 15; Median = 8.5
Mode = 4
b The mean number of days to submit grades is 8.2, the median is 8.5, and the mode is 4.
4.8 a
5
20.05.06.22..10
n
x
xi+−++
==
=
5
53.
= .106
4.9 a
5
50.08.15..20–.15–
n
x
xi+−+
==
=
5
22.
= .044
4.10 a Year 1 rate of return =
1000
10001200−
= .20
1200
b
4
33.25.0.20 +++
==
n
x
xi
=
4
78.
= .195
Ordered data: 0, .20, .25, .33; Median = .225
4.11 a Year 1 rate of return =
12
1210 −
= –.167
b
6
167.364.467.071..40.167–
n
x
xi−++++
==
=
6
968.
= .161
Ordered data: –.167, –.167, .071, .364, .40, .467; Median = .218
4.12 a
x
= 75,750; median = 76,410
b The mean starting salary is $75,750. Half the sample earned less than $76,410.
4.13 a
x
= 11.19; median = 11
b The mean number of days is 11.19 and half the sample took less than 11 days and half took more than 11 days to
pay.
x
x
x
4.16a
x
= .81; median = .84
b The mean percentage is .81. Half the sample paid less than .84.
x
x
4.19
8
4 5 7 1 4 7 39
n
x
xi+++++++
==
=
8
40
= 5
18
)54(…)53()59[(
1n
)xx(
s
222
2
i
2
−
−++−+−
=
−
−
=
=
7
46
= 6.57
8
40
4.21
9
21171513233122612
n
x
xi++++++++
==
=
9
160
= 17.78
4.22
10
30)5(1)4(46)3()5(0
n
x
xi++−++−+++−+−+
==
=
10
3−
= –.30
4.23 The data in (b) appear to be most similar to one another.
4.25 Variance cannot be negative because it is the sum of squared differences.
4.26 6, 6, 6, 6, 6
4.27 a about 68%
b about 95%
c About 99.7%
4.29 a at least 75%
b at least 88.9%
4.30 a Nothing
=
2
s
4.32
=
2
s
40.73 mph
2
and s = 6.38 mph; at least 75% of the speeds lie within 12.76 mph of the mean;
at least 88.9% of the speeds lie within 19.14 mph of the mean
4.33 a Punter Variance Standard deviation
1 40.22 6.34
2 14.81 3.85
3 3.63 1.91
b Punter 3 is the most consistent.
=
2
s
2
4.36a s = 15.01
4.37 a
=x
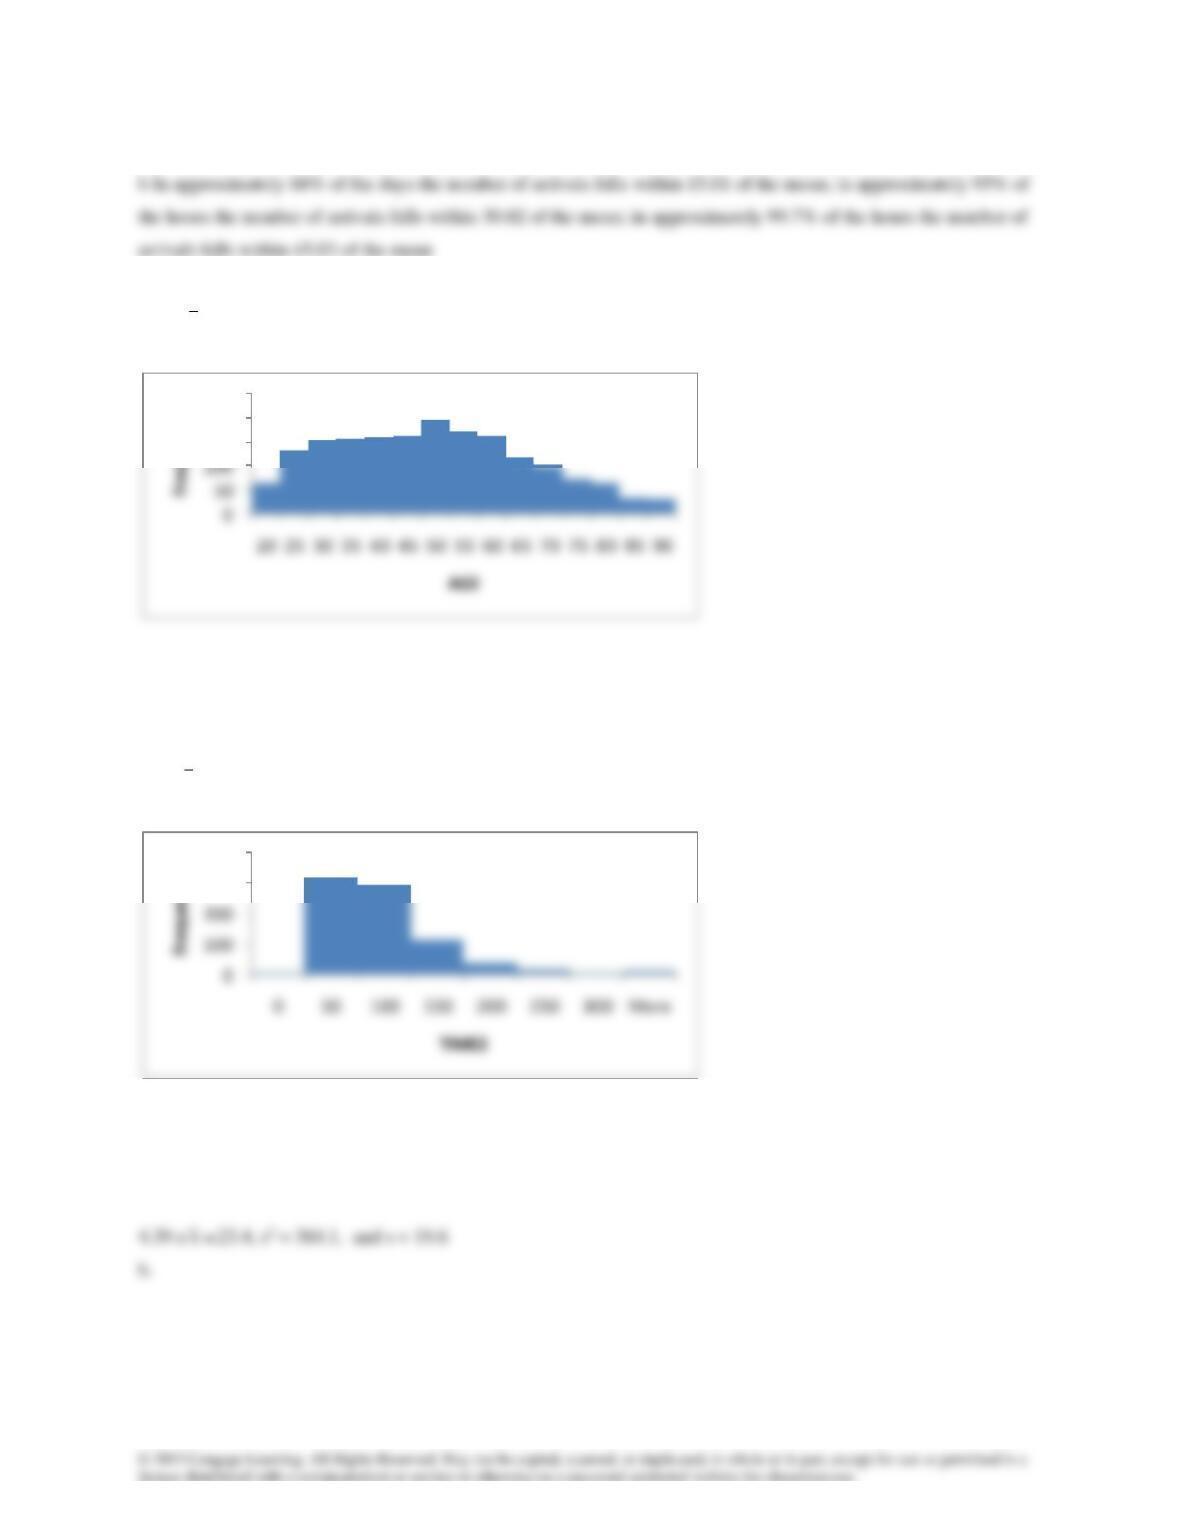
47.71, s2 = 302.18 and s = 17.38
b.
c The histogram is approximately bell shaped allowing us to use the Empirical Rule. Approximately 68% of adults
are between 12.9 and 82.5 years old.
4.38a
=x
77.86 and s = 85.35
b.
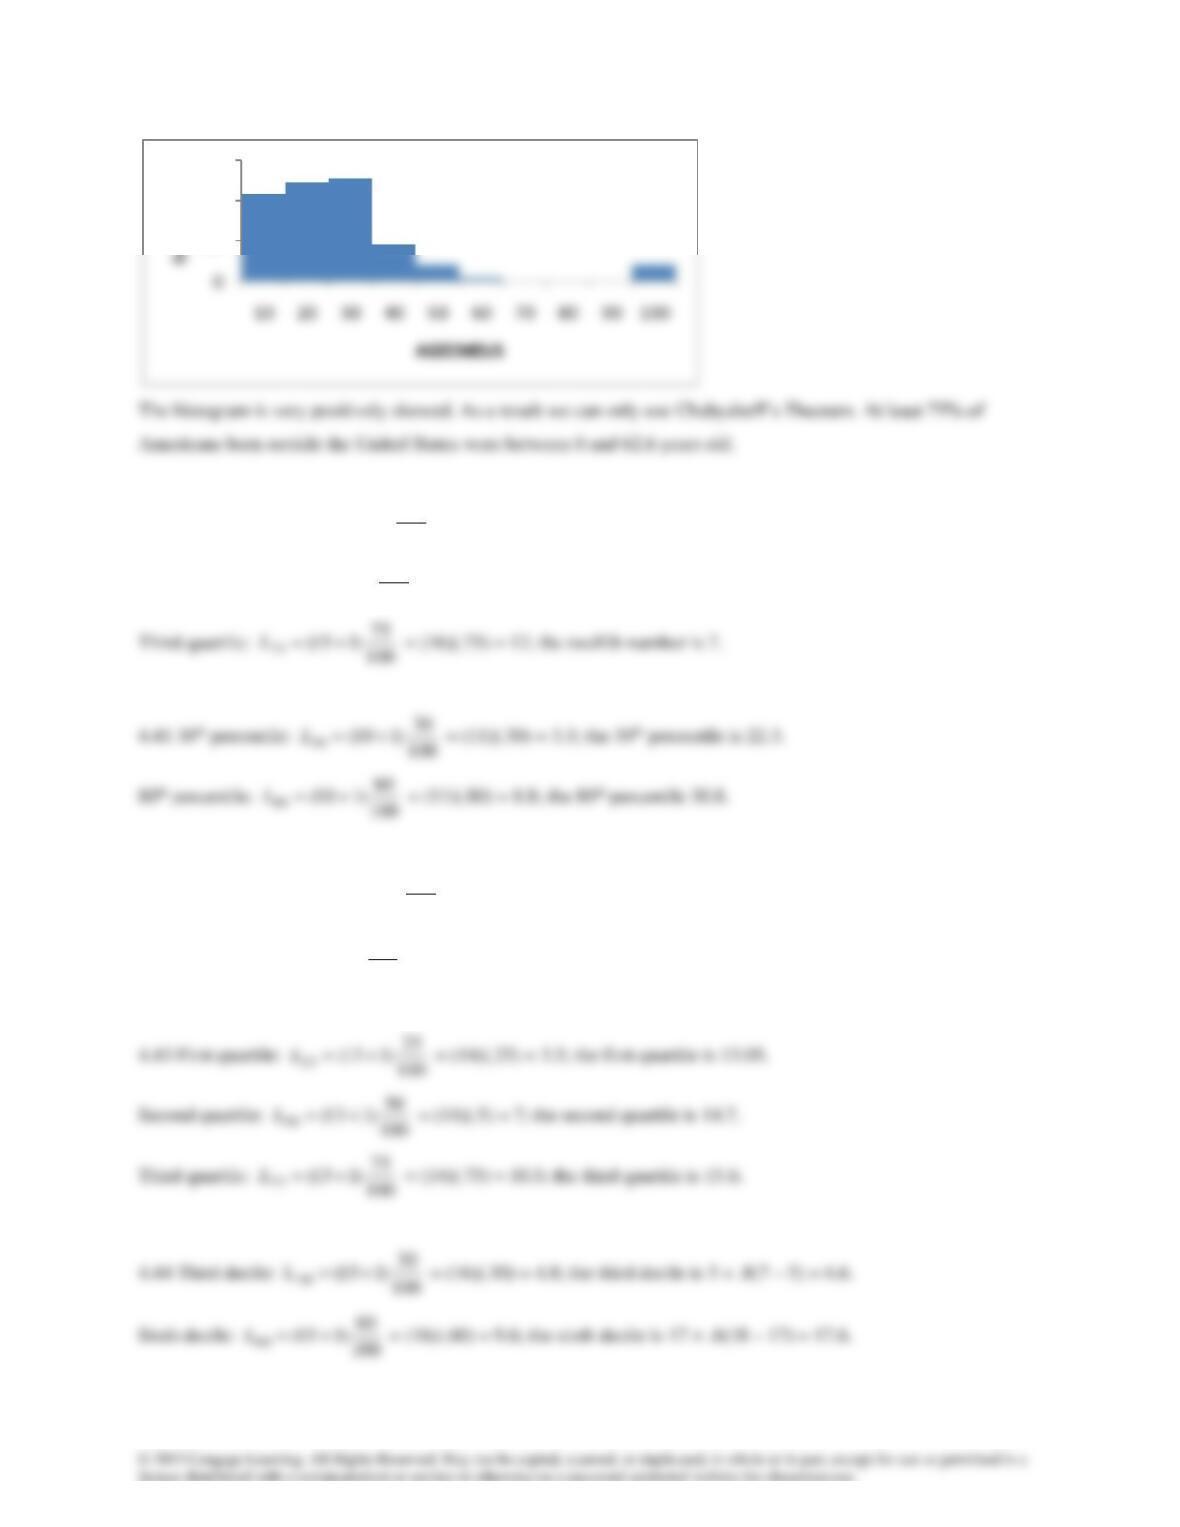
c. The histogram is positively skewed; we must use Chebysheff’s Theorem. At least 75% of American adults watch
between 0 and 249 minutes of television news.
=x
150
200
250
300
400
4.40 First quartile:
100
25
)115(
25 +=L
= (16)(.25) = 4; the fourth number is 3.
Second quartile:
100
50
)115(
50 +=L
= (16)(.5) = 8; the eighth number is 5.
100
75
)115(
100
30
)110(
100
80
)110(
4.42 20th percentile:
100
20
)110(
20 +=L
= (11)(.20) = 2.2; the 20th percentile is 43 + .2(51–43) = 44.6.
40th percentile:
100
40
)110(
40 +=L
= (11)(.40) = 4.4; the 40th percentile is 52 +.4(60–52) = 55.2.
100
25
100
100
100
100
)115(
20
40
60
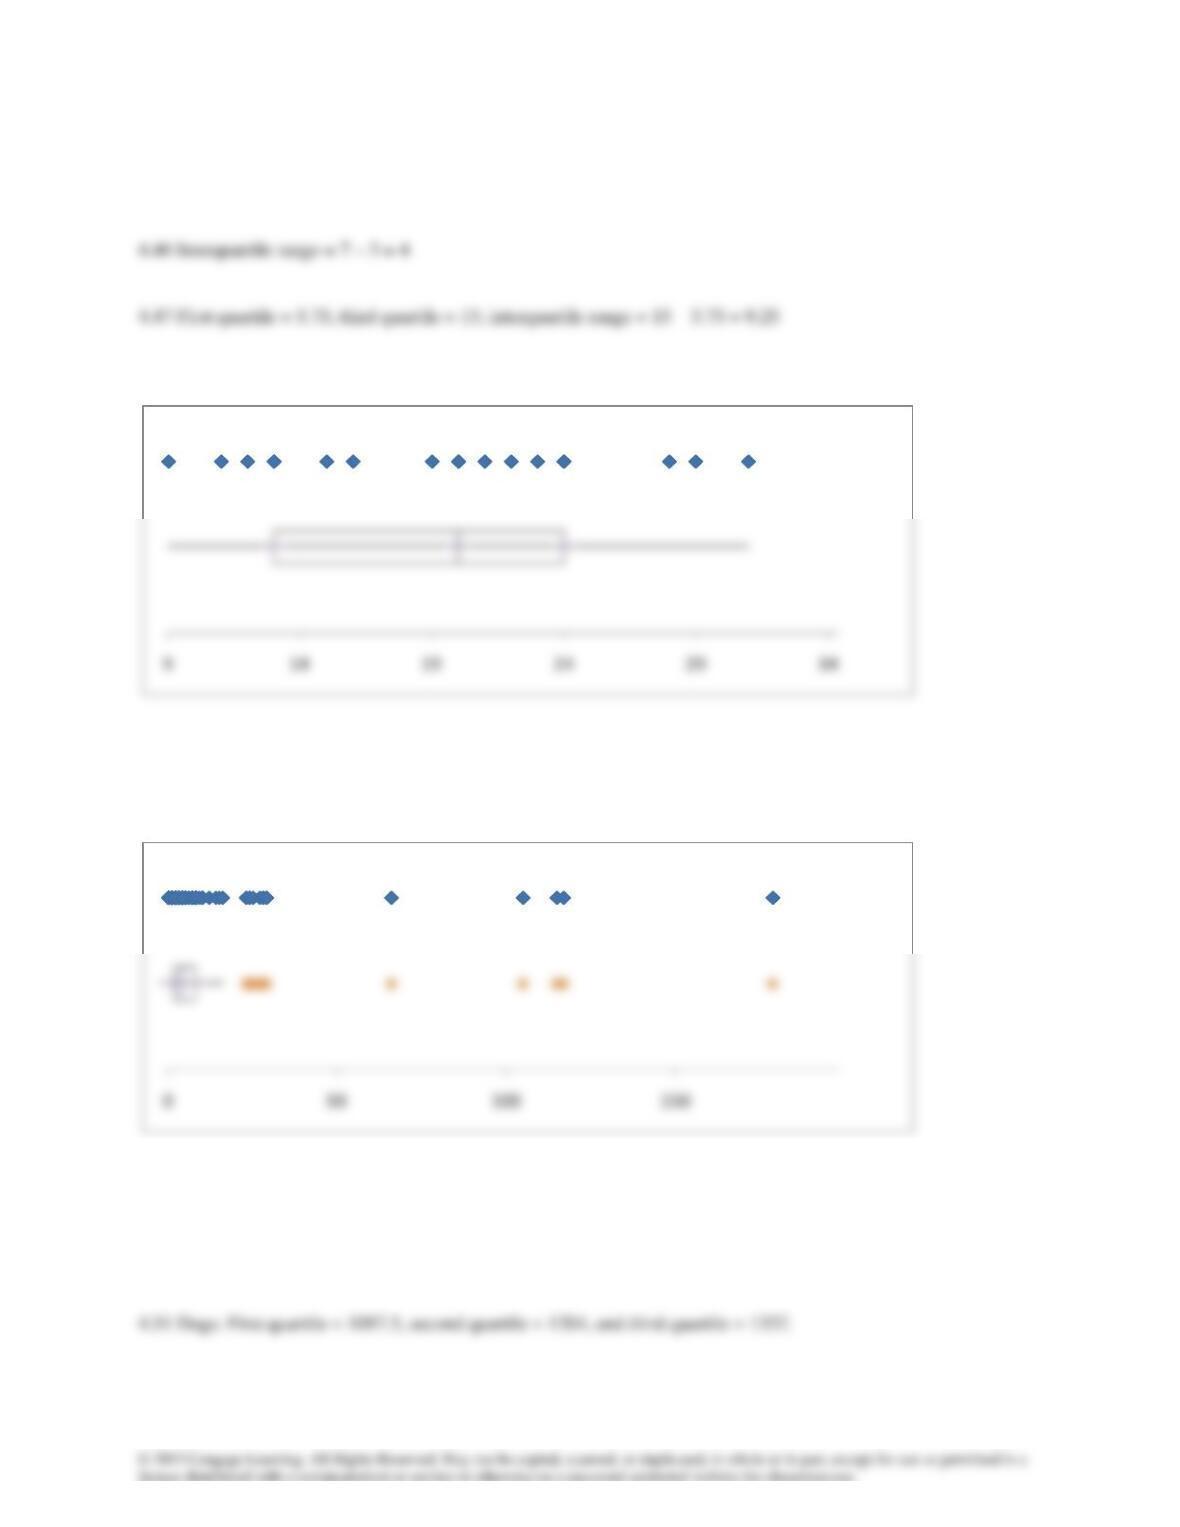
4.45 Interquartile range = 15.6 –13.05 = 2.55
4.48
4.49 L85 = 75; The speed limit should be set at 75 mph.
4.50
a First quartile = 2, second quartile = 4, and third quartile = 8.
b Most executives spend little time reading resumes. Keep it short.
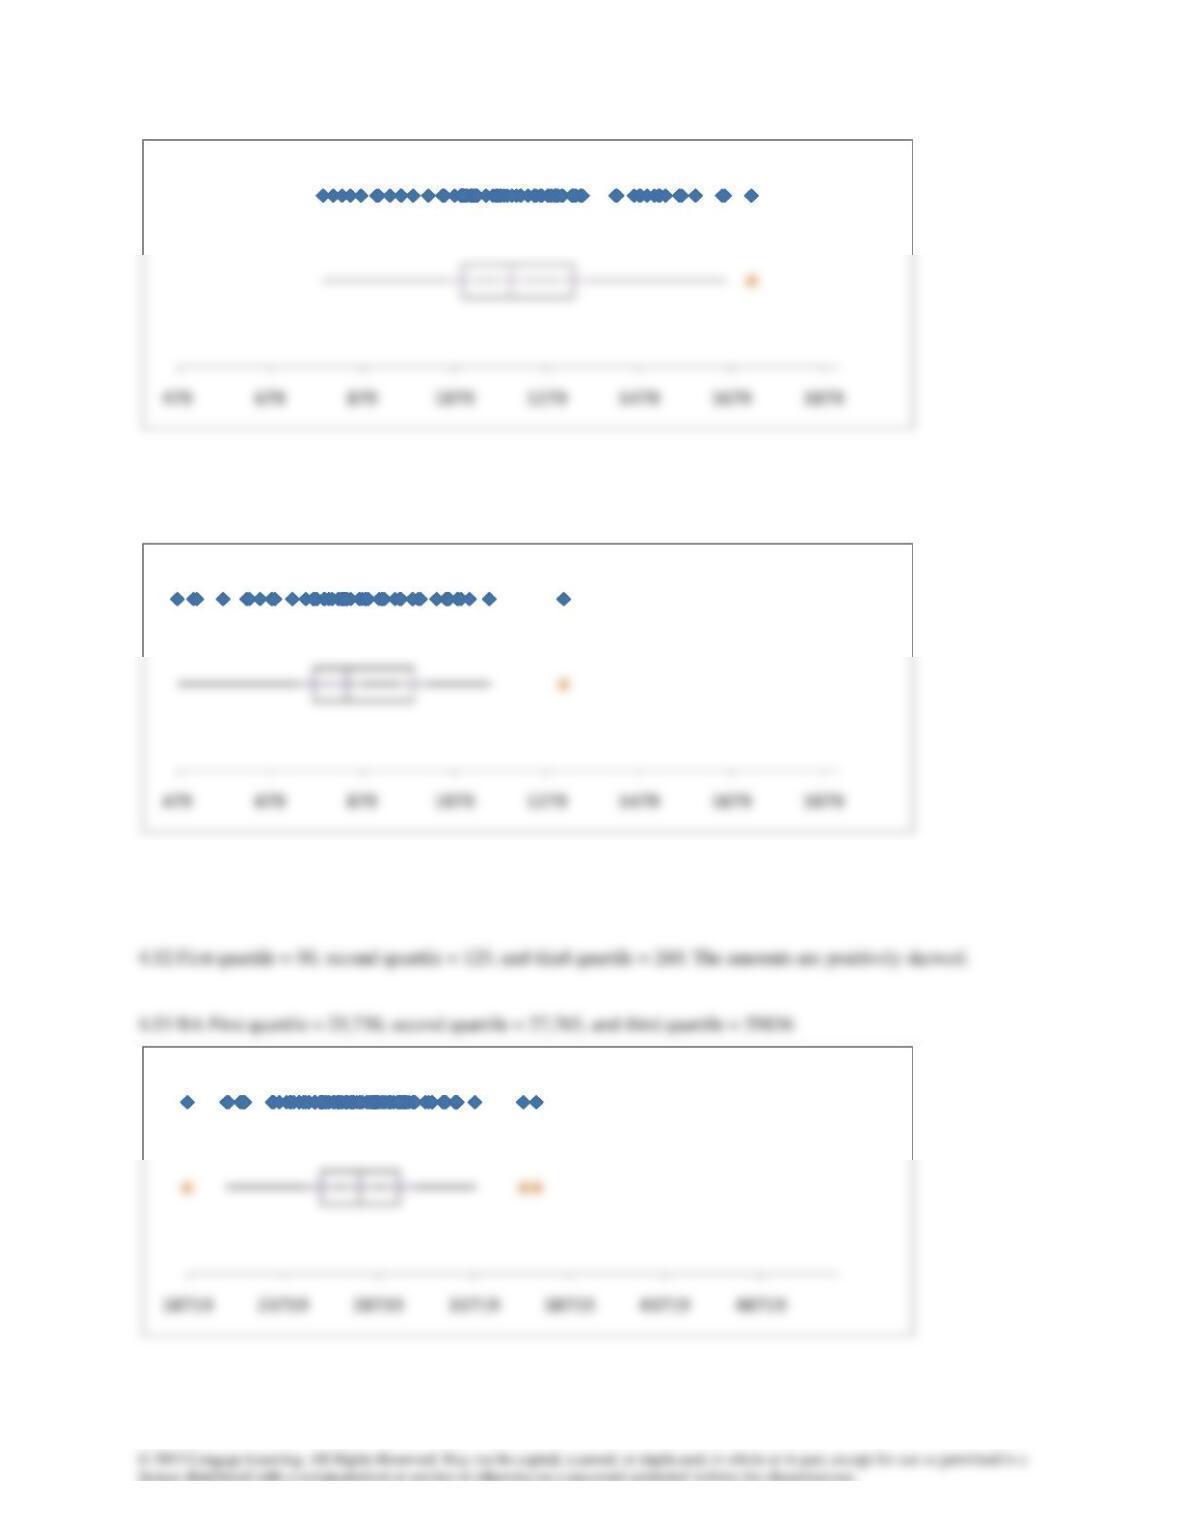
Cats: First quartile = 743, second quartile = 856, and third quartile = 988.
Dogs cost more money than cats. Both sets of expenses are positively skewed.
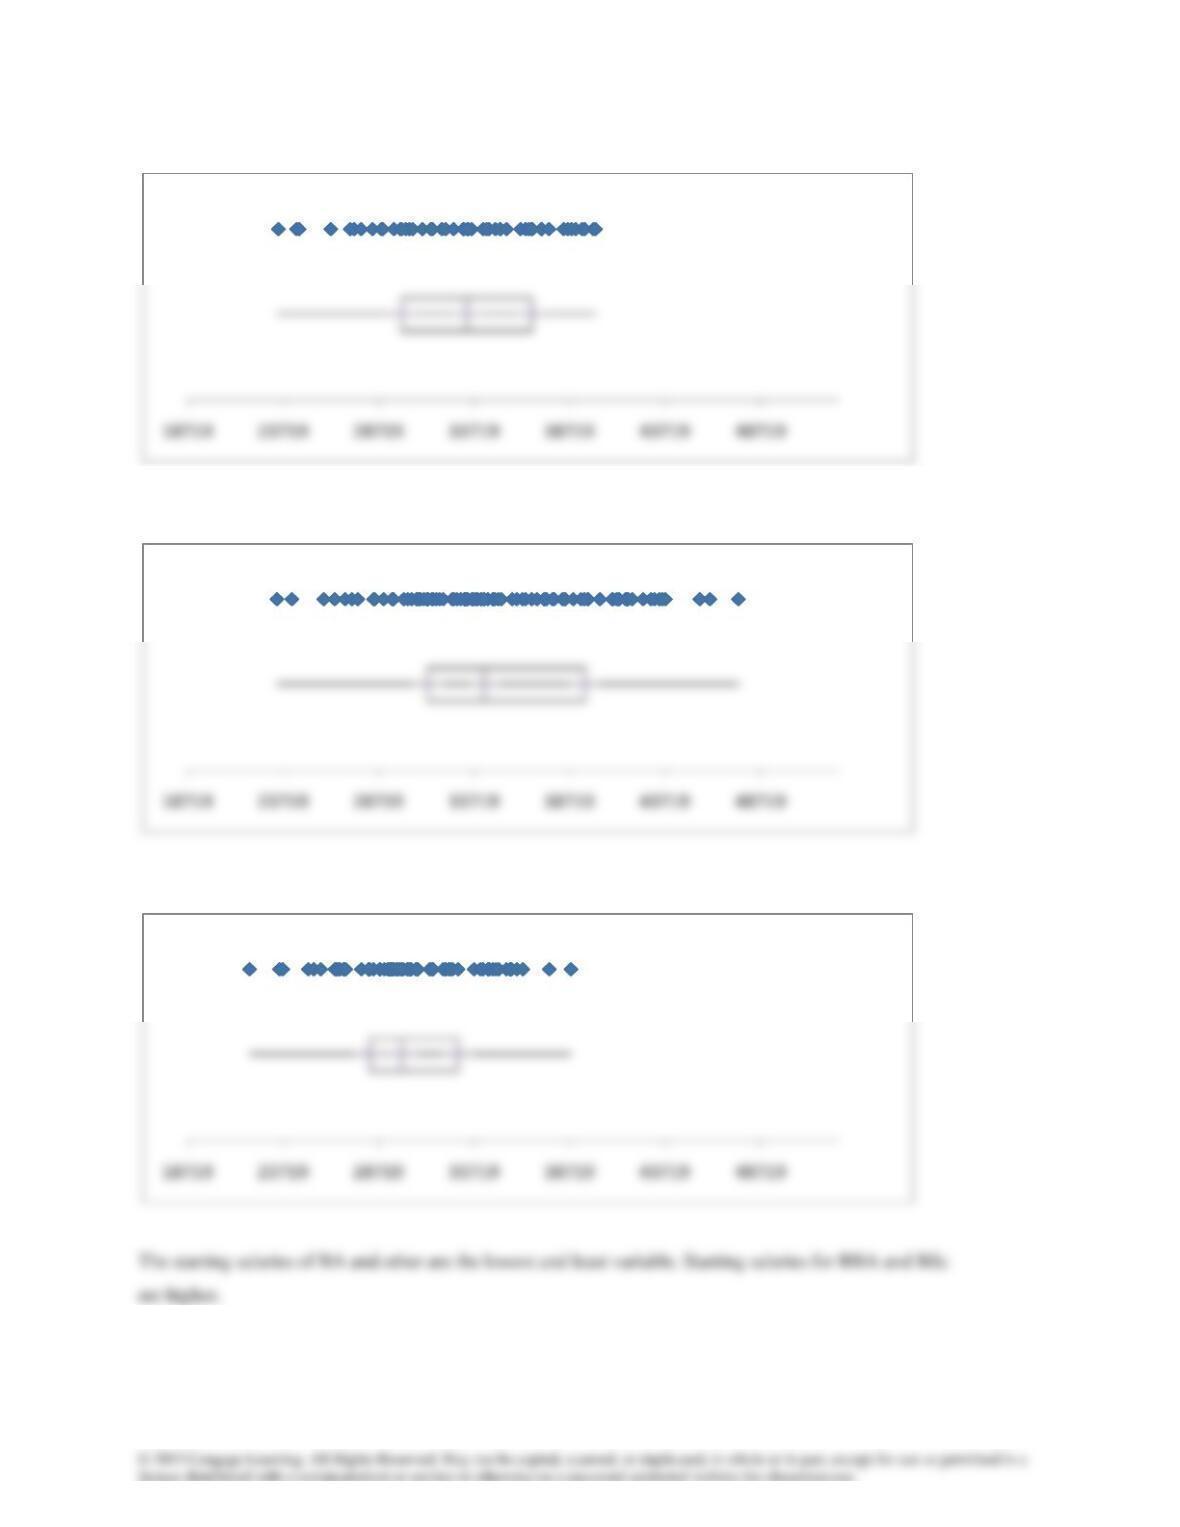
BSc First quartile = 29,927, second quartile = 33,397, and third quartile = 36,745
BBA First quartile = 31,316, second quartile = 34,284, and third quartile = 39,551
Other First quartile = 28,254, second quartile = 29,951, and third quartile = 32,905
4.54 a
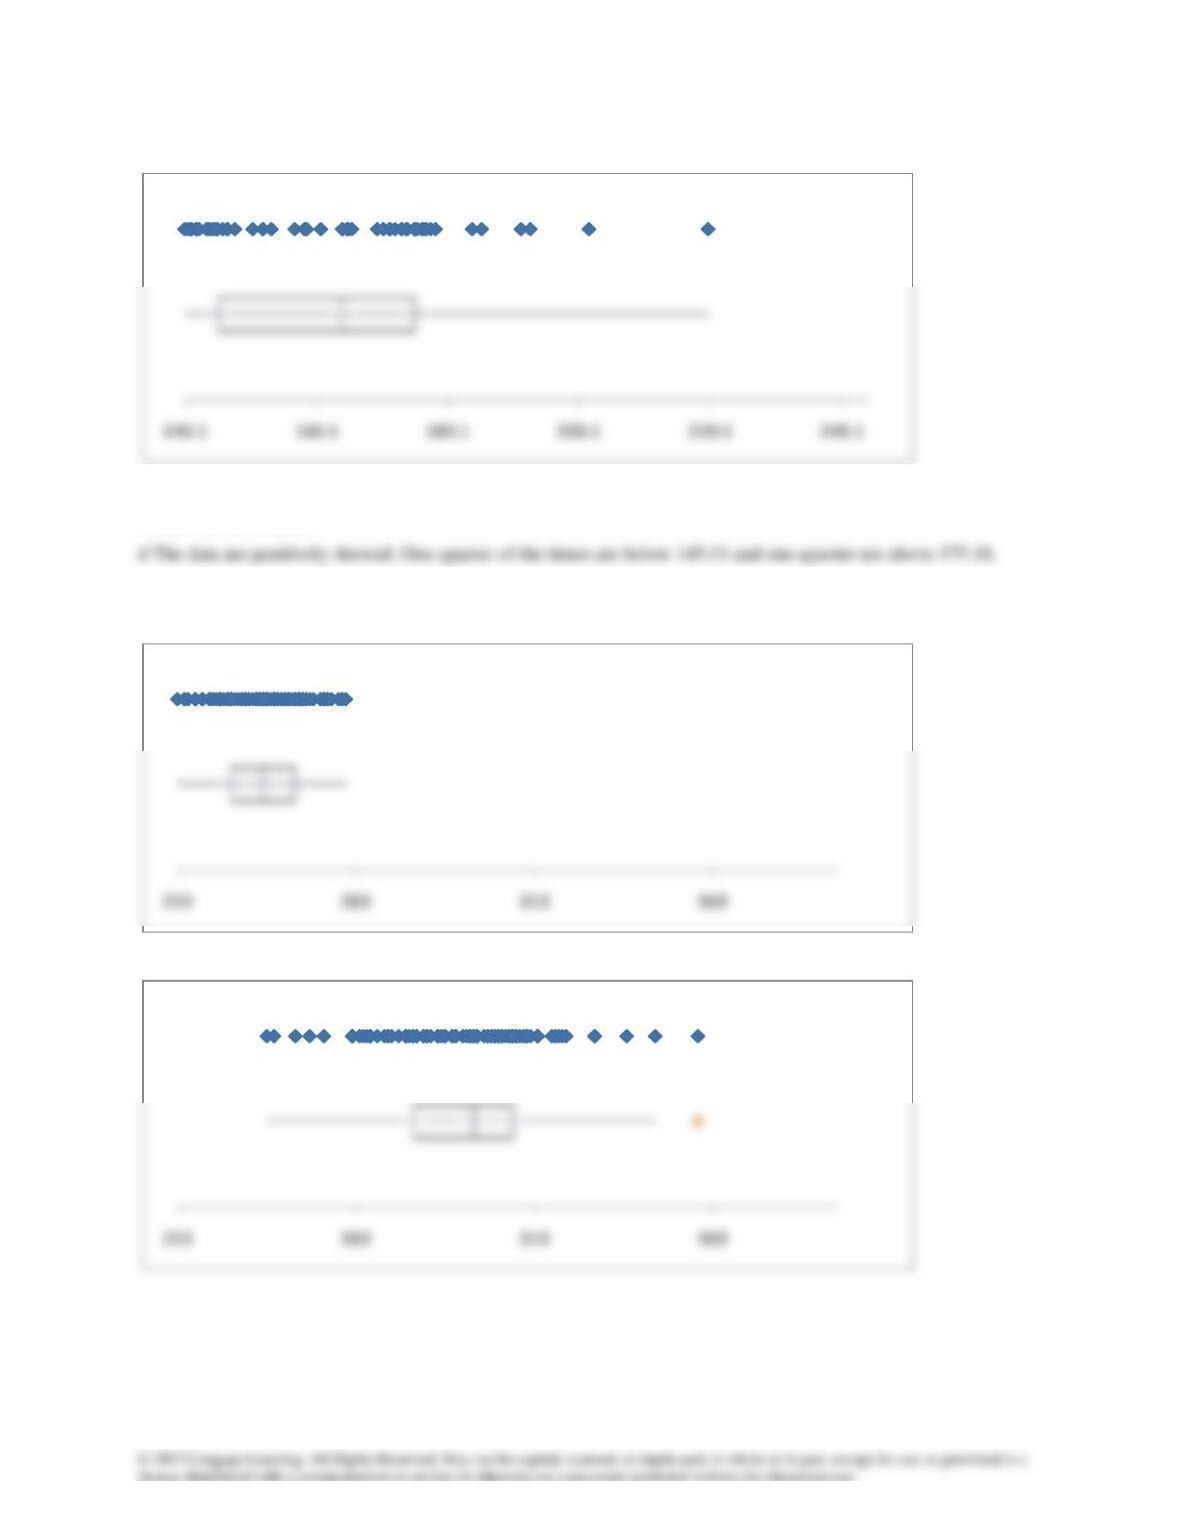
b The quartiles are 145.11, 164.17, and 175.18
c There are no outliers.
4.55a Private course: The quartiles are 145.11, 164.17, and 175.18
Public course: The quartiles are 279, 296, and 307
b The amount of time taken to complete rounds on the public course are larger and more variable than those played
on private courses.
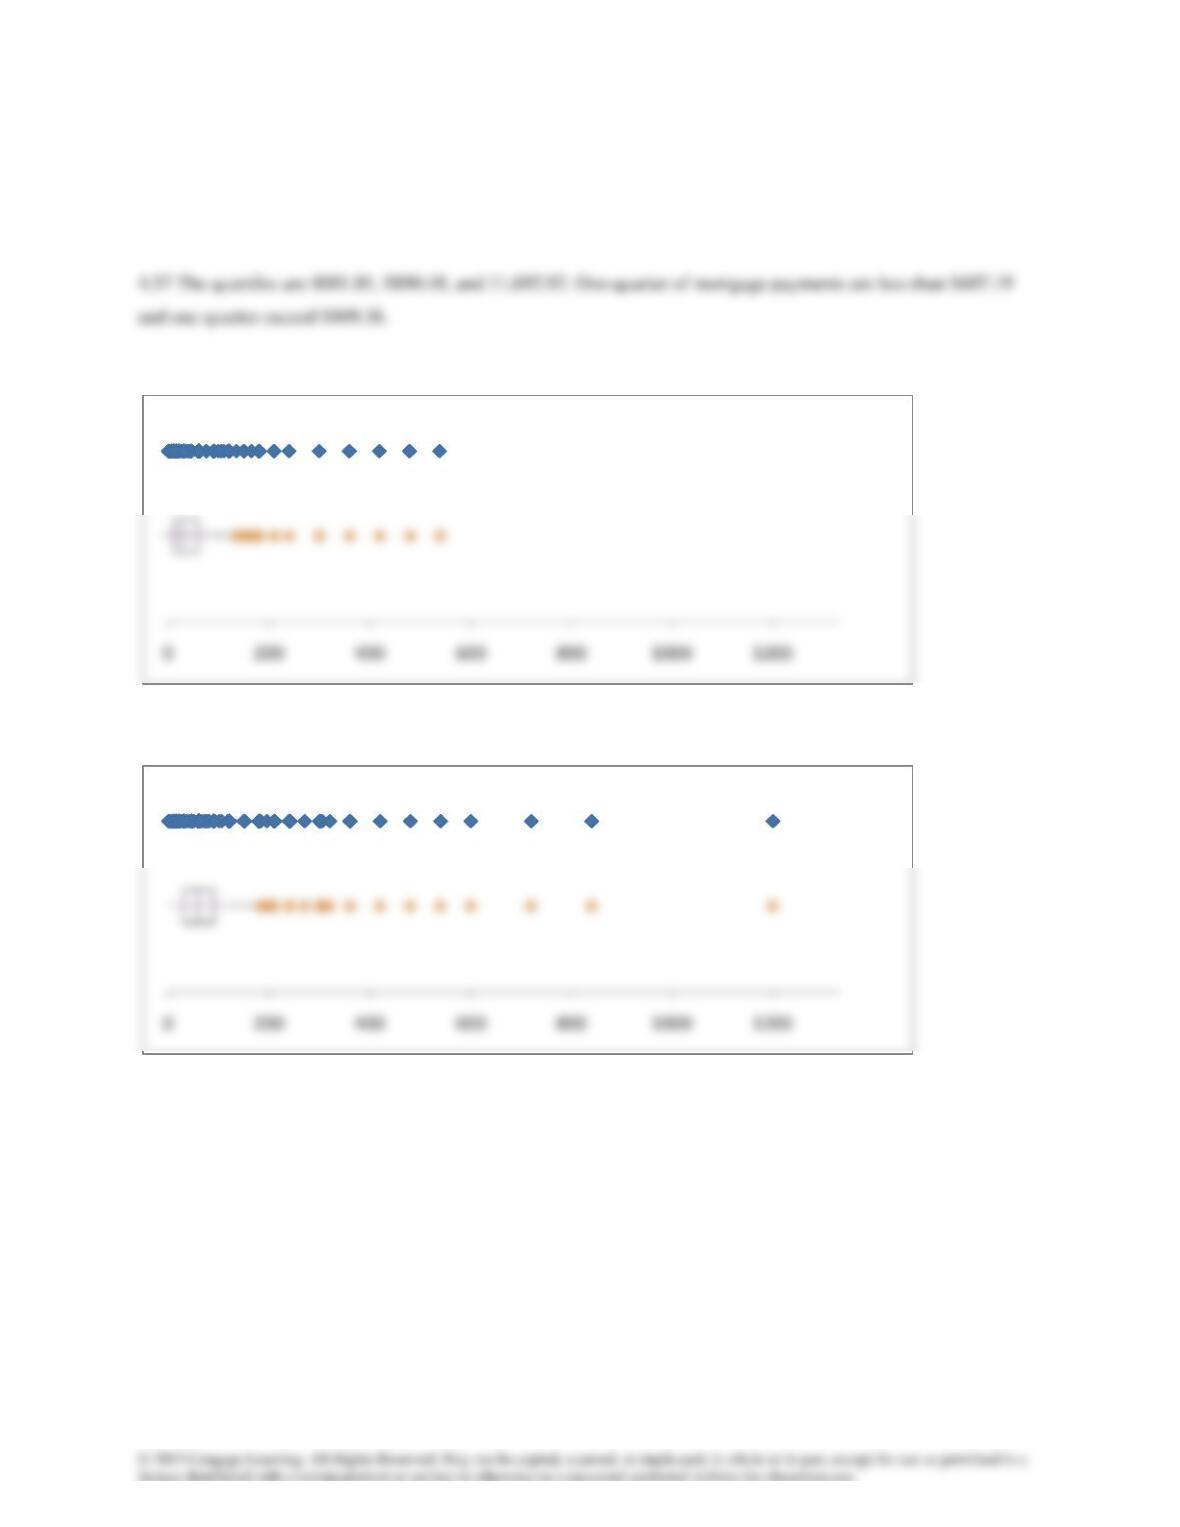
4.56 a The quartiles are 26, 28.5, and 32
b the times are positively skewed.
4.58 TIME1
TIME2
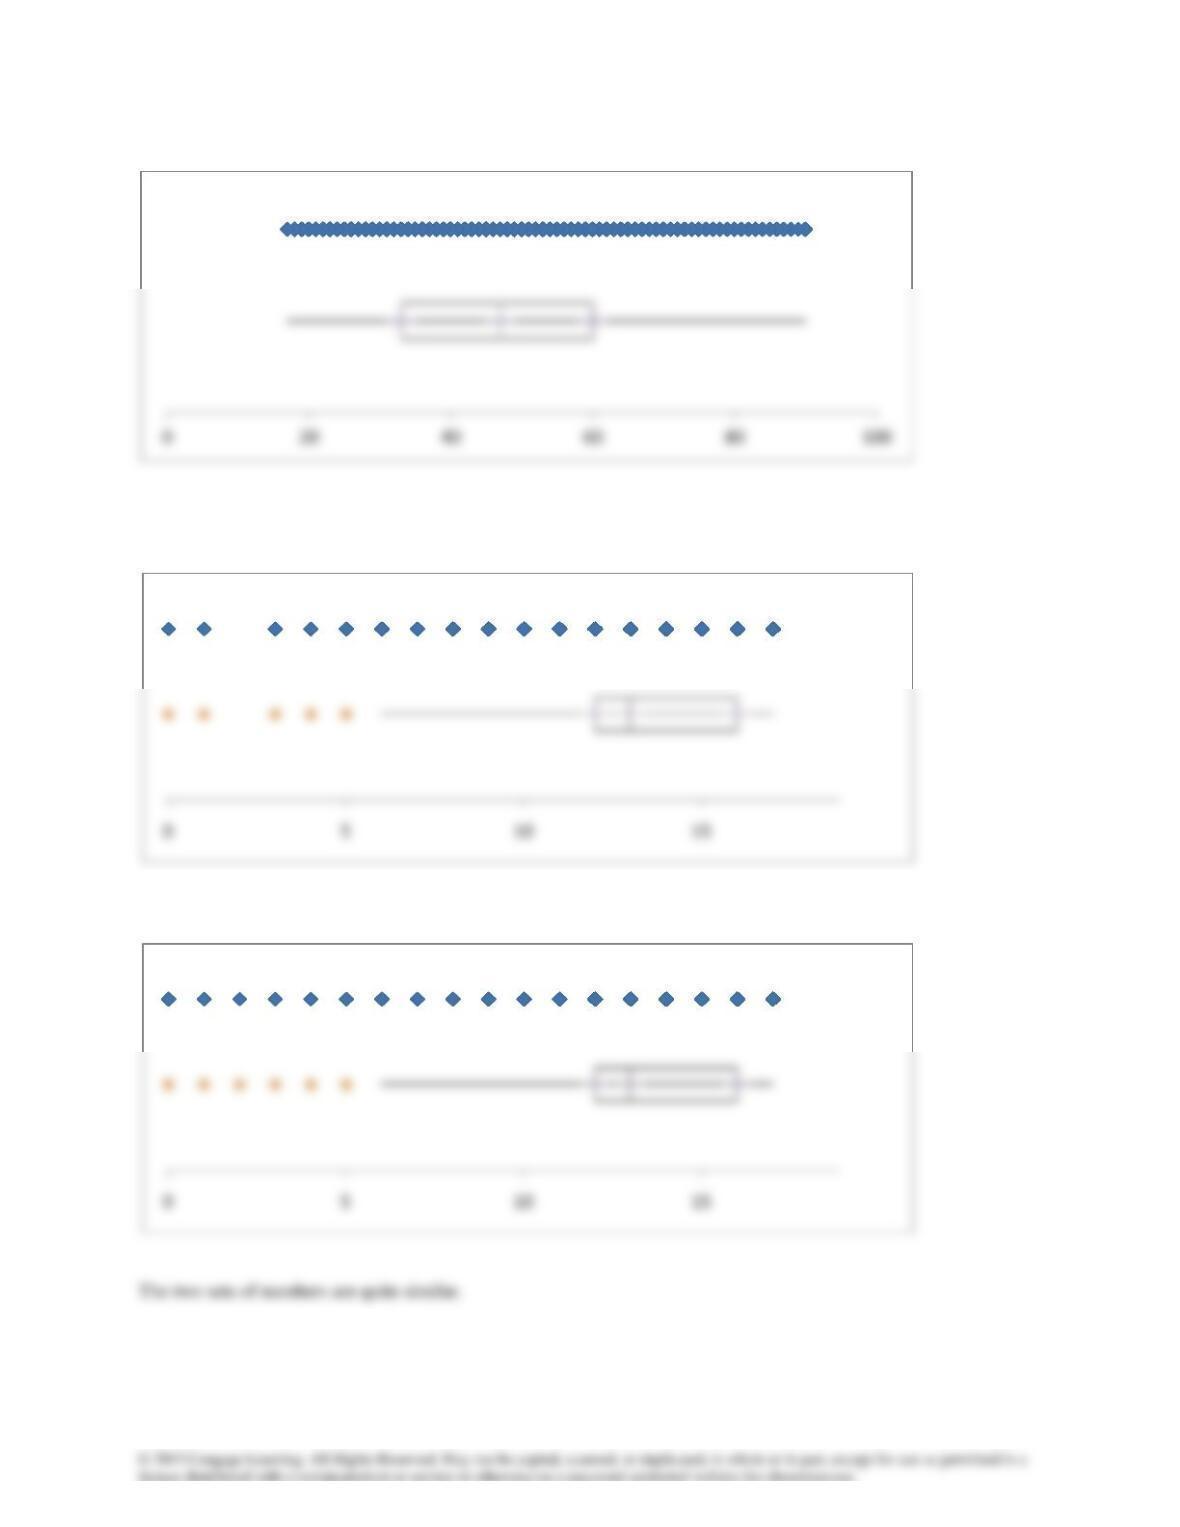
Americans spend more time watching new on television than reading news on the Internet.
4.59
4.60 EDUC
SPEDUC
4.61The quartiles are 33, 47, 61
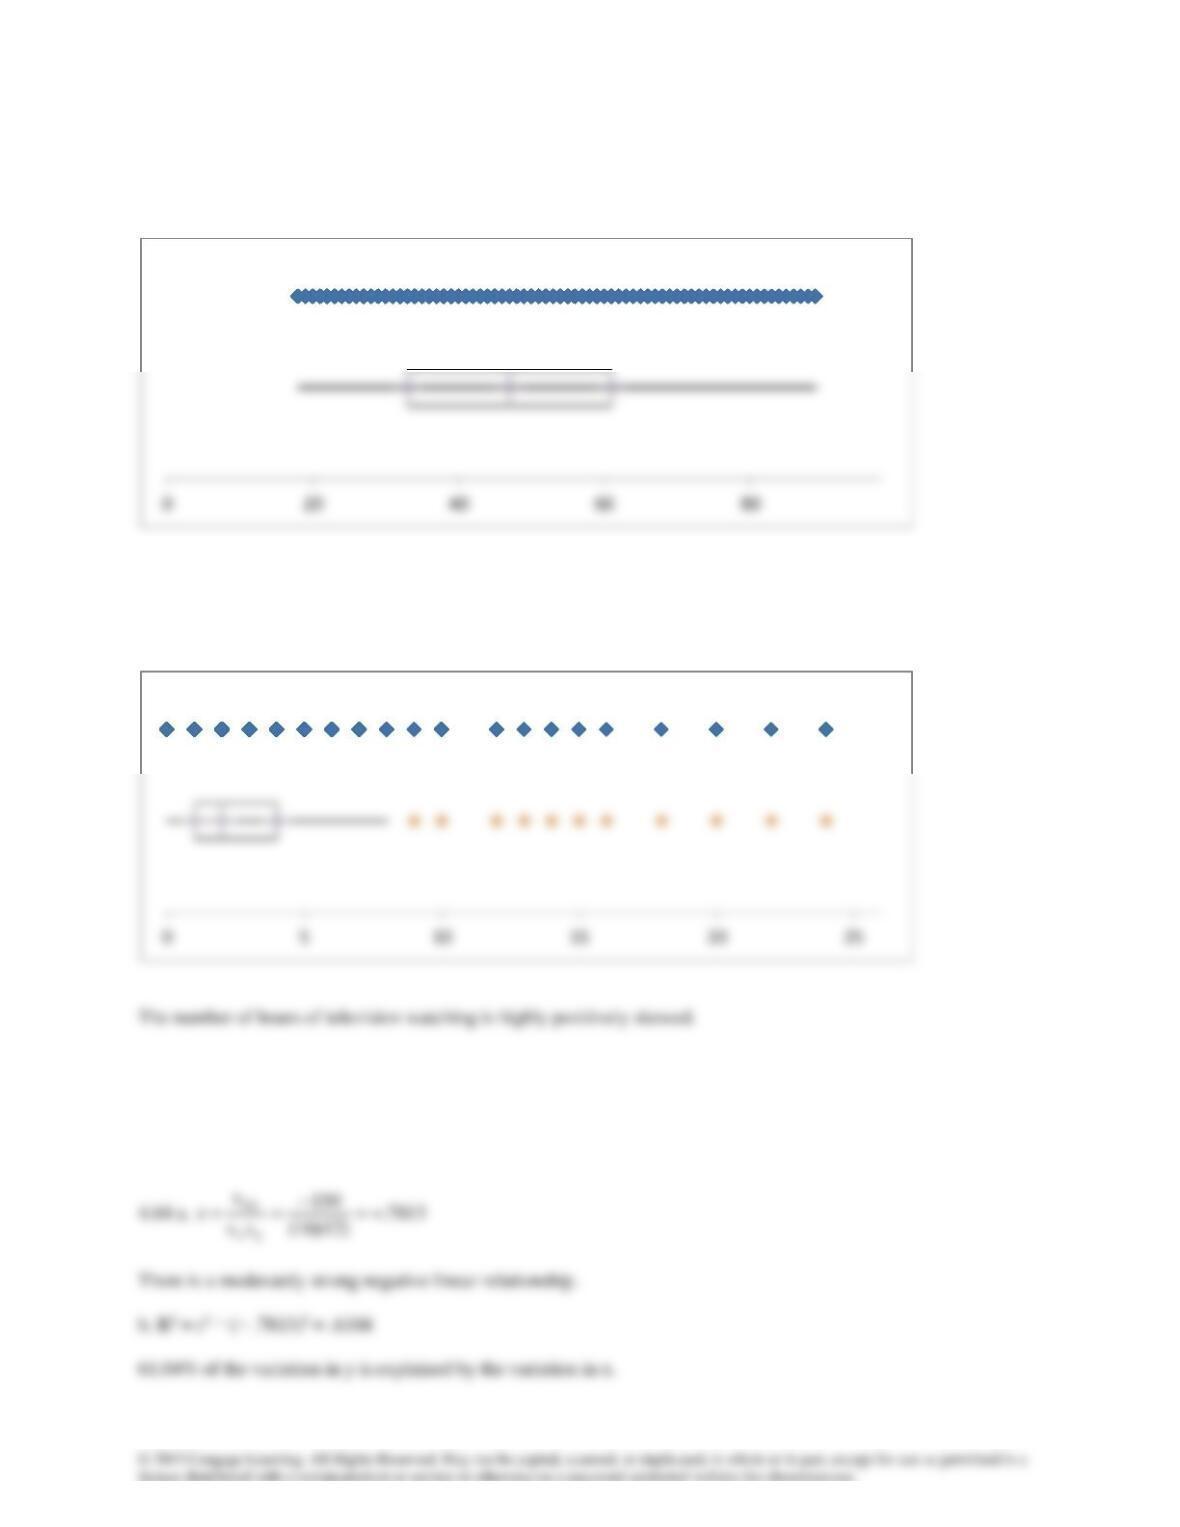
Ages are symmetric.
4.62 The quartiles are 1, 2, 4
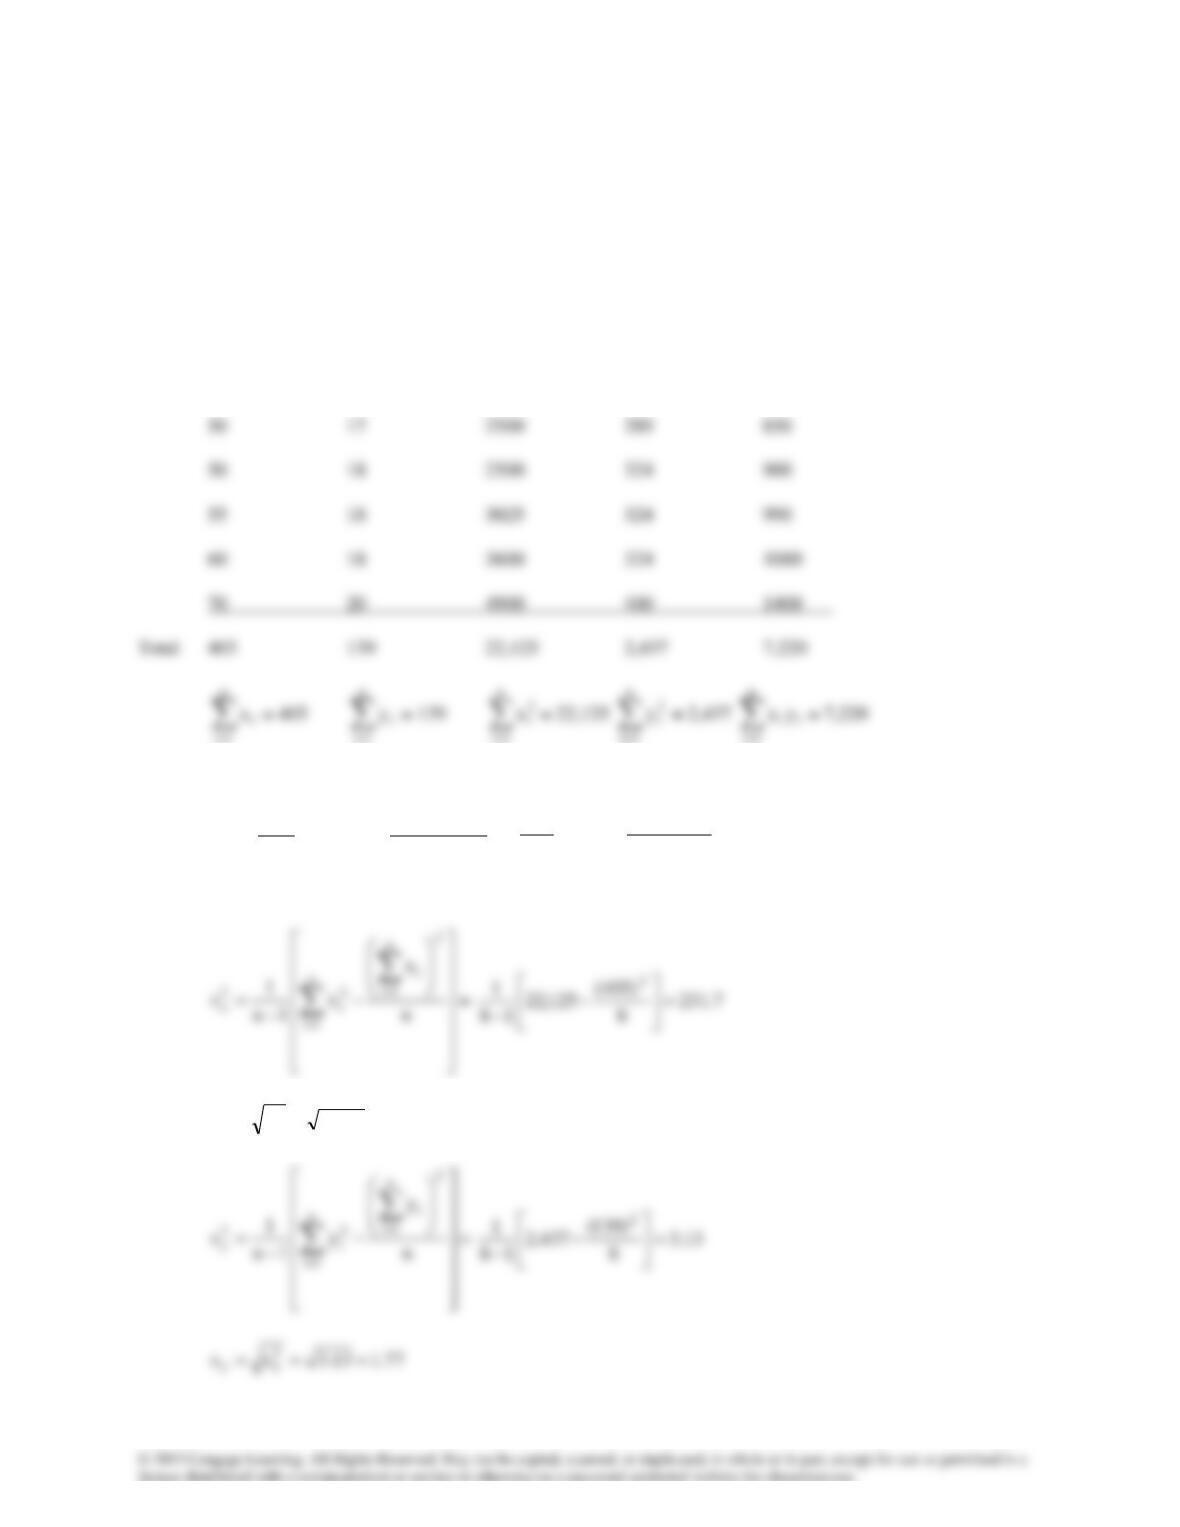
4.63 There is a negative linear relationship. The strength is unknown.
4.65a.
i
x
i
y
2
i
x
2
i
y
iiyx
20 14 400 196 280
40 16 1600 256 640
60 18 3600 324 1080
−
−
=
==
=n
yx
yx
1n
1
s
n
1i
i
n
1i
i
n
1i
iixy
=
16.26
8
)139)(405(
220,7
18
1=
−
−
22.157.231ss 2
xx ===
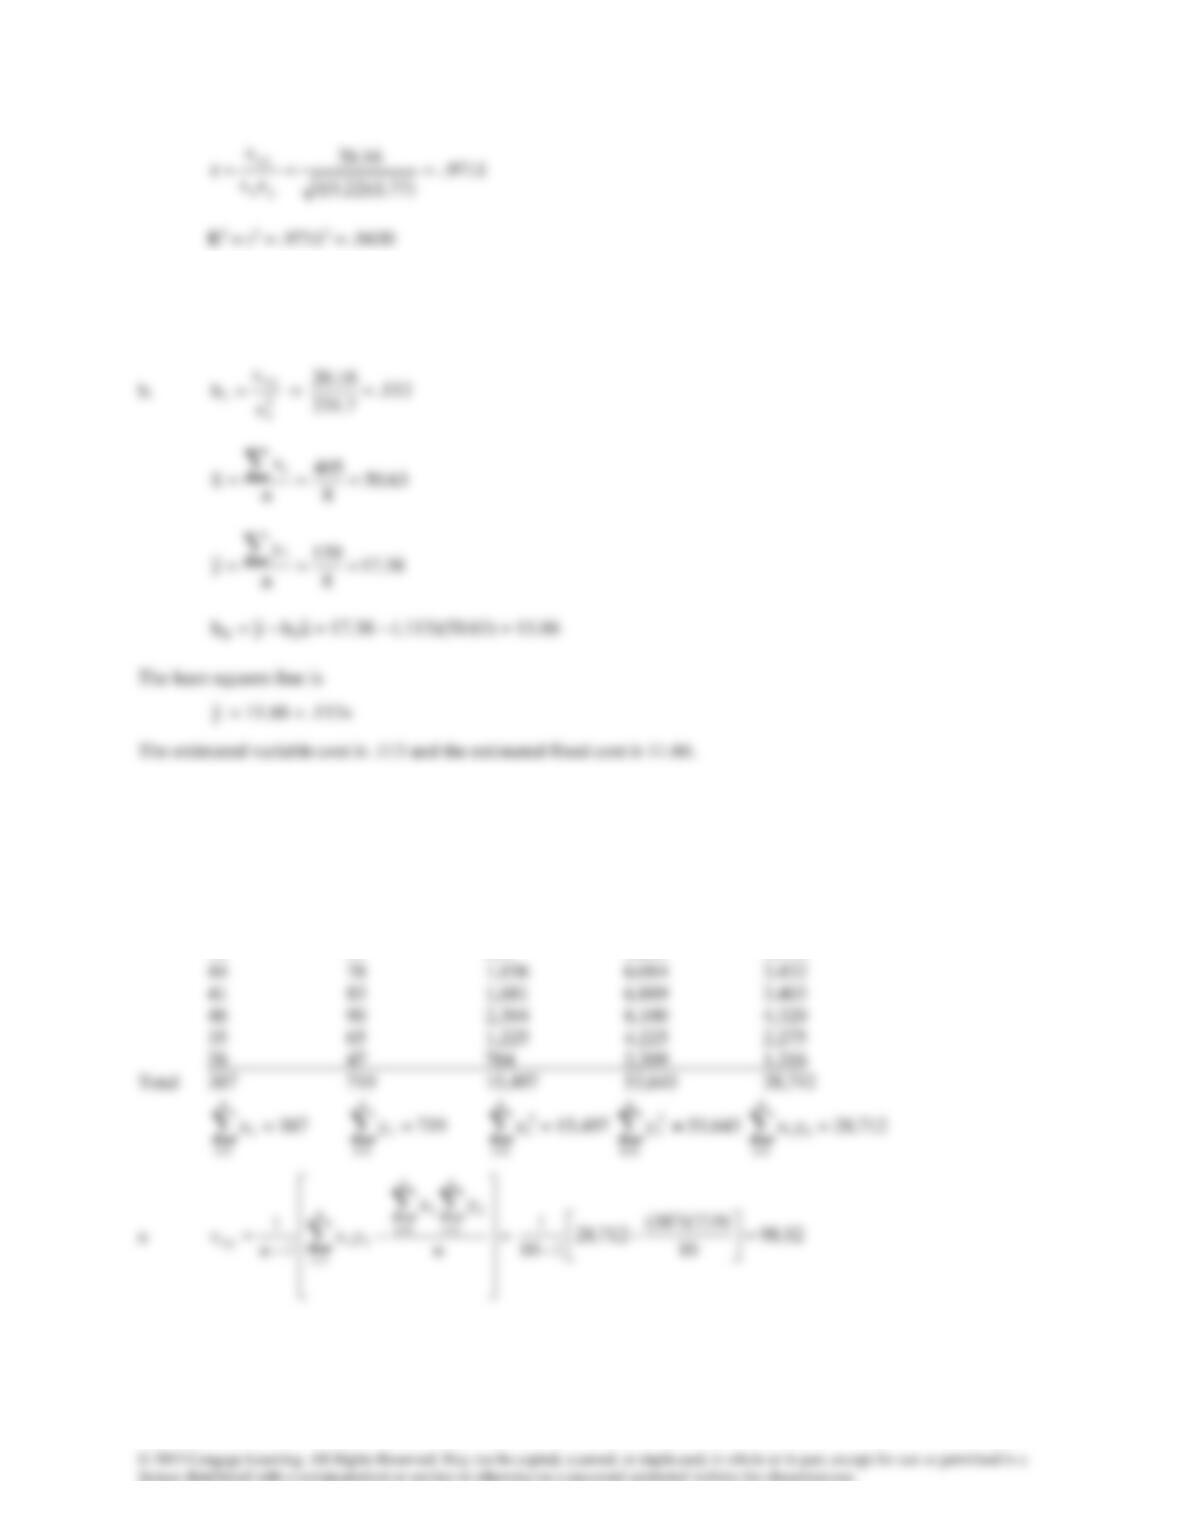
The covariance is 26.16, the coefficient of correlation is .9711 and the coefficient of determination is .9430.
94.30% of the variation in expenses is explained by the variation in total sales.
4.66
i
x
i
y
2
i
x
2
i
y
iiyx
40 77 1,600 5,929 3,080
42 63 1,764 3,969 2,646
37 79 1,369 6,241 2,923
47 86 2,209 7,396 4,041
25 51 625 2,601 1,276
−
−
=
=
=n
x
x
1n
1
s
2
n
1i
i
n
1i
2
i
2
x
=
79.57
10
)387(
497,15
110
12
=
−
−
b
8811.
)32.216)(79.57(
52.98
ss
s
r
yx
xy ===
c R2 = r2 = .88112 = .7763
d
2
x
xy
1s
s
b=
=
705.1
79.57
52.98 =
e. There is a strong positive linear relationship between marks and study time. For each additional hour of study time
marks increased on average by 1.705.
4.67
i
x
i
y
2
i
x
2
i
y
iiyx
599 9.6 358,801 92.16 5750.4
689 8.8 474,721 77.44 6063.2
584 7.4 341,056 54.76 4321.6
=
n
1i
i
x
=7,587
=
n
1i
i
y
= 106.4
=
n
1i
2
i
x
= 4,817,755
=
n
1i
2
i
y
= 957.2
=
n
1i
ii yx
= 67,559.2
56.437.897,1ss 2
xx ===
−
−
=
=
=n
y
y
1n
1
s
2
n
1i
i
n
1i
2
i
2
y
=
25.1
12
)4.106(
2.957
112
12
=
−
−
4.68
4.69 a
c
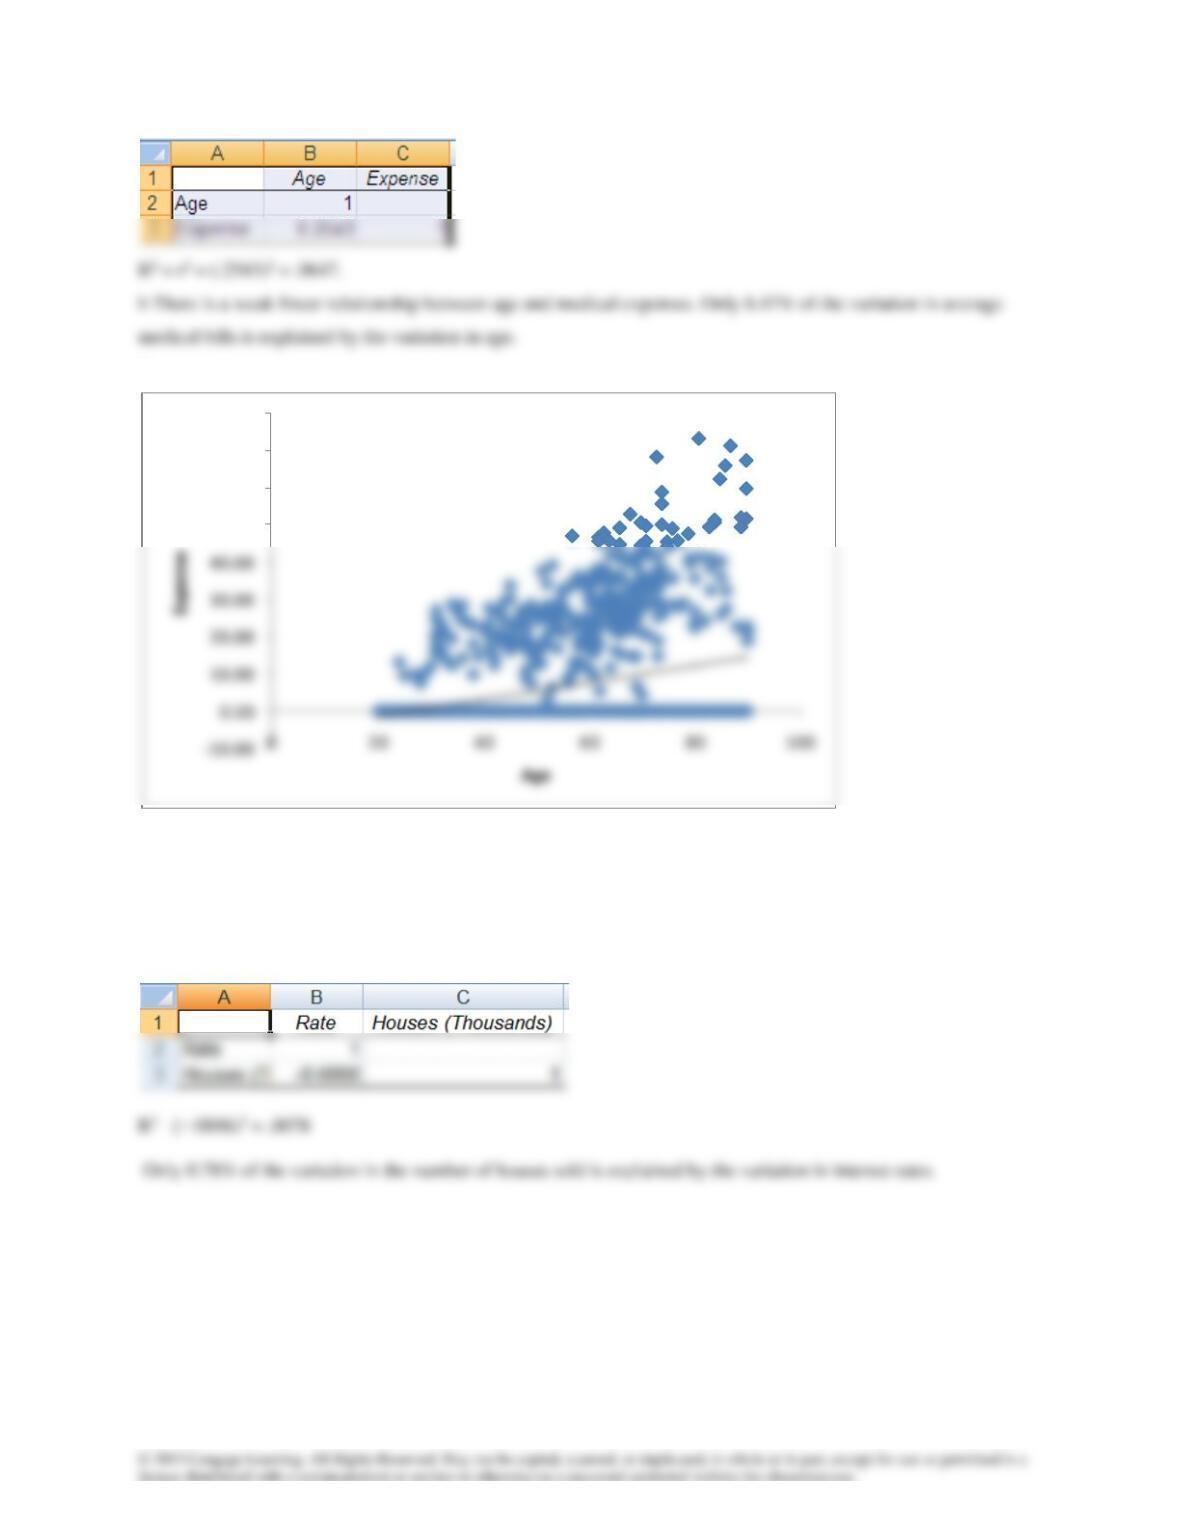
The least squares line is
x2257.966.5y
ˆ+−=
d For each additional year of age mean medical expenses increase on average by $.2257 or 23 cents.
e Charge 25 cents per day per year of age.
4.70
y = 0.2257x – 5.9662
R² = 0.0647
50.00
60.00
70.00
80.00
4.71
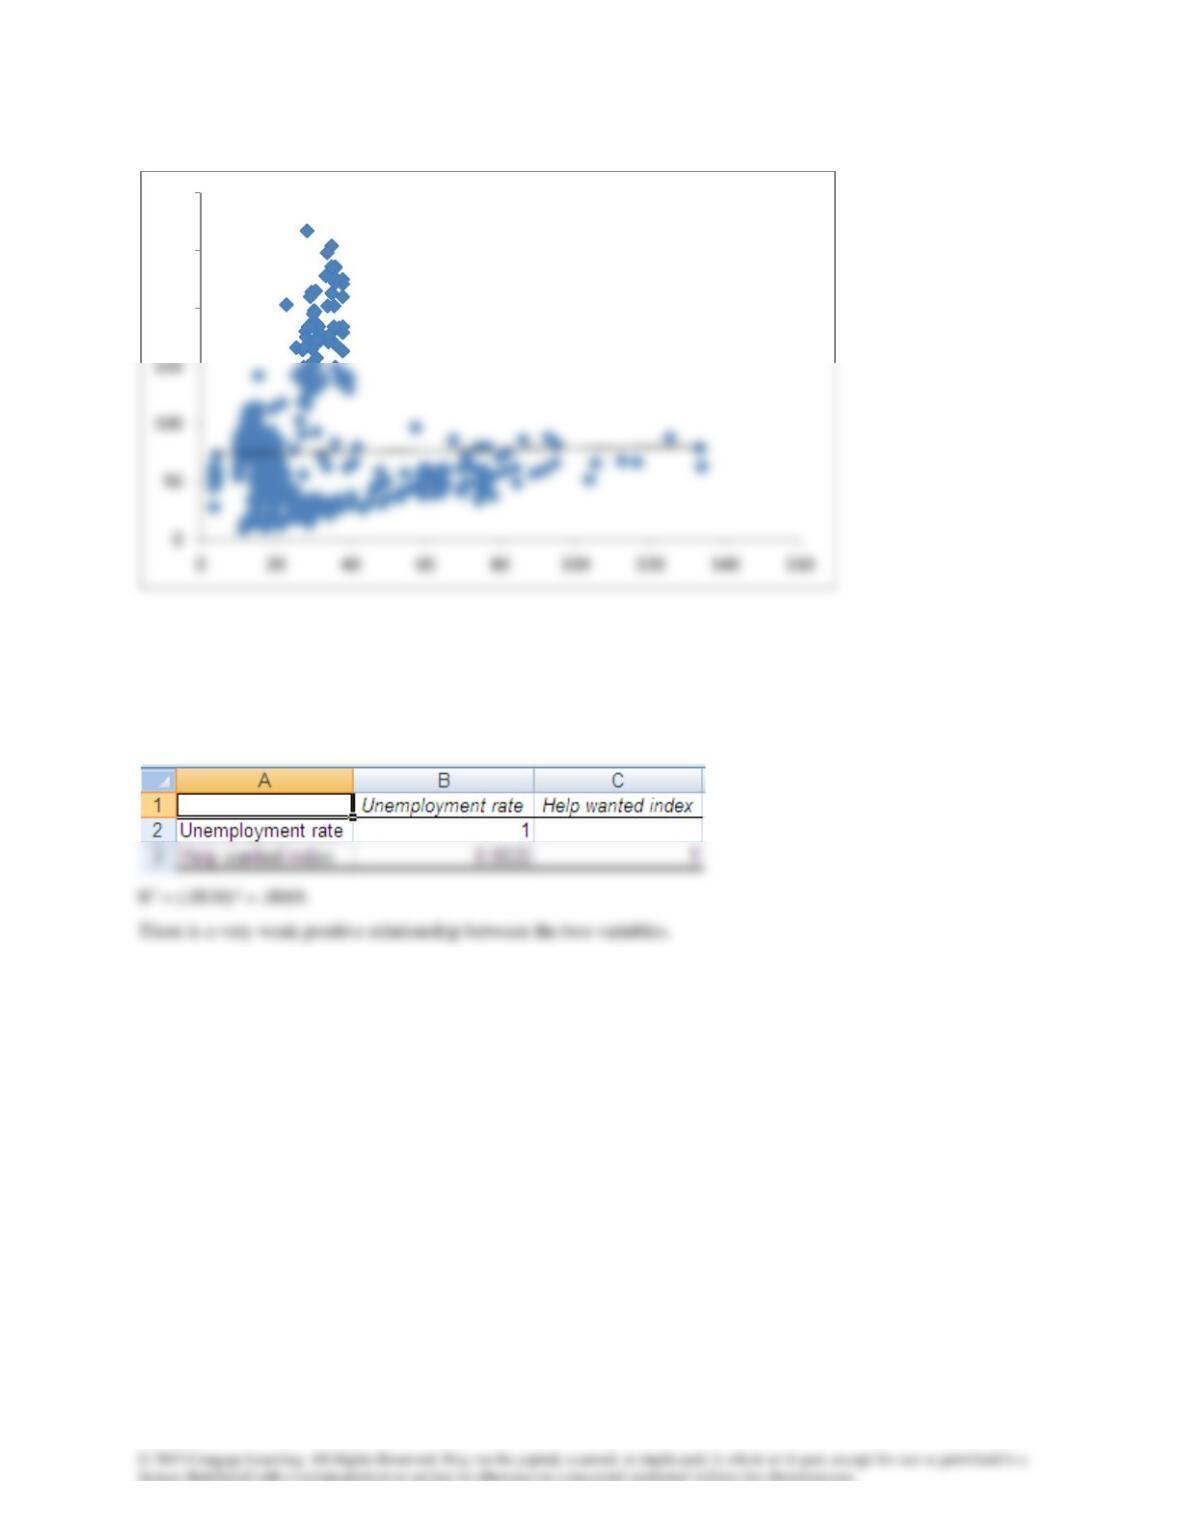
Only 0.04% of the variation in the number of wells drilled is explained by the variation in the price of oil. The
relationship is too weak to interpret the value of the slope coefficient.
4.72
y = 0.049x + 74.204
R² = 0.0004
200
250
300