CHAPTER 17: MULTIPLE REGRESSION
TRUE/FALSE
1. In multiple regression analysis, the adjusted coefficient of determination is adjusted for the number of
independent variables and the sample size.
2. Most statistical software print a second R2 statistic, called the coefficient of determination adjusted for
degrees of freedom, which has been adjusted to take into account the sample size and the number of
independent variables.
3. In reference to the equation , the value −0.80 is the y-intercept.
4. In testing the significance of a multiple regression model with three independent variables, the null
hypothesis is .
5. A multiple regression equation has a coefficient of determination of 0.81. Then, the percentage of the
variation in y that is explained by the regression equation is 90%.
6. In a multiple regression analysis involving 4 independent variables and 30 data points, the number of
degrees of freedom associated with the sum of squares for error, SSE, is 25.
7. In order to test the significance of a multiple regression model involving 4 independent variables and
25 observations, the numerator and denominator degrees of freedom for the critical value of F are 3
and 21, respectively.
8. In a multiple regression analysis involving 50 observations and 5 independent variables, the total
variation in y is 475 and SSE = 71.25. Then, the coefficient of determination is 0.85.
9. A multiple regression model involves 40 observations and 4 independent variables produces a total
variation in y of 100,000 and SSR = 80,400. Then, the value of MSE is 560.
10. In reference to the equation , the value 0.12 is the average change in y per
unit change in x1, when x2 is held constant.
11. In reference to the equation , the value 0.60 is the average change in y per
unit change in x2, regardless of the value of x1.
12. In multiple regression, the standard error of estimate is defined by , where n is the
sample size and k is the number of independent variables.
13. In regression analysis, the total variation in the dependent variable y, measured by , can be
decomposed into two parts: the explained variation, measured by SSR, and the unexplained variation,
measured by SSE.
14. A small value of F indicates that most of the variation in y is explained by the regression equation and
that the model is useful.
15. When an additional explanatory variable is introduced into a multiple regression model, coefficient of
determination adjusted for degrees of freedom can never decrease.
16. In multiple regression analysis, when the response surface (the graphical depiction of the regression
equation) hits every single point, the sum of squares for error SSE = 0, the standard error of estimate s
= 0, and the coefficient of determination R2 = 1.
17. A multiple regression model is assessed to be good if the error sum of squares SSE and the standard
error of estimate s
are both small, the coefficient of determination R2 is close to 1, and the value of the
test statistic F is large.
18. The coefficient of determination R2 measures the proportion of variation in y that is explained by the
explanatory variables included in the model.
19. When an additional explanatory variable is introduced into a multiple regression model, the coefficient
of determination will never decrease.
20. A multiple regression is called “multiple” because it has several explanatory variables.
21. When an explanatory variable is dropped from a multiple regression model, the coefficient of
determination can increase.
22. When an explanatory variable is dropped from a multiple regression model, the adjusted coefficient of
determination can increase.
23. From the coefficient of determination, we cannot detect the strength of the relationship between the
dependent variable y and any individual independent variable.
24. The total variation in y in a regression model will never exceed the regression sum of squares (SSR).
25. A high value of the coefficient of determination significantly above 0 in multiple regression,
accompanied by insignificant t-statistics on all parameter estimates, very often indicates a high
correlation between independent variables in the model.
26. A multiple regression model is assessed to be poor if the error sum of squares SSE and the standard
error of estimate s
are both large, the coefficient of determination R2 is close to 0, and the value of the
test statistic F is large.
27. In calculating the standard error of the estimate, , there are (n − k − 1) degrees of
freedom, where n is the sample size and k is the number of independent variables in the model.
28. A multiple regression model has the form . The coefficient b1 is interpreted as the
average change in y per unit change in x1.
MULTIPLE CHOICE
1. The adjusted coefficient of determination is adjusted for the:
a.
number of independent variables and the sample size.
b.
number of dependent variables and the sample size.
c.
coefficient of correlation and the significance level.
d.
number of regression parameters including the y-intercept.
2. In a multiple regression analysis, if the model provides a poor fit, this indicates that:
a.
the coefficient of determination will be close to zero.
b.
the standard error of estimate will be large.
c.
the sum of squares for error will be large.
d.
All of these choices are true.
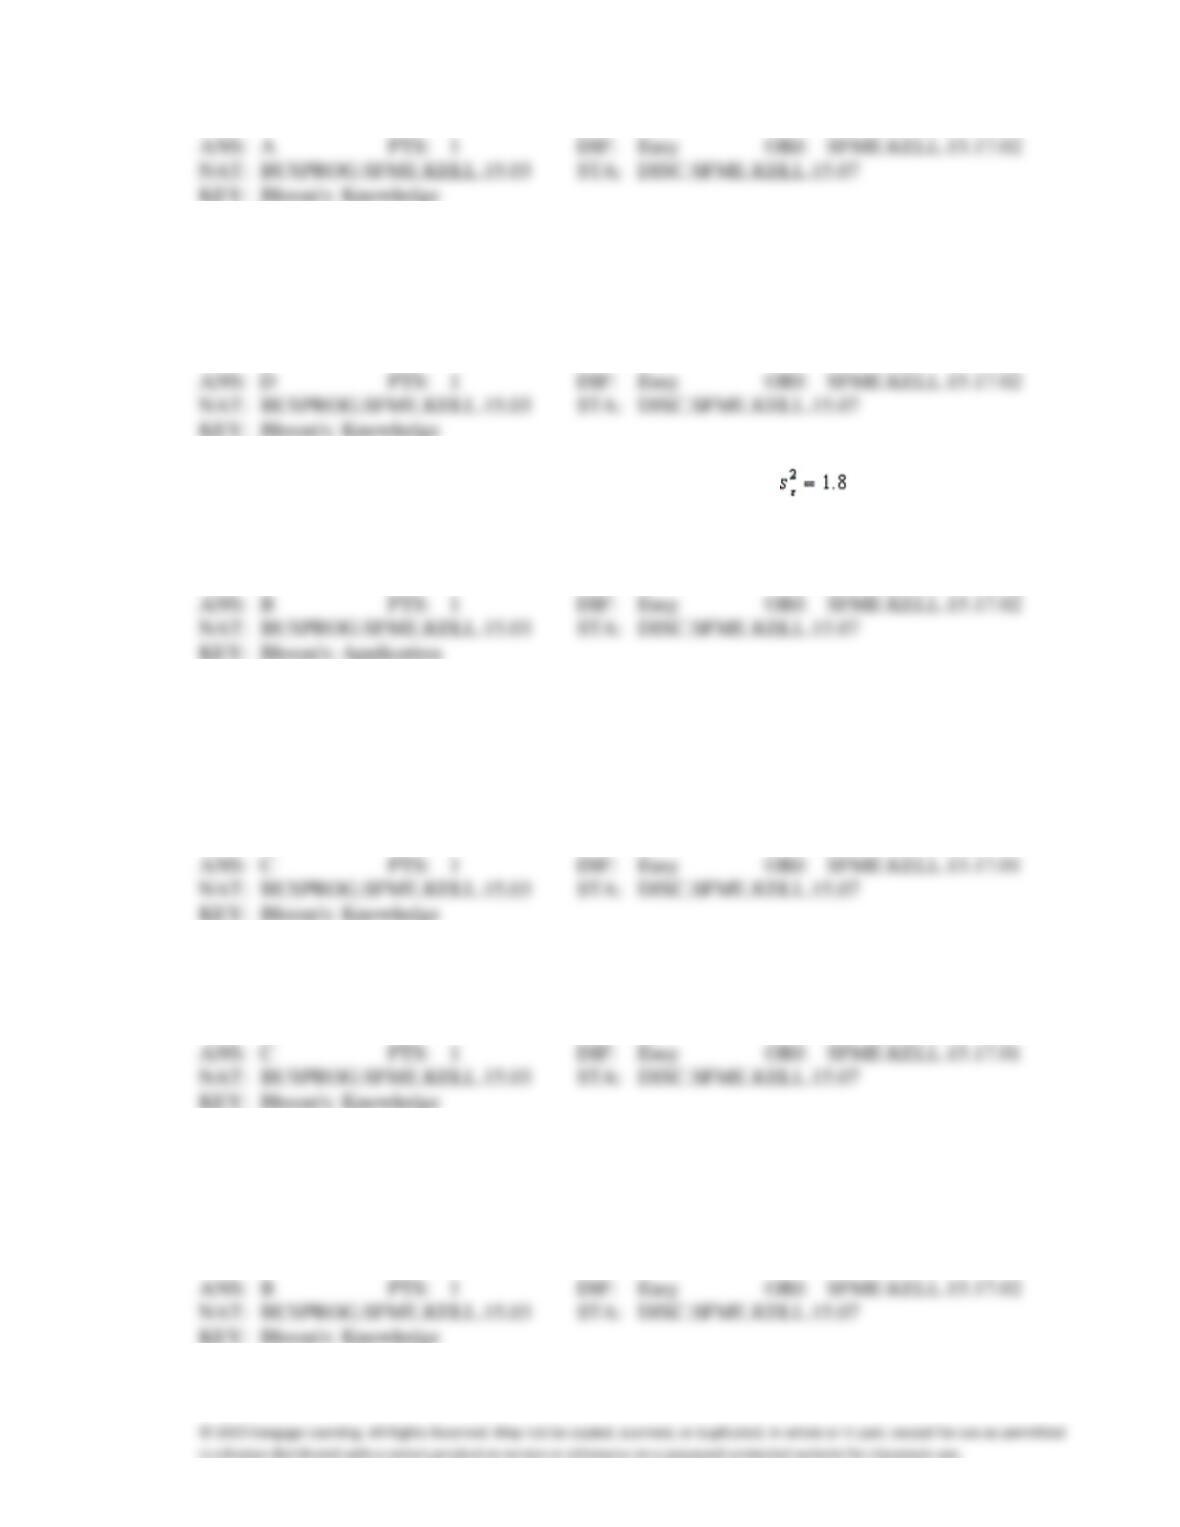
3. Suppose a multiple regression analysis involving 25 data points has and SSE = 36. Then, the
number of the independent variables must be:
a.
3
c.
5
b.
4
d.
6
4. In a multiple regression model, the mean of the probability distribution of the error variable
is
assumed to be:
a.
k, where k is the number of independent variables included in the model.
b.
1.0
c.
0.0
d.
None of these choices.
5. In a multiple regression model, the standard deviation of the error variable
is assumed to be:
a.
0.
c.
constant.
b.
1.0.
d.
None of these choices.
6. In multiple regression analysis, the ratio MSR/MSE yields the:
a.
t-test statistic for testing each individual regression coefficient.
b.
F-test statistic for testing the validity of the regression equation.
c.
coefficient of determination.
d.
adjusted coefficient of determination.
7. In a multiple regression analysis involving 6 independent variables, the total variation in y is 900 and
SSR = 600. What is the value of SSE?
a.
300
c.
0.67
b.
1.50
d.
None of these choices.
8. In a multiple regression analysis involving k independent variables and n data points, the number of
degrees of freedom associated with the sum of squares for error is:
a.
k − 1
c.
n − 1
b.
n − k
d.
n − k − 1
9. In order to test the validity of a multiple regression model involving 5 independent variables and 30
observations, the numerator and denominator degrees of freedom for the critical value of F are,
respectively,
a.
5 and 30
c.
5 and 24
b.
6 and 29
d.
6 and 25
10. A multiple regression model involves 5 independent variables and a sample of 10 data points. If we
want to test the validity of the model at the 5% significance level, the critical value is:
a.
6.26
c.
9.36
b.
3.33
d.
4.24
11. A multiple regression model involves 10 independent variables and 30 observations. If we want to test
at the 5% significance level whether one of the coefficients is = 0 (vs. 0) the critical value will be:
a.
2.228
c.
1.729
b.
2.093
d.
1.697
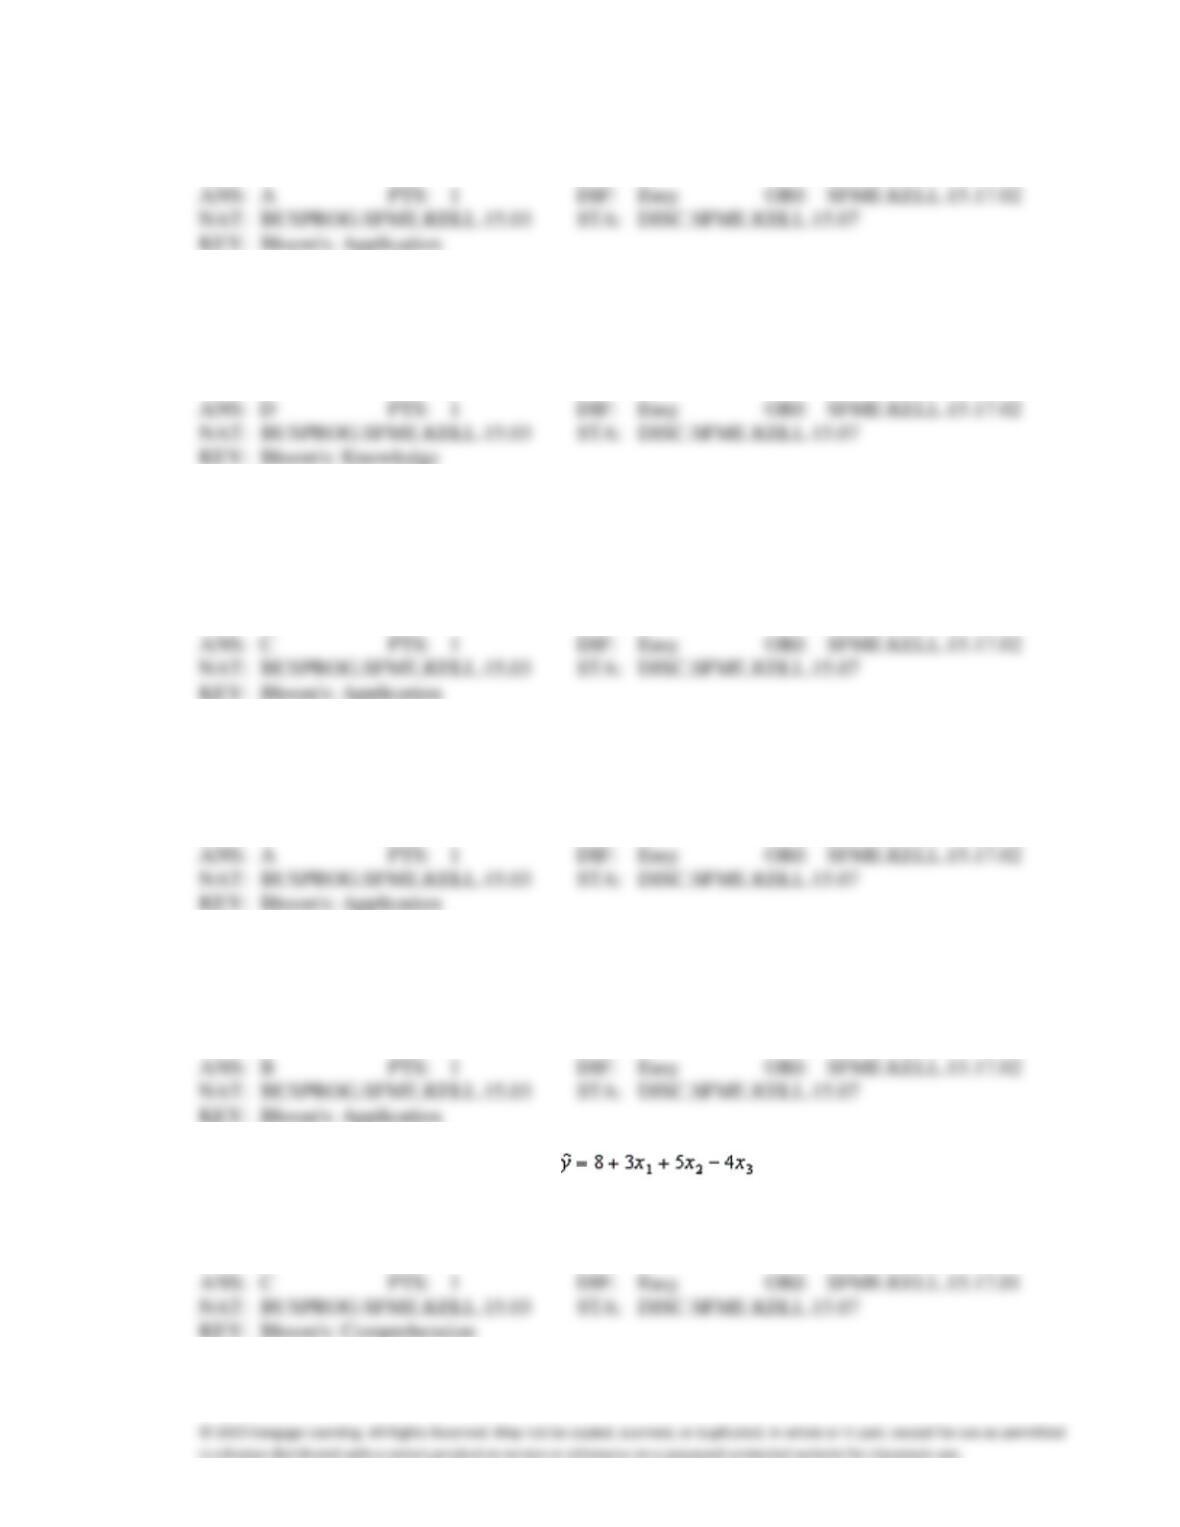
12. A multiple regression model has the form . As x3 increases by one unit, with x1
and x2 held constant, the y on average is expected to:
a.
increase by 1 unit.
c.
decrease by 4 units.
b.
increase by 12 units.
d.
decrease by 16 units.
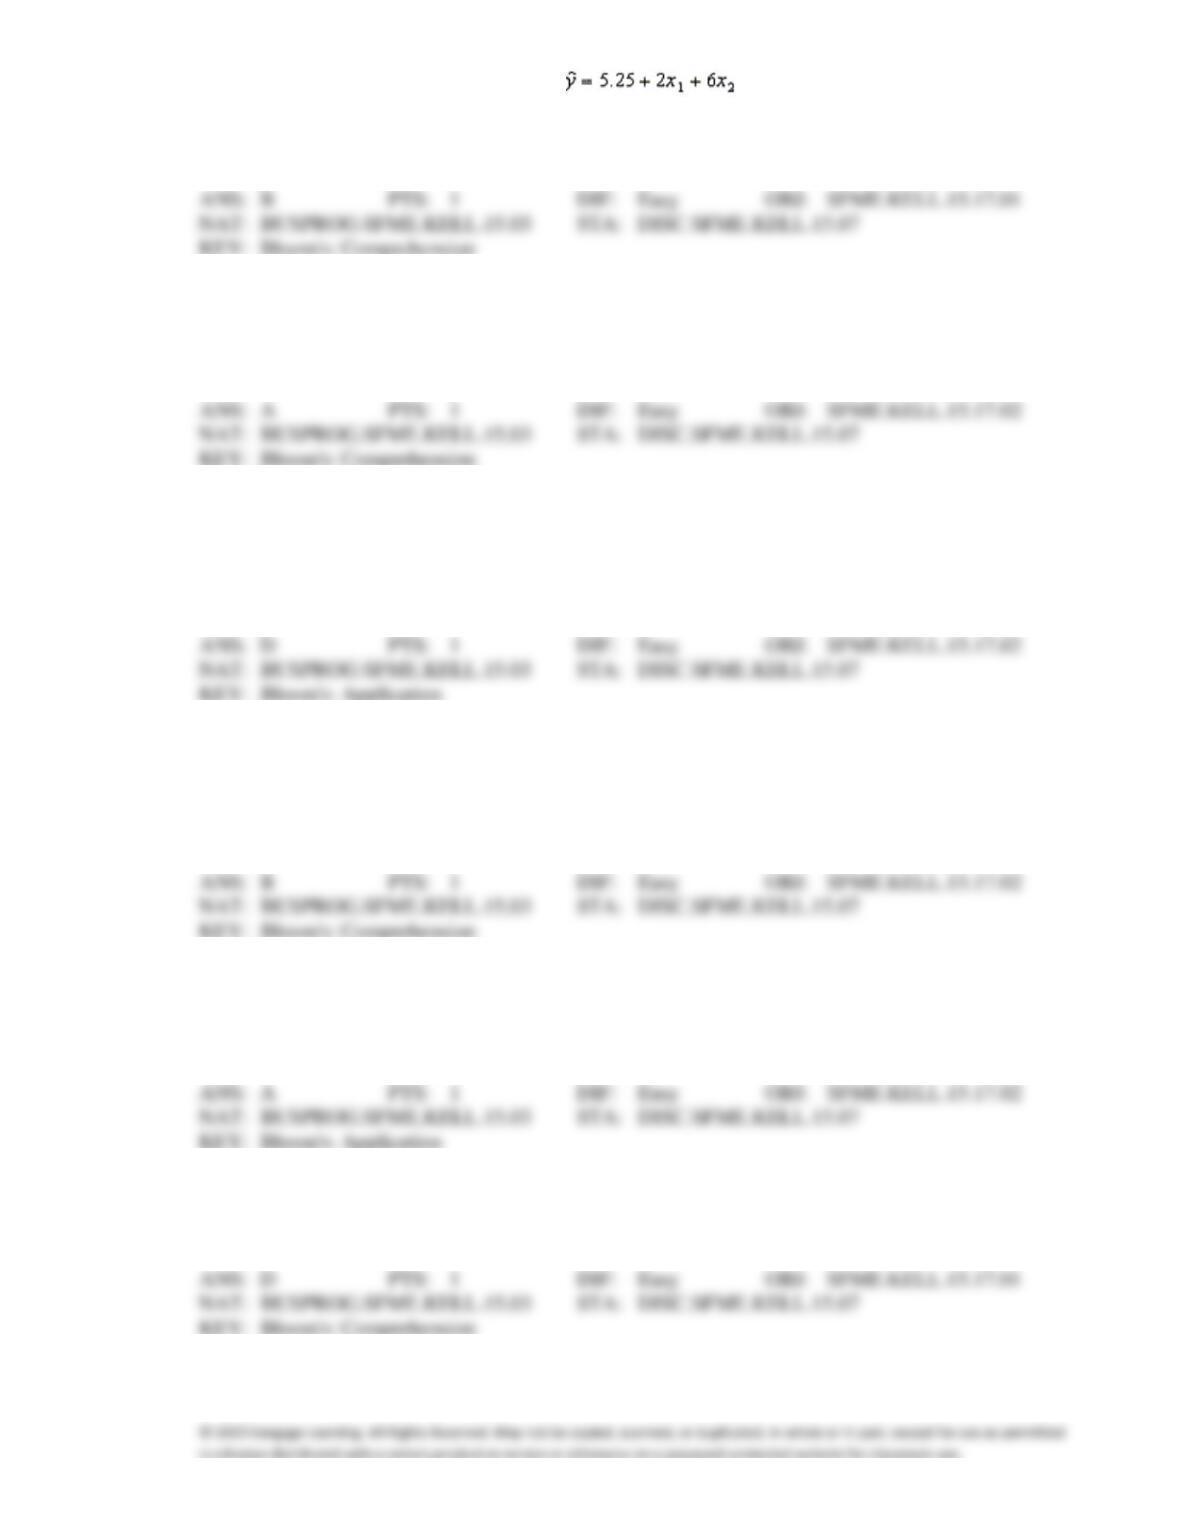
13. A multiple regression model has the form: . As x2 increases by one unit, holding x1
constant, then the value of y will increase by:
a.
7.25 units
c.
2 units
b.
6 units on average
d.
None of these choices
14. To test the validity of a multiple regression model, we test the null hypothesis that the regression
coefficients are all zero by applying the:
a.
F-test
c.
z-test
b.
t-test
d.
None of these choices.
15. A multiple regression analysis involving three independent variables and 25 data points results in a
value of 0.769 for the unadjusted coefficient of determination. Then, the adjusted coefficient of
determination is:
a.
0.385
c.
0.591
b.
0.877
d.
0.736
16. The coefficient of determination ranges from:
a.
1.0 to .
b.
0.0 to 1.0.
c.
1.0 to k, where k is the number of independent variables in the model.
d.
1.0 to n, where n is the number of observations in the dependent variable.
17. For a multiple regression model, the following statistics are given: Total variation in y = 500, SSE =
80, and n = 25. Then, the coefficient of determination is:
a.
0.84
c.
0.3125
b.
0.16
d.
0.05
18. A multiple regression model has:
a.
only one independent variable.
c.
more than one dependent variable.
b.
only two independent variables.
d.
more than one independent variable.
19. For a multiple regression model the following statistics are given: Total variation in y = 250, SSE = 50,
k = 4, and n = 20. Then, the coefficient of determination adjusted for the degrees of freedom is:
a.
0.800
c.
0.840
b.
0.747
d.
0.775
20. If all the points for a multiple regression model with two independent variables were right on the
regression plane, then the coefficient of determination would equal:
a.
0.
b.
1.
c.
2, since there are two independent variables.
d.
None of these choices.
21. In a multiple regression model, the following statistics are given: SSE = 100, R2 = 0.995, k = 5, and n =
15. Then, the coefficient of determination adjusted for degrees of freedom is:
a.
0.992
c.
0.955
b.
0.900
d.
0.855
22. In a multiple regression model, the error variable
is assumed to have a mean of:
a.
−1.0
c.
1.0
b.
0.0
d.
None of these choices.
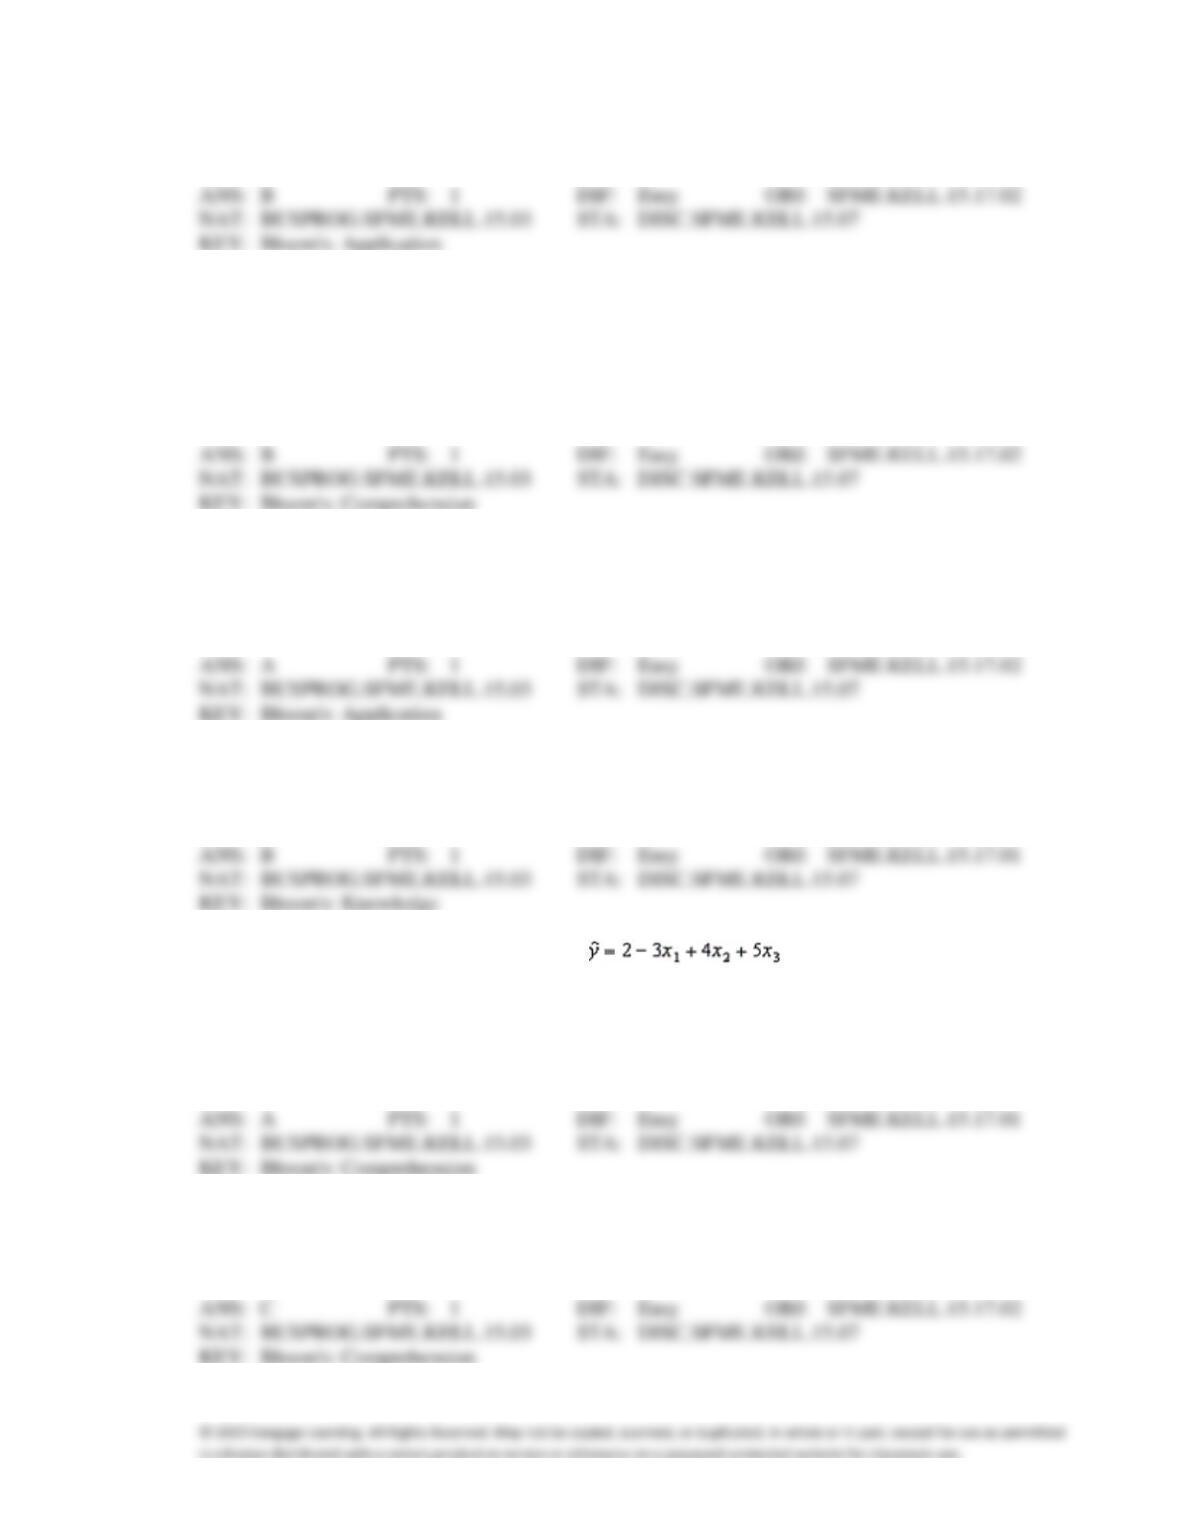
23. For the following multiple regression model: , a unit increase in x1, holding x2
and x3 constant, results in:
a.
a decrease of 3 units on average in the value of y.
b.
an increase of 8 units in the value of y.
c.
an increase of 3 units on average in the value of y.
d.
None of these choices.
24. For a multiple regression model, the total variation in y can be expressed as:
a.
SSE − SSR.
c.
SSR + SSE.
b.
SSR − SSE.
d.
SSR / SSE.
25. In a multiple regression model, the probability distribution of the error variable
is assumed to be:
a.
normal.
c.
positively skewed.
b.
non-normal.
d.
negatively skewed.
26. In a multiple regression analysis involving 40 observations and 5 independent variables, the following
statistics are given: Total variation in y = 350 and SSE = 50. Then, the coefficient of determination is:
a.
0.8408
c.
0.8469
b.
0.8571
d.
0.8529
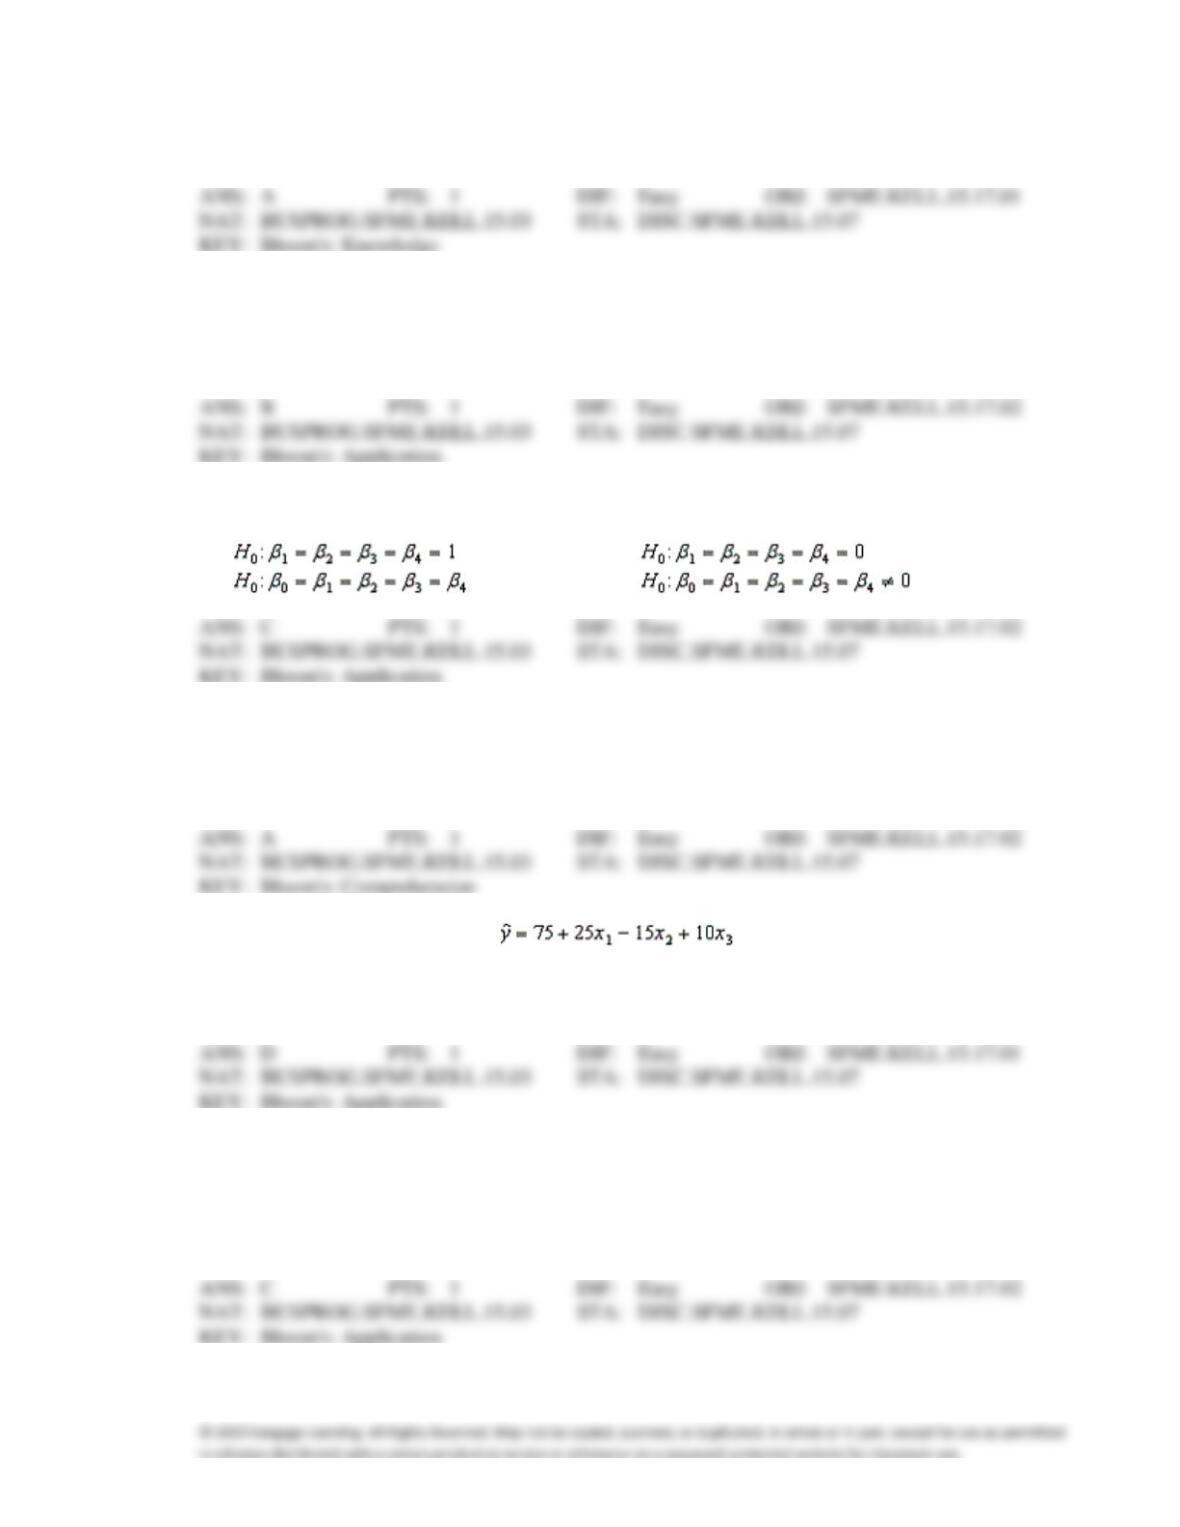
27. In testing the validity of a multiple regression model in which there are four independent variables, the
null hypothesis is:
a.
.
c.
.
b.
.
d.
.
28. A multiple regression equation includes 5 independent variables, and the coefficient of determination
is 0.81. The percentage of the variation in y that is explained by the regression equation is:
a.
81%
c.
86%
b.
90%
d.
about 16%
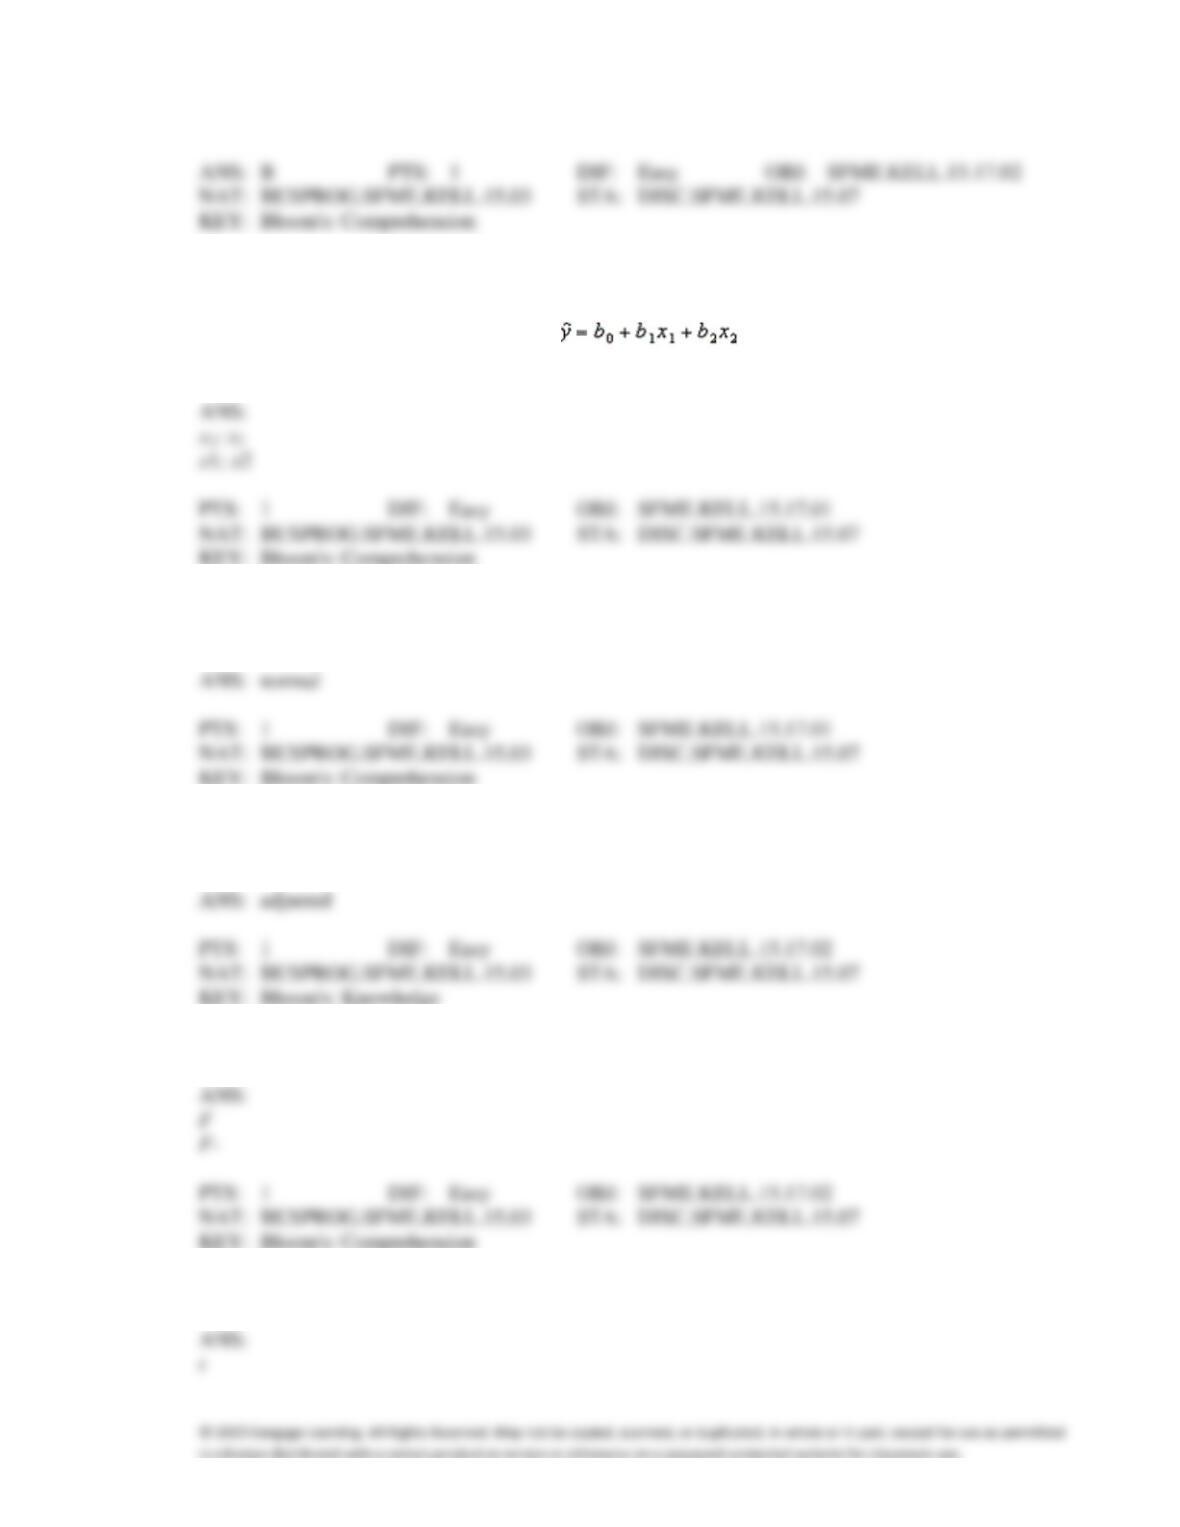
29. For the multiple regression model: , if x2 were to increase by 5, holding x1
and x3 constant, the value of y will:
a.
increase by 5.
c.
decrease on average by 5.
b.
increase by 75.
d.
decrease on average by 75.
30. In a multiple regression analysis, there are 20 data points and 4 independent variables, and the sum of
the squared differences between observed and predicted values of y is 180. The standard error of
estimate will be:
a.
9.000
c.
3.464
b.
6.708
d.
3.000
31. In a multiple regression model, the value of the coefficient of determination has to fall between
a.
−1 and +1.
c.
−1 and 0.
b.
0 and +1.
d.
None of these choices.
COMPLETION
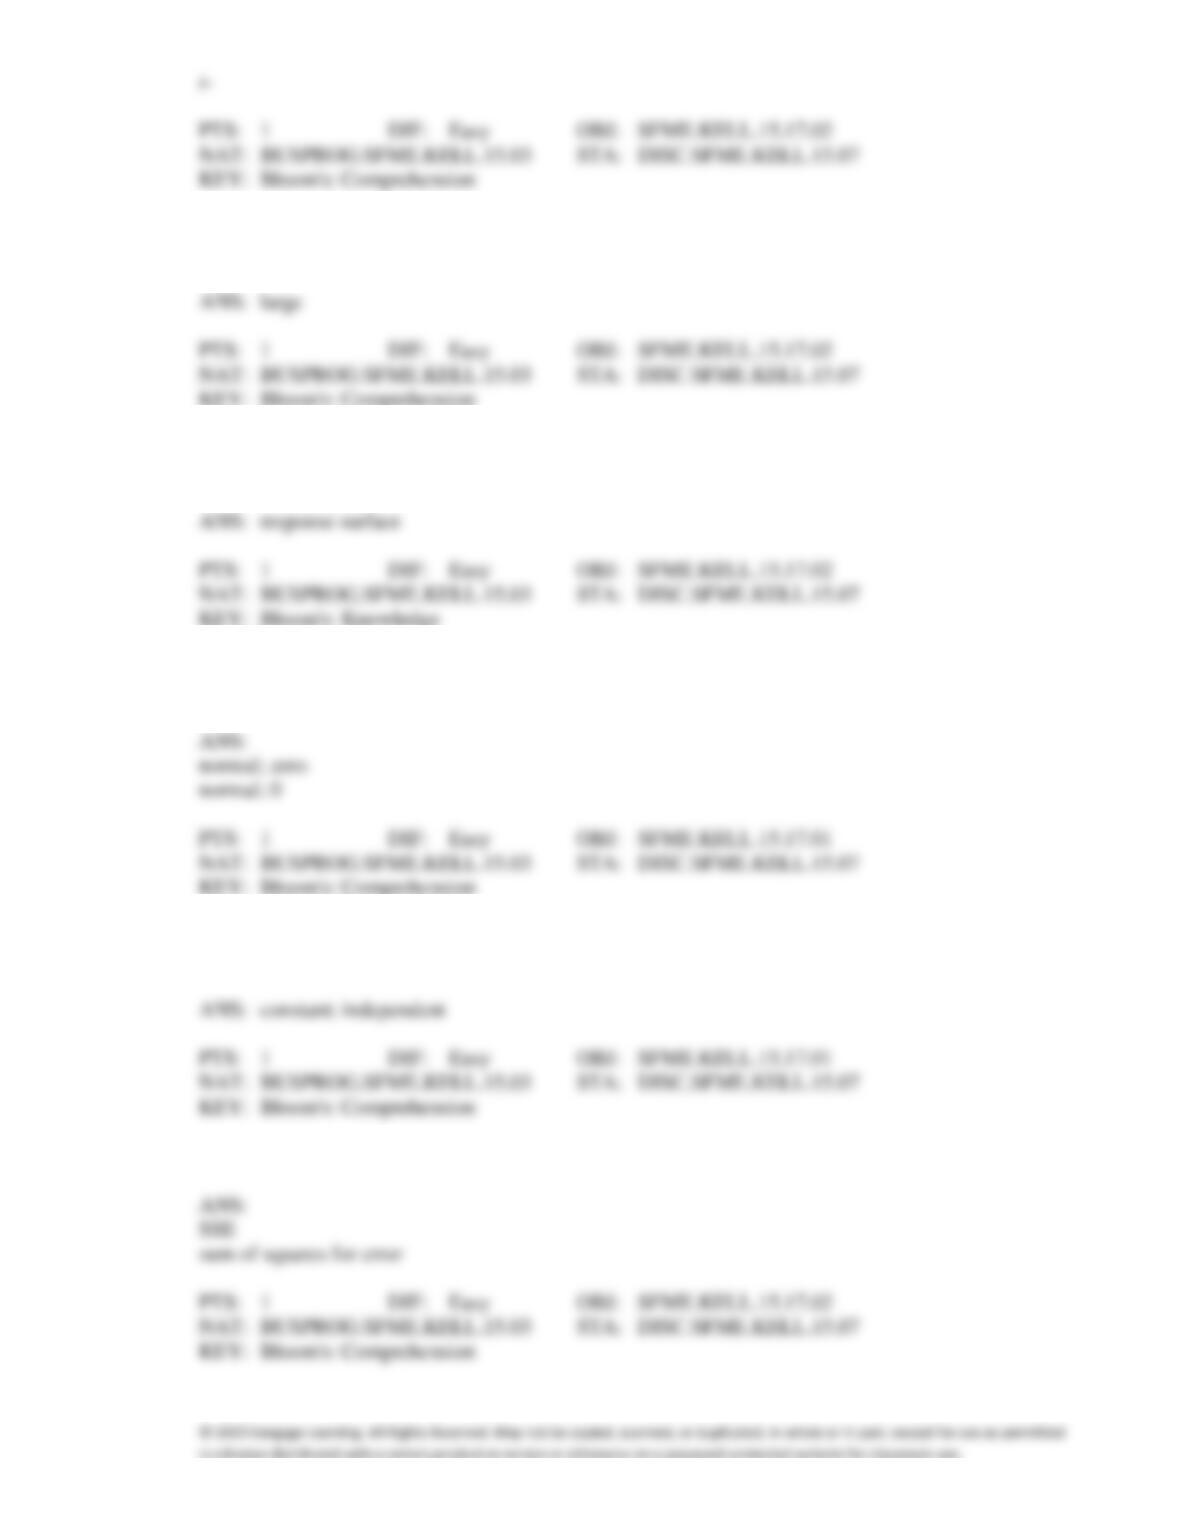
1. A multiple regression model has the form . The coefficient b1 is interpreted as the
change in the average value of y per unit change in ________ holding ________ constant.
2. Multiple regression has four requirements for the error variable. One is that the probability distribution
of the error variable is ____________________.
3. The coefficient of determination ____________________ for degrees of freedom takes into account
the sample size and the number of independent variables when assessing model fit.
4. The validity of a multiple regression model is tested using a(n) _________ test.
5. We test an individual coefficient in a multiple regression model using a(n) _________ test.
6. A(n) ____________________ value of the F-test statistic indicates that the multiple regression model
is valid.
7. When there is more than one independent variable in a regression model, we refer to the graphical
depiction of the equation as a(n) ____________________ rather than as a straight line.
8. Some of the requirements for the error variable in a multiple regression model are that the probability
distribution is ____________________ with a mean of ____________________.
9. Some of the requirements for the error variable in a multiple regression model are that the standard
deviation is a(n) ____________________ and the errors are ____________________.
10. The total variation in y is equal to SSR + ____________________.
SHORT ANSWER
1. Consider the following statistics of a multiple regression model: Total variation in y = 1000, SSE =
300, n = 50, and k = 4.
a.
Determine the standard error of estimate.
b.
Determine the coefficient of determination.
c.
Determine the F-statistic.
b.
c.
2. Consider the following statistics of a multiple regression model: n = 25, k = 5, b1 = −6.31, and s
=
2.98. Can we conclude at the 1% significance level that x1 and y are linearly related?
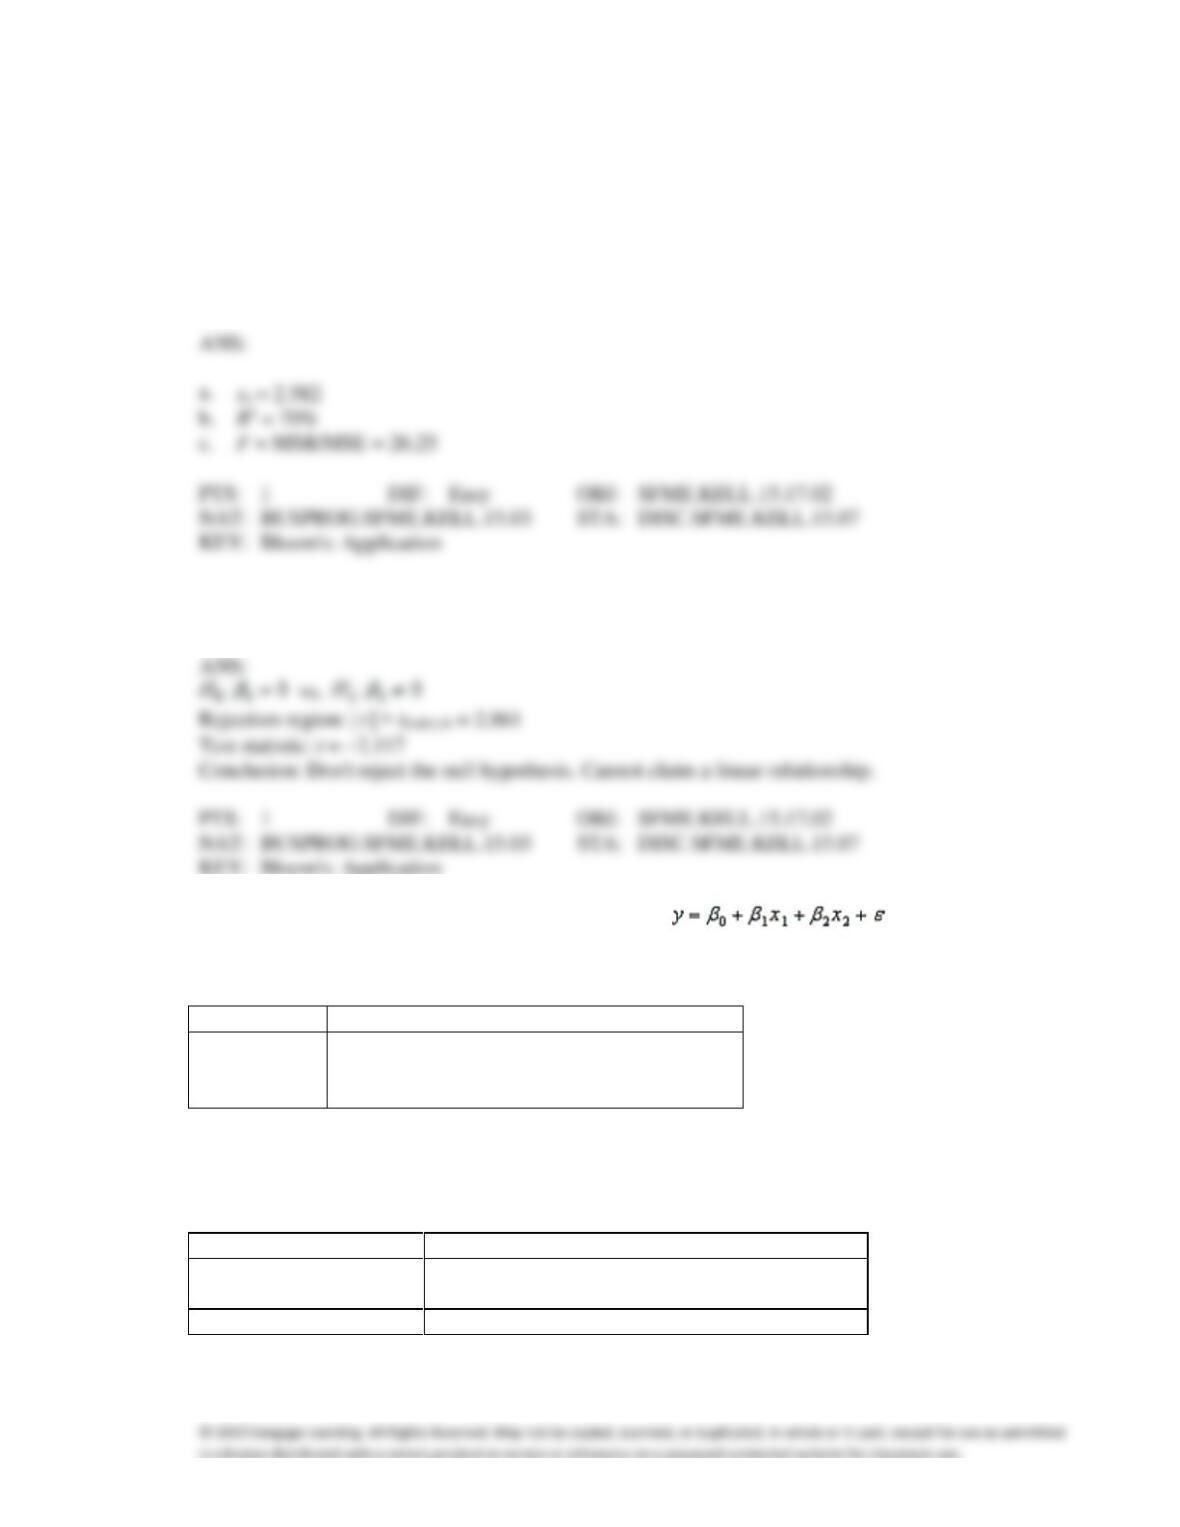
3. The computer output for the multiple regression model is shown below.
However, because of a printer malfunction some of the results are not shown. These are indicated by
the boldface letters a to i. Fill in the missing results (up to three decimal places).
Predictor
Coef
StDev
T
Constant
a
6.15
4.11
x1
3.51
b
1.25
x2
−0.71
0.30
c
S = d
R−Sq = e
ANALYSIS OF VARIANCE
Source of Variation
df
SS
MS
F
Regression
2
412
g
i
Error
37
f
h
Total
39
974
ANS:
Life Expectancy
An actuary wanted to develop a model to predict how long individuals will live. After consulting a
number of physicians, she collected the age at death (y), the average number of hours of exercise per
week (x1), the cholesterol level (x2), and the number of points that the individual’s blood pressure
exceeded the recommended value (x3). A random sample of 40 individuals was selected. The computer
output of the multiple regression model is shown below.
THE REGRESSION EQUATION IS
y = 55.8 + 1.79x1 − 0.021x2 − 0.061x3
Predictor
Coef
StDev
T
Constant
55.8
11.8
4.729
x1
1.79
0.44
4.068
x2
−0.021
0.011
−1.909
x3
−0.016
0.014
−1.143
S = 9.47
R−Sq = 22.5%
ANALYSIS OF VARIANCE
Source of Variation
df
SS
MS
F
Regression
3
936
312
3.477
Error
36
3230
89.722
Total
39
4166
4. {Life Expectancy Narrative} Is there enough evidence at the 5% significance level to infer that the
model is useful in predicting length of life?
5. {Life Expectancy Narrative} Is there enough evidence at the 1% significance level to infer that the
average number of hours of exercise per week and the age at death are linearly related?
6. {Life Expectancy Narrative} Is there enough evidence at the 5% significance level to infer that the
cholesterol level and the age at death are negatively linearly related?
7. {Life Expectancy Narrative} Is there sufficient evidence at the 5% significance level to infer that the
number of points that the individual’s blood pressure exceeded the recommended value and the age at
death are negatively linearly related?
8. {Life Expectancy Narrative} What is the coefficient of determination? What does this statistic tell
you?
9. {Life Expectancy Narrative} What is the adjusted coefficient of determination in this situation? What
does this statistic tell you?
10. {Life Expectancy Narrative} Interpret the coefficient b1.
11. {Life Expectancy Narrative} Interpret the coefficient b2.
12. {Life Expectancy Narrative} Interpret the coefficient b3.
Student’s Final Grade
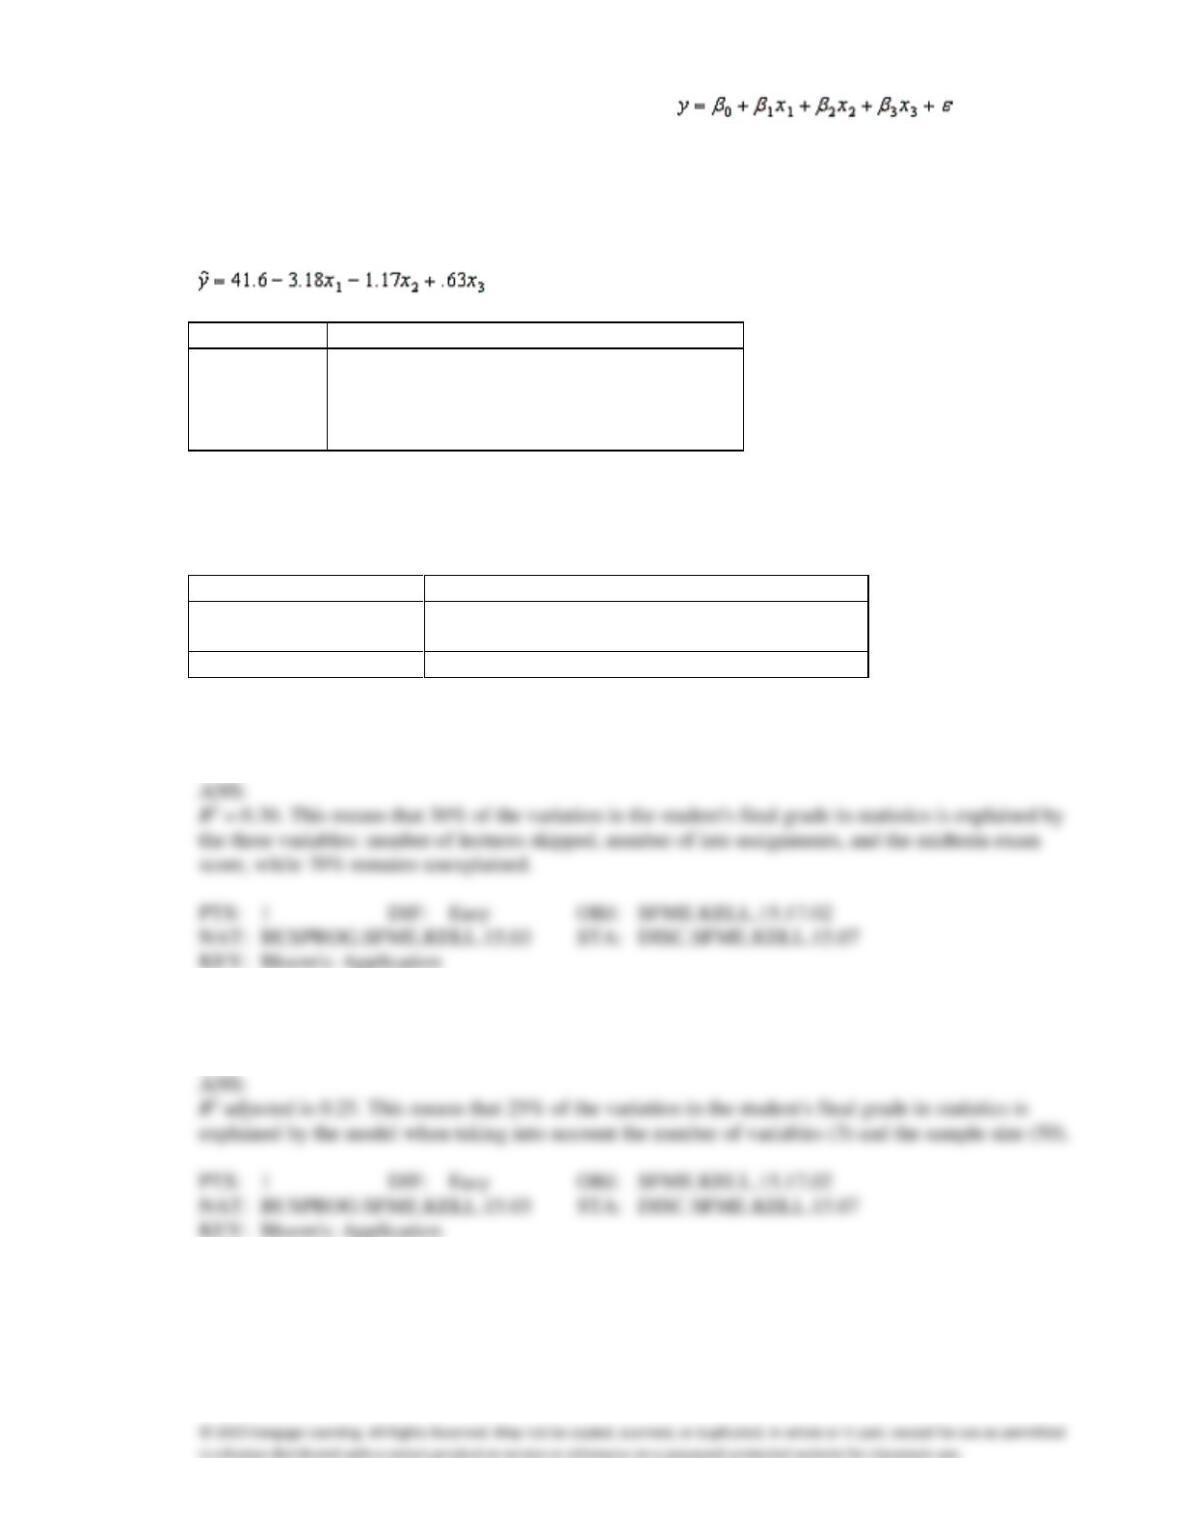
A statistics professor investigated some of the factors that affect an individual student’s final grade in
her course. She proposed the multiple regression model , where y is
the final grade (out of 100 points), x1 is the number of lectures skipped, x2 is the number of late
assignments, and x3 is the midterm exam score (out of 100). The professor recorded the data for 50
randomly selected students. The computer output is shown below.
THE REGRESSION EQUATION IS
Predictor
Coef
StDev
T
Constant
41.6
17.8
2.337
x1
−3.18
1.66
−1.916
x2
−1.17
1.13
−1.035
x3
0.63
0.13
4.846
S = 13.74
R−Sq = 30.0%
ANALYSIS OF VARIANCE
Source of Variation
df
SS
MS
F
Regression
3
3716
1238.667
6.558
Error
46
8688
188.870
Total
49
12404
13. {Student’s Final Grade Narrative} What is the coefficient of determination? What does this statistic tell
you?
14. {Student’s Final Grade Narrative} What is the adjusted coefficient of determination? What does this
statistic tell you?
15. {Student’s Final Grade Narrative} Does this data provide enough evidence to conclude at the 5%
significance level that the model is useful in predicting the final grade?
ANS:
16. {Student’s Final Grade Narrative} Does this data provide enough evidence to conclude at the 5%
significance level that the final grade and the number of skipped lectures are linearly related?
17. {Student’s Final Grade Narrative} Does this data provide enough evidence at the 5% significance level
to conclude that the final grade and the number of late assignments are negatively linearly related?
18. {Student’s Final Grade Narrative} Does this data provide enough evidence at the 1% significance level
to conclude that the final grade and the midterm exam score are positively linearly related?