46. In testing for the equality of two population variances, when the populations are normally distributed,
the 5% level of significance has been used. To determine the rejection region, it will be necessary to
refer to the F table corresponding to an upper-tail area of .05.
47. When testing the equality of two population variances the number in the null hypothesis is 0.
48. When the necessary conditions are met, a two-tail test is being conducted at
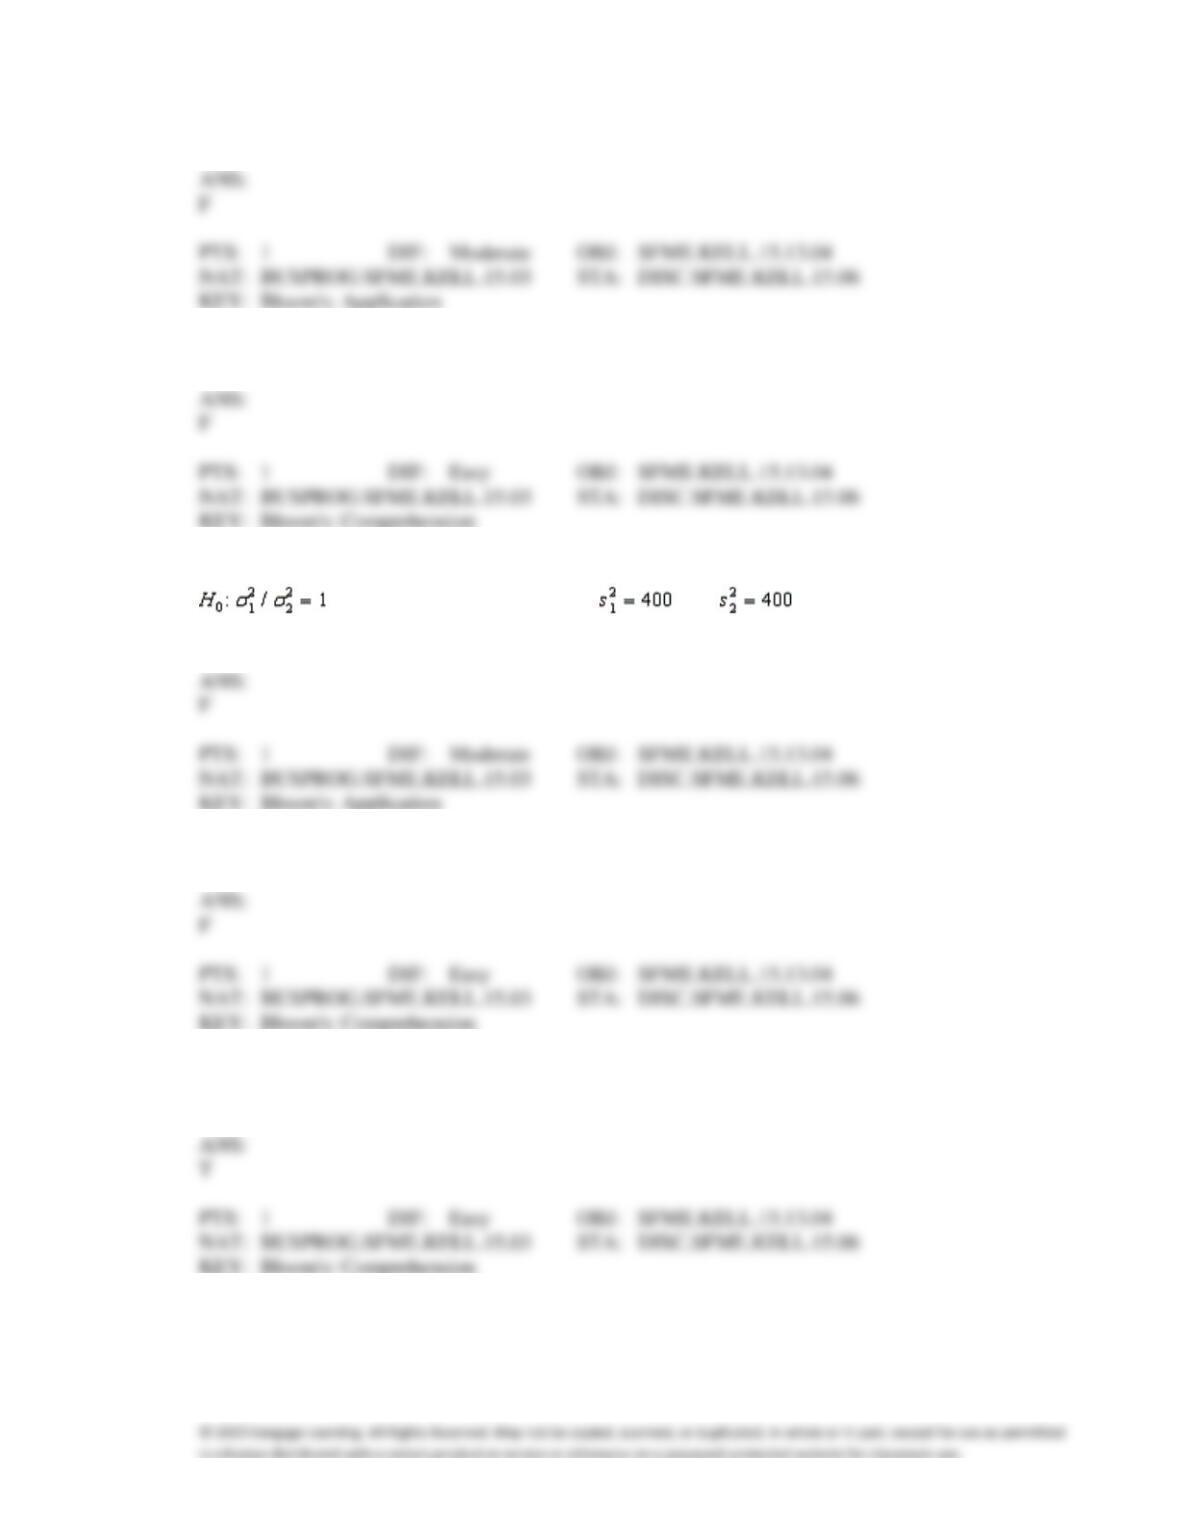
= .05 to test
. The two sample variances are and , and the sample sizes are n1 = 25
and n2 = 25. The calculated value of the test statistic will be F = 2.
49. The F-test used for testing the difference in 2 population variances is always a one-tailed test.
50. The test for the equality of two population variances assumes that each of the two populations is
normally distributed.
51. The F-distribution is symmetric.
ANS:
52. The F-distribution can only have non-negative values.
53. All F-tests for the equality of two population variances are one-tailed tests.
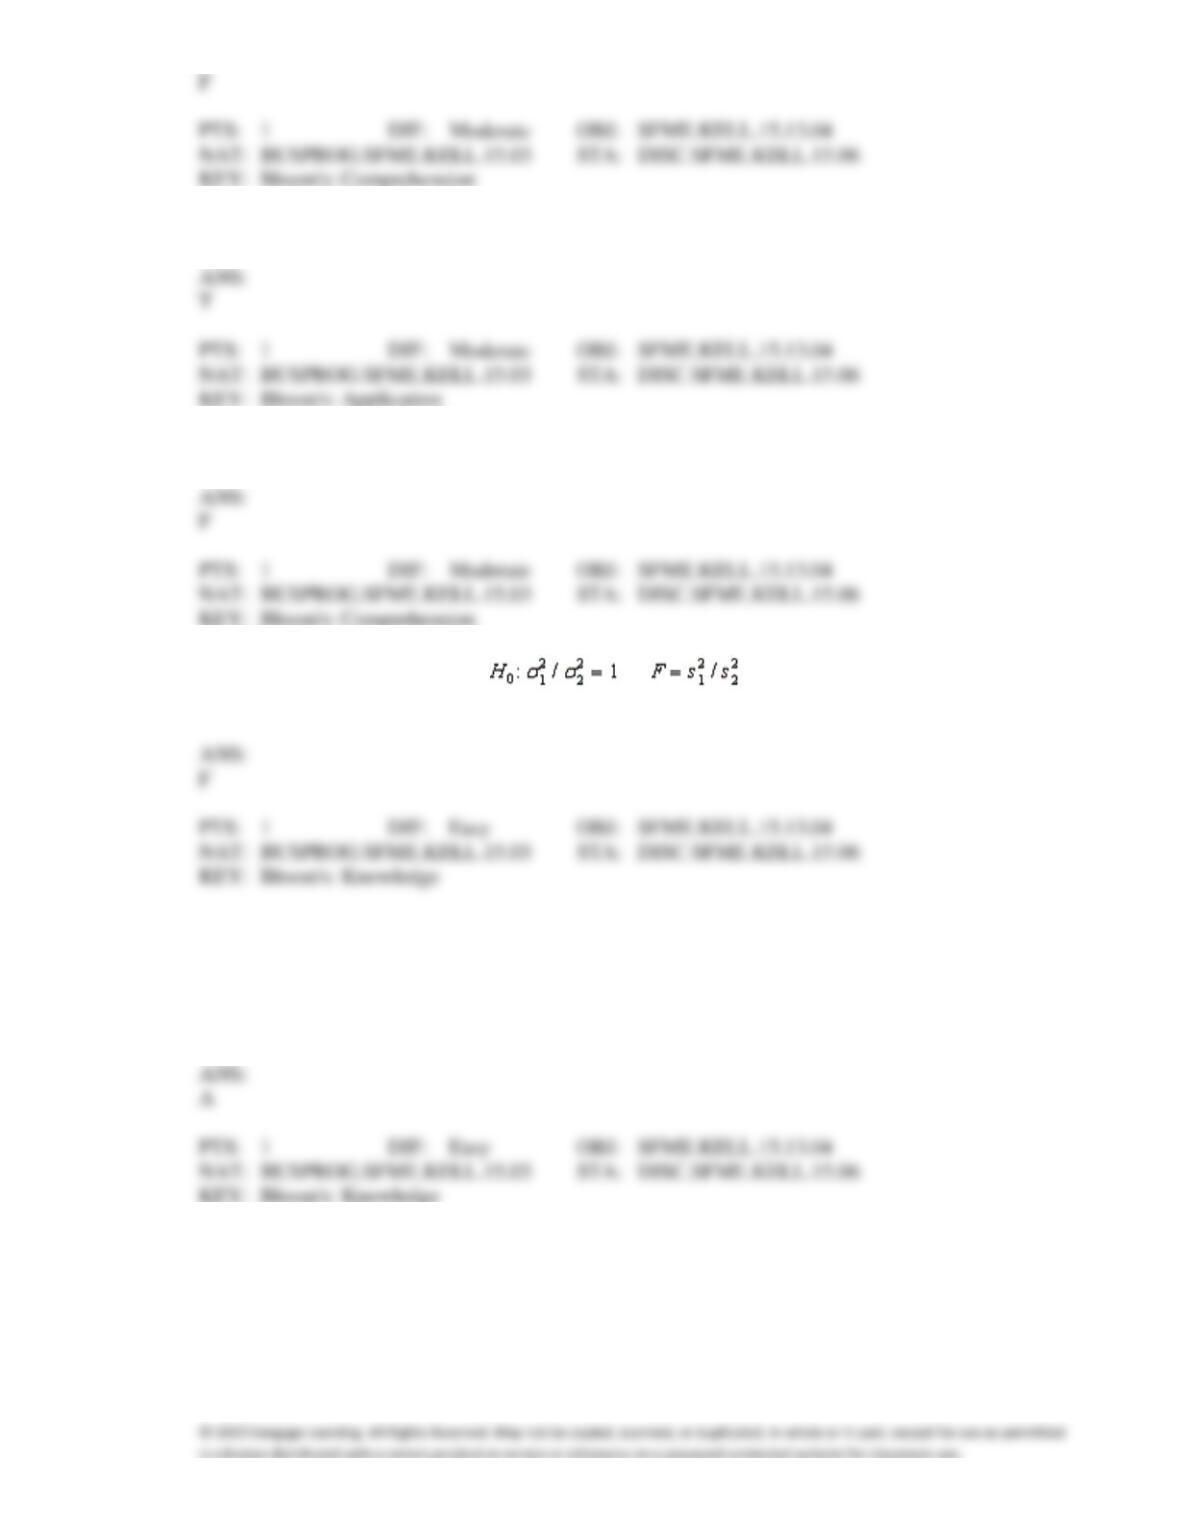
54. The test statistic employed to test is is F-distributed with v1 = n1 − 1 and v2
= n2 − 1 degrees of freedom if the two populations are F-distributed.
55. The F-distribution is the sampling distribution of the ratio of:
a.
two sample variances.
b.
two normal population means.
c.
two normal population variances.
d.
None of these choices.
56. Which of the following statements is false for an F-distribution?
a.
Variables that are F-distributed range from 0 to .
b.
The exact shape of the distribution is determined by two numbers of degrees of freedom.
c.
The degrees of freedom for the numerator can be larger than, smaller than, or equal to the
degrees of freedom for the denominator.
d.
All of these choices are true.
57. When testing for the difference between two population variances with sample sizes of n1 = 8 and n2 =
10, the degrees of freedom are:
a.
8 and 10
b.
7 and 9
c.
2 and 18
d.
18 and 2
58. Which of the following statements is correct regarding the percentile points of the F-distribution?
a.
F.05,10,20 = 1/F.95,10,20
b.
F.05,10,20 = 1/F.05,20,10
c.
F.95,10,20 = 1/F.05,20,10
d.
F.95,10,20 = 1/F.95,20,10
59. The ratio of two independent chi-squared variables divided by their degrees of freedom is:
a.
normally distributed
b.
Student t-distributed
c.
chi-squared distributed
d.
F-distributed
60. In testing for the equality of two population variances, when the populations are normally distributed,
the 10% level of significance has been used. To determine the rejection region, it will be necessary to
refer to the F table corresponding to an upper-tail area of:
a.
.90
b.
.20
c.
.10
d.
.05
61. The statistical distribution used for testing the difference between two population variances is the
a.
Student t-distribution
b.
standard normal distribution
c.
F-distribution
d.
None of these choices.
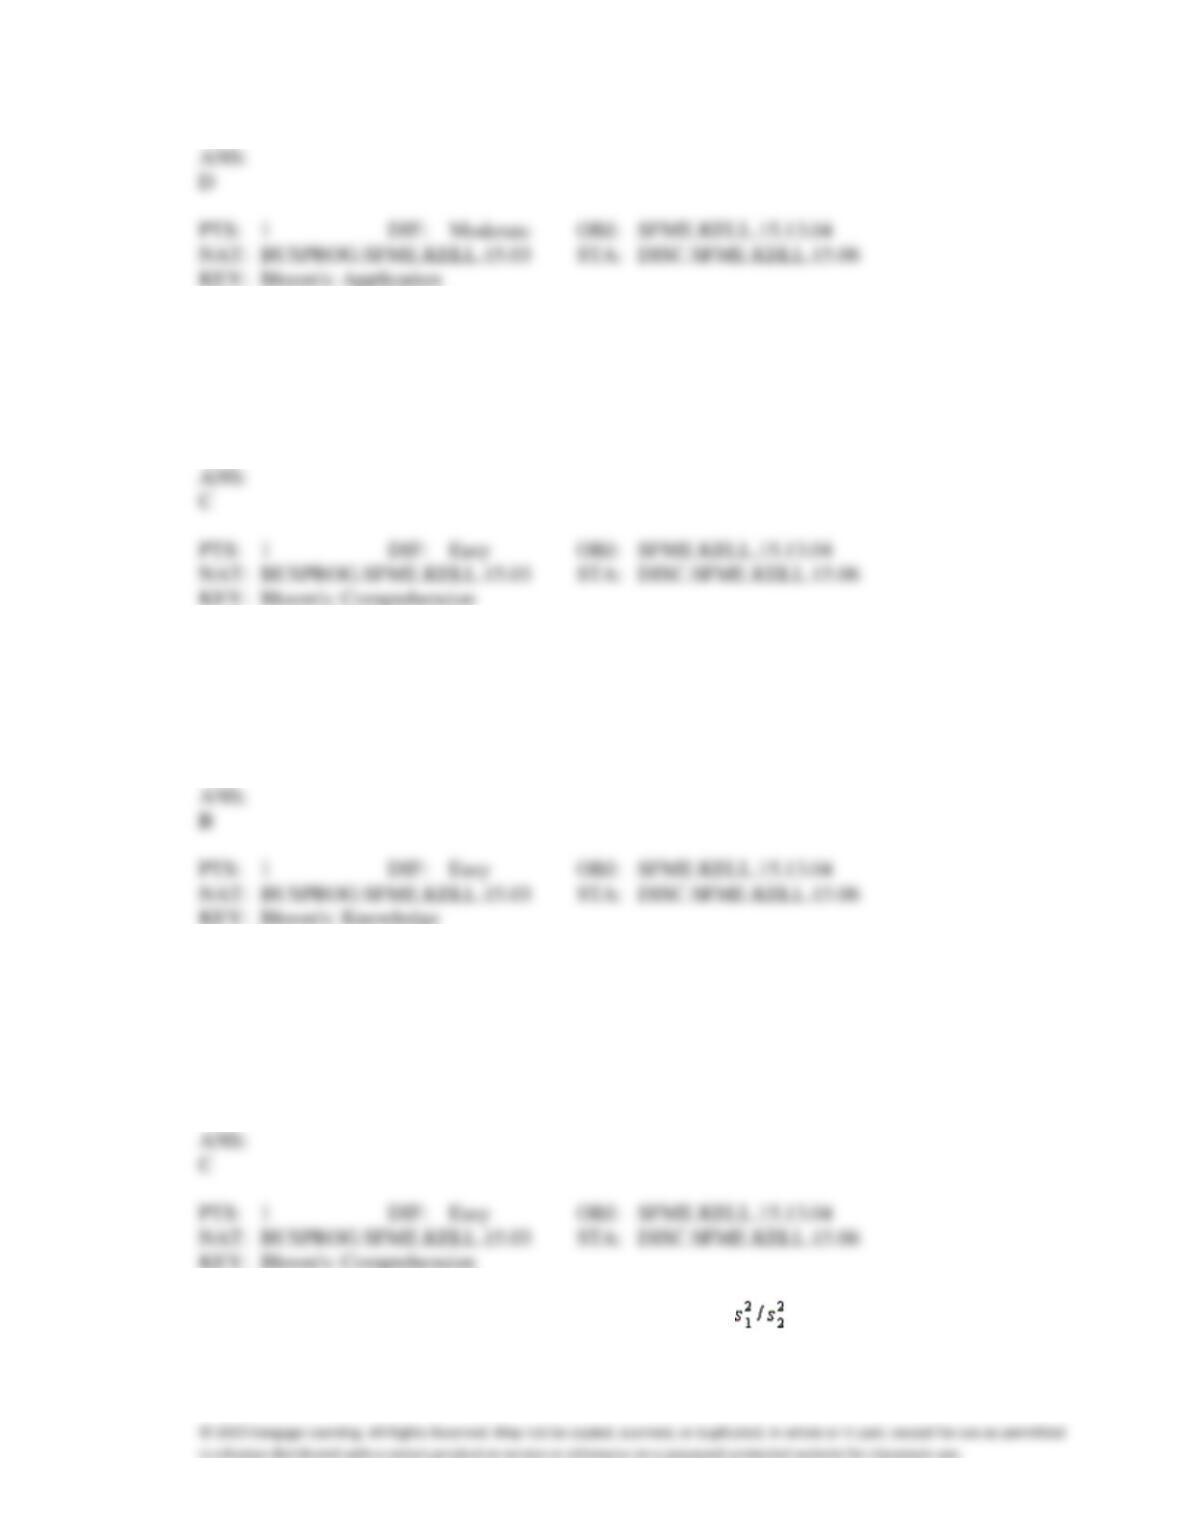
62. The test for the equality of two population variances is based on the:
a.
difference between the two sample variances.
b.
ratio of the two sample variances.
c.
sum of the two sample variances.
d.
product of the two sample variances.
63. Two independent samples are drawn from two normal populations, where the population variances are
assumed to be equal. The sampling distribution of the ratio of the two sample variances is:
a.
normal
b.
Student-t
c.
F
d.
chi-squared
64. The sampling distribution of the ratio of two sample variances is said to be F-distributed
provided that:
a.
the samples are independent from any distributions.
b.
the populations are normal with equal variances.
c.
the samples are matched and their sizes are large.
d.
the samples are independently drawn from two normal populations.
65. To estimate the ratio of the population variances you use the ____________________ of the
____________________ variances.
66. The sampling distribution of the ratio of two (independent) sample variances is said to be
____________________ distributed.
67. The sampling distribution of the ratio of two sample variances is said to be F-distributed provided that
we have two ____________________ samples drawn from their respective populations.
68. The test statistic for testing for the equality of two population variances has a(n)
____________________ distribution.
69. The test statistic for testing for the equality of two population variances has an F-distribution with
____________________ and ____________________ degrees of freedom.
70. If the F-test statistic is large, that means the variance of Population 1 is ____________________
than/to the variance of Population 2.
71. When testing for the equality of two population variances the number in the null hypothesis is
____________________.
72. We compare two population variances by examining their ____________________.
73. Random samples from two normal populations produced the following statistics: , ,
, and . Is there enough evidence at the 5% significance level to infer that the variance of
Population 1 is larger than the variance of Population 2?
Fitness Program
A statistician wants to test for the equality of means in two independent samples drawn from normal
populations of people enrolled in a fitness program. However, he will not perform the equal-variance
t-test of the difference between the population means if the condition necessary for its use is not
satisfied. The number of pound lost at the completion of the program data follow:
Sample 1
7
9
6
15
7
10
8
12
Sample 2
2
25
9
15
10
18
5
22
27
3
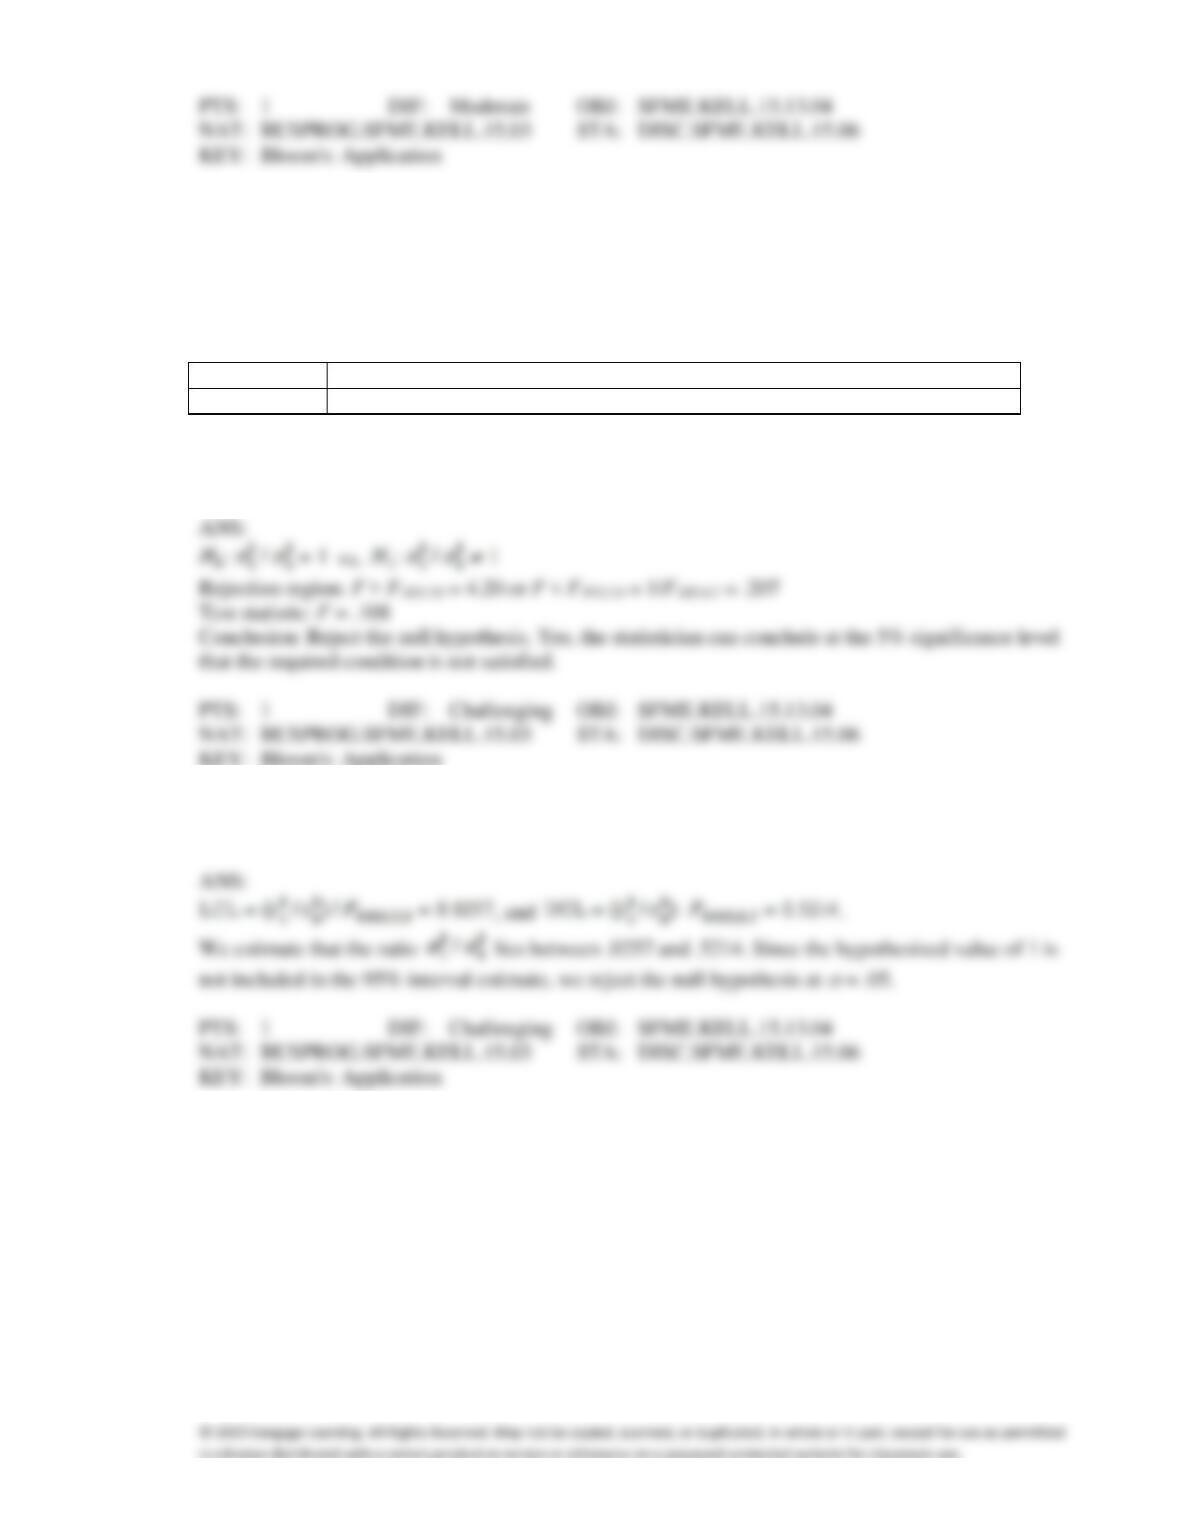
74. {Fitness Program Narrative} Can the statistician conclude at the 5% significance level that the
required condition is not satisfied?
75. {Fitness Program Narrative} Estimate with 95% confidence the ratio of the two population variances
and interpret.
Profit Margin
An investor is considering two types of investment. She is quite satisfied that the expected profit
margin on Investment 1 is higher than the expected profit margin on Investment 2. However, she is
quite concerned that the risk associated with Investment 1 is higher than that of Investment 2. To help
make her decision, she randomly selects seven monthly profit margins on investment 1 and ten
monthly profit margins on investment 2. She finds that the sample variances of Investments 1 and 2
are 225 and 118, respectively.
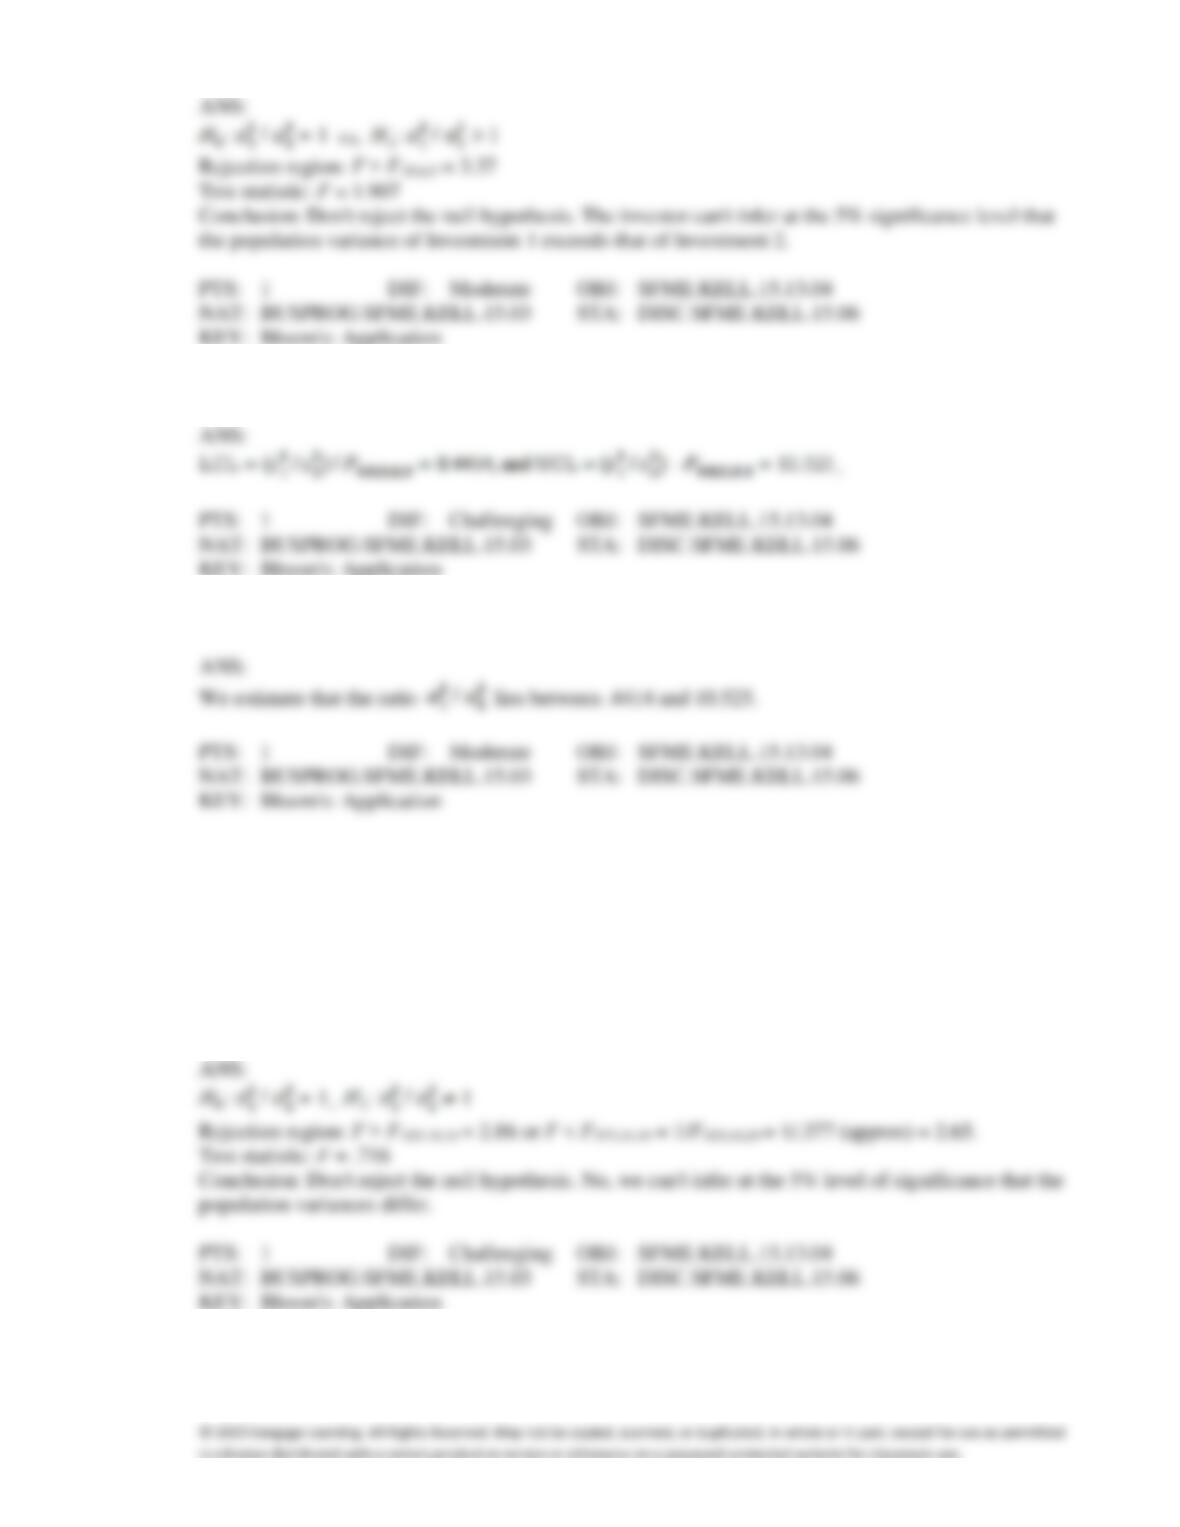
76. {Profit Margin Narrative} Can she infer at the 5% significance level that the population variance of
investment 1 exceeds that of investment 2?
77. {Profit Margin Narrative} Estimate with 95% confidence the ratio of the two population variances.
78. {Profit Margin Narrative} Briefly describe what the interval estimate tells you.
Clinic Waiting Time
In a random sample of 20 patients who visited a clinic at Medical Center 1, a researcher found that the
variance of the waiting time (in minutes) was 128.0. In a random sample of 15 patients in the clinic of
Medical Center 2, the researcher found the variance to be 178.8.
79. {Clinic Waiting Time Narrative} Can we infer at the 5% level of significance that the population
variances differ?
80. {Clinic Waiting Time Narrative} Estimate with 95% confidence the ratio of the two population
variances and interpret.
Antioxidants
A food processor wants to compare two antioxidants for their effects on retarding spoilage. Suppose
16 cuts of fresh meat are treated with antioxidant A and 16 are treated with antioxidant B, and the
number of hours until spoilage begins is recorded for each of the 32 cuts of meat. The results are
summarized in the table below
Antioxidant A
Antioxidant B
Sample Mean
108.7 hours
98.7 hours
Sample Standard Deviation
10.5 hours
13.6 hours
81. {Antioxidants Narrative} State the null and alternative hypotheses for determining if the population
variances differ for Antioxidants A and B.
82. {Antioxidants Narrative} Determine the rejection region for testing the equality of the two population
variances at
= .05.
83. {Antioxidants Narrative} Calculate the value of the test statistic for testing the equality of the
population variances, and write the proper conclusion.
84. {Antioxidants Narrative} Develop the 95% confidence interval estimate of the ratio of the two
population variances.
85. {Antioxidants Narrative} Explain how to use the 95% confidence interval for testing the equality of
the two population variances at the 5% level.
86. The pooled proportion estimate is used when the null hypothesis states that the two population
proportions differ by some non-zero number.
87. In constructing a confidence interval estimate for the difference between two population proportions,
we pool the population proportions when the populations are normally distributed.
88. The pooled proportion estimate is found by taking the proportion of successes from sample 1 plus the
proportion of successes from sample 2.
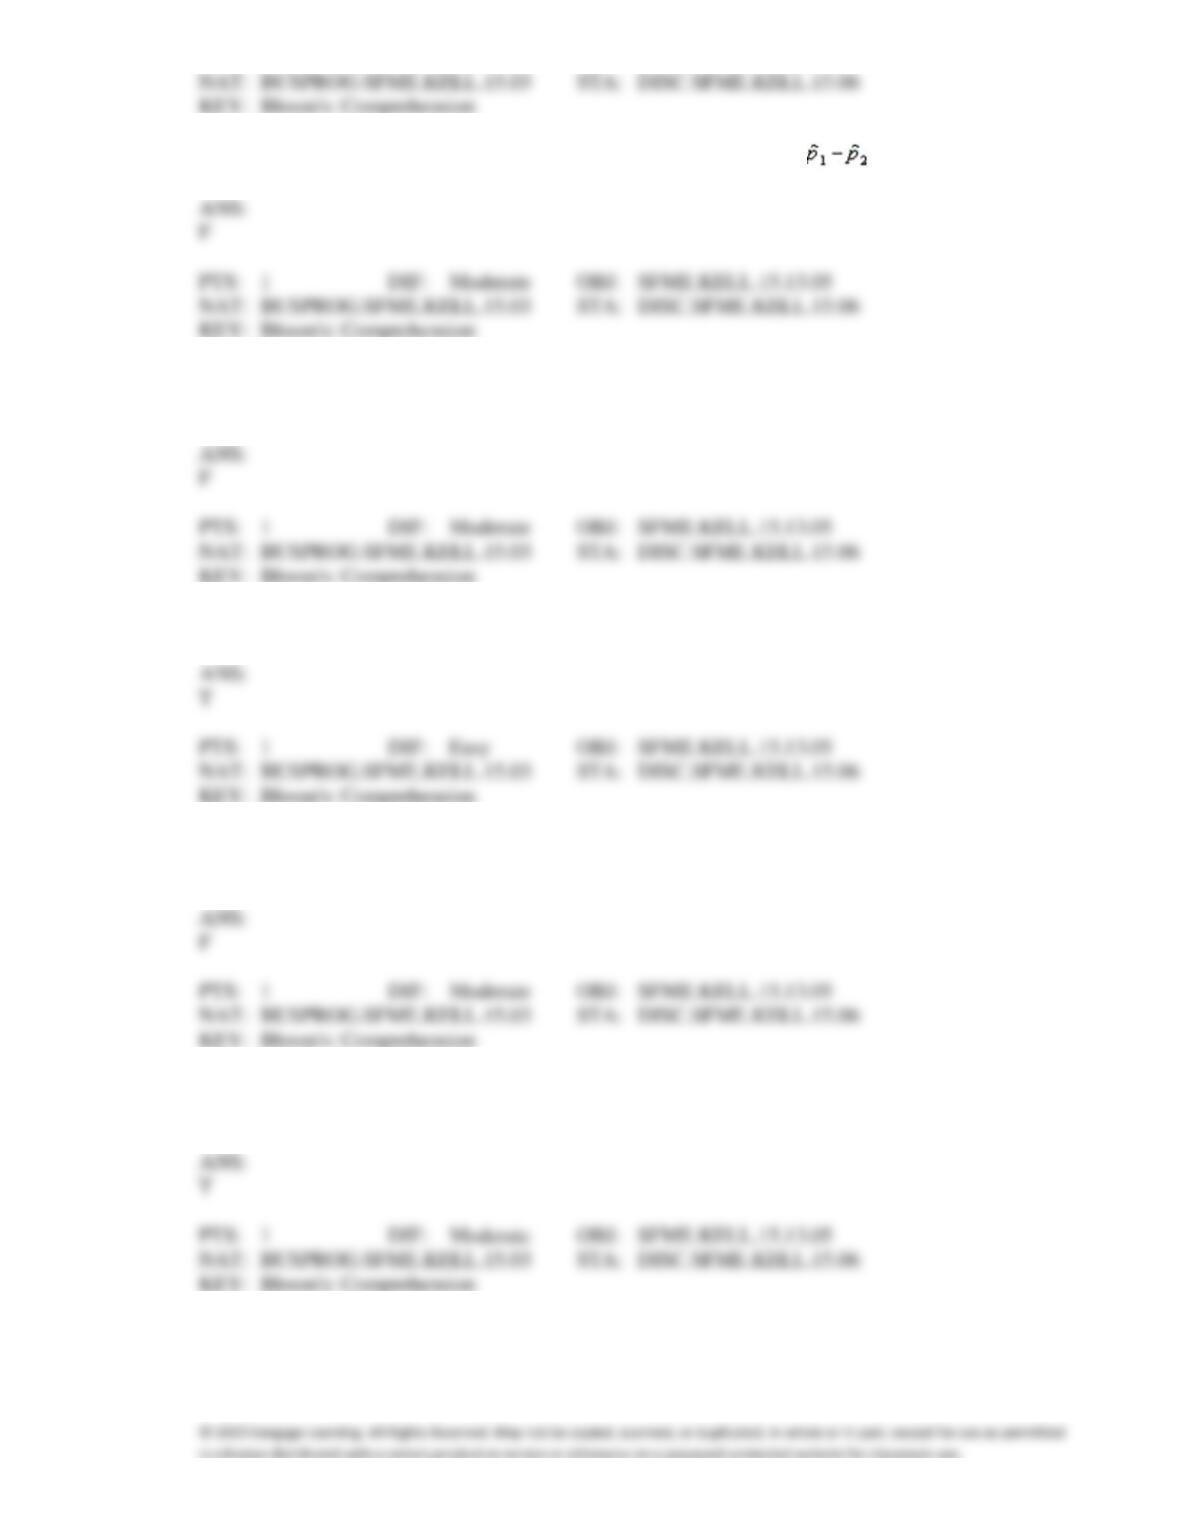
89. In comparing two population means the statistic under consideration is .
90. A required condition for using the normal approximation to the binomial in testing the difference
between two population proportions is that n1p1 30 and n2p2 30.
91. Pooling is made possible by hypothesizing (under the null hypothesis) that p1 = p2.
92. The pooled proportion estimate is used when the proportion of successes from sample 1 equals the
proportion of successes from sample 2.
93. The difference in two sample proportions is an unbiased consistent estimator of the difference in their
respective population proportions.
94. The expected value of the difference between two sample proportions is the difference between their
corresponding population proportions.
95. The variance of the difference in sample proportions equals the difference of their population
variances.
96. For testing the difference between two population proportions, the pooled proportion estimate should
be used to compute the value of the test statistic when the:
a.
populations are normally distributed.
b.
sample sizes are small.
c.
null hypothesis states that the two population proportions are equal.
d.
samples are independently drawn from the populations.
97. The pooled proportion estimate is used when:
a.
the proportion of successes from sample 1 equals the proportion of successes from sample
2.
b.
the total number of successes in both samples divided by the total of both sample sizes
equals 1.
c.
the null hypothesis states that the two population proportions differ by some non-zero
number.
d.
None of these choices.
98. For testing the difference between two population proportions, the pooled proportion estimate is found
by taking:
a.
the proportion of successes from sample 1 plus the proportion of successes from sample 2.
b.
the total number of successes in both samples divided by the total of both sample sizes.
c.
the difference between the proportion of successes in each sample.
d.
None of these choices.
99. In constructing a confidence interval estimate for the difference between two population proportions,
we:
a.
pool the population proportions when the populations are normally distributed.
b.
pool the population proportions when the population means are equal.
c.
pool the population proportions when they are equal.
d.
never pool the population proportions.
100. Which of the following is a required condition for using the normal approximation to the binomial in
testing the difference between two population proportions?
a.
b.
, , , and
c.
, , , and
d.
Choice b is the true requirement, but choice c is the one you actually check.
101. The difference in two sample proportions is a(n) ____________________ estimator of the difference
in their respective population proportions.
102. Pooling is made possible by hypothesizing (under the null hypothesis) that p1 __________ p2.
103. The pooled proportion estimate is used when the null hypothesis states that the two population
proportions differ by ____________________.
104. In constructing a confidence interval estimate for the difference between two population proportions,
we ____________________ (always/sometimes/never) pool the population proportions.
105. The variance of the difference between two sample proportions equals the ____________________ of
their population proportion variances.
106. The expected value of the difference between two sample proportions is the ____________________
of/between their corresponding population proportions.
107. If the sample sizes are large enough so the conditions are met, the difference between two sample
proportions has an approximate ____________________ distribution.
108. When the data from two populations are ____________________ the parameter to be tested and
estimated is the difference between the two population proportions.
Headache Medicine
A researcher wants to see if/how men and women differ in their reaction to a headache medicine with
respect to drowsiness. In testing the hypotheses vs. , the
following statistics were obtained: n1 = 400, x1 = 208, n2 = 250, and x2 = 115, where x1 and x2 represent
the number of patients in the two samples (men vs. women) who reported to have drowsiness as a
result of taking headache medicine.
109. {Headache Medicine Narrative} What conclusion can we draw at the 10% significance level?
110. {Headache Medicine Narrative} Estimate with 90% confidence the difference between the two
population proportions.
TV Sex
A survey of 1,500 Canadians reveals that 945 believe that there is too much sex on television. In a
survey of 1,500 Americans, 810 believe that there is too much television sex.
111. {TV Sex Narrative} Can we infer at the 99% significance level that the proportion of Canadians and
Americans who believe that there is too much sex on television differ?
112. {TV Sex Narrative} Estimate with 99% confidence the difference in the proportion of Canadians and
Americans who believe that there is too much sex on television.
113. {TV Sex Narrative} Briefly explain what the interval estimate tells you.
114. A councilwoman regularly polls her constituency to gauge her level of support among voters. This
month, 652 out of 1158 voters support her. Five months ago, 412 out of 982 voters supported her.
With a 5% significance level, can she infer that support has increased by at least 10 percentage points?
Senatorial Election
A political poll immediately prior to a senatorial election reveals that 145 out of 250 male voters and
105 out of 200 female voters intend to vote for the Democrat candidate.
115. {Senatorial Election Narrative} Can we infer at the 5% significance level that the proportions of male
and female voters who intend to vote for the Democrat candidate differ?
116. {Senatorial Election Narrative} What is the p-value of the test?
117. {Senatorial Election Narrative} Estimate with 95% confidence the difference in the proportion of male
and female voters who intend to vote for the Democrat candidate.
118. {Senatorial Election Narrative} Explain how to use the interval estimate to test the hypotheses.
Mass Production Line
A quality control examiner keeps a tally sheet of the number of acceptable and unacceptable products
that come off two different production lines. The completed sheet is shown below.
Products
Mass Production Line
Acceptable
Unacceptable
1
152
48
2
136
54
119. {Mass Production Line Narrative} Can the inspector infer at the 5% significance level that production
line 1 is doing a better job than production line 2?
120. {Mass Production Line Narrative} What is the p-value of the test? Explain how to use it for testing the
hypotheses.
121. {Mass Production Line Narrative} Estimate with 95% confidence the difference in population
proportions.
Worker Safety
An OSHA agent wanted to determine if efforts to promote safety have been successful. By checking
the records of 250 workers, he found that 30 of them suffered either minor or major injuries that year.
A random sample of 400 workers last year revealed that 80 suffered some form of injury.
122. {Worker Safety Narrative} Can the statistician infer at the 5% significance level that efforts to
promote safety have been successful?
123. {Worker Safety Narrative} What is the p-value of the test? Explain how to use it for testing the
hypotheses.
124. {Worker Safety Narrative} Estimate with 95% confidence the difference in population proportions.
Speed Limits Violation
Do out-of-state motorists violate the speed limit more frequently than in-state motorists? This vital
question was addressed by the highway patrol in a large eastern state. A random sample of the speeds
of 2,500 randomly selected cars was categorized according to whether the car was registered in the
state or in some other state and whether or not the car was violating the speed limit. The data follow.
In State Cars
Out of State Cars
Speeding
521
328
Not speeding
1141
510
125. {Speed Limits Violation Narrative} Do these data provide enough evidence to support the highway
patrol’s claim at the 5% significance level?
126. {Speed Limits Violation Narrative} Estimate with 95% confidence the difference in population
proportions.
ANS:
127. {Speed Limits Violation Narrative} Briefly describe what the interval estimate tells you.