160. {Oil Quality and Price Narrative} Determine the coefficient of determination and discuss what its
value tells you about the two variables.
161. {Oil Quality and Price Narrative} Calculate the Pearson correlation coefficient. What sign does it
have? Why?
162. {Oil Quality and Price Narrative} Conduct a test of the population coefficient of correlation to
determine at the 5% significance level whether a positive linear relationship exists between the quality
of oil and price per barrel.
163. {Oil Quality and Price Narrative} Conduct a test of the population slope to determine at the 5%
significance level whether a linear relationship exists between the quality of oil and price per barrel.

164. {Oil Quality and Price Narrative} Do the
and
1 tests in the previous two questions provide the same
results? Explain.
165. A prediction interval is used when we want to predict a one-time occurrence for a particular value of y
when the independent variable is a given x value.
166. A confidence interval (as opposed to a prediction interval) is used to estimate the long-run average
value of y.
167. The confidence interval estimate of the expected value of y will be narrower than the prediction
interval for the same given value of x and confidence level. This is because there is less error in
estimating a mean value as opposed to predicting an individual value.
168. The confidence interval estimate of the expected value of y will be wider than the prediction interval
for the same given value of x and confidence level. This is because there is more error in estimating a
mean value as opposed to predicting an individual value.
169. The prediction interval for a particular value of y is always wider than the confidence interval for mean
value of y, given the same data set, x value, and confidence level.
170. A confidence interval estimate for the expected value of y will always be wider than the prediction
interval for the same given value of x and the same confidence level.
171. There is more error in estimating a mean value of y as opposed to predicting an individual value of y.
172. The graph of a confidence interval for the expected value of y is represented by two parallel lines, one
on either side of the regression line.
173. The graph of a confidence interval for the expected value of y is represented by two curved lines, one
on either side of the regression line.
174. The point where confidence intervals and prediction intervals do best is .
ANS:
175. The width of the confidence interval estimate for the predicted value of y depends on
a.
the standard error of the estimate
b.
the value of x for which the prediction is being made
c.
the sample size
d.
All of these choices are true.
176. The confidence interval estimate of the expected value of y for a given value x, compared to the
prediction interval of y for the same given value of x and confidence level, will be:
a.
wider.
b.
the same.
c.
narrower.
d.
impossible to know.
177. In order to predict with 80% confidence the expected value of y for a given value of x in a simple
linear regression problem, a random sample of 15 observations is taken. Which of the following t-table
values listed below would be used?
a.
1.350
b.
1.771
c.
2.160
d.
2.650
178. In order to predict with 98% confidence the expected value of y for a given value of x in a simple
linear regression problem, a random sample of 15 observations is taken. Which of the following t-table
values listed below would be used?
a.
1.350
b.
1.771
c.
2.160
d.
2.650
179. In order to predict with 90% confidence the expected value of y for a given value of x in a simple
linear regression problem, a random sample of 10 observations is taken. Which of the following t-table
values listed below would be used?
a.
1.812
b.
1.860
c.
2.228
d.
2.306
180. In order to estimate with 95% confidence the expected value of y for a given value of x in a simple
linear regression problem, a random sample of 10 observations is taken. Which of the following t-table
values listed below would be used?
a.
2.228
b.
2.306
c.
1.860
d.
1.812
181. If you take a particular x value and plug it into a regression line equation, the result is a(n)
____________________ estimate for y.
182. You use a(n) ____________________ interval whenever you want to estimate a one-time occurrence
for a particular value of y when x is a given value.
183. You use a(n) ____________________ interval whenever you want to estimate the mean of y when x is
a given value.
184. A prediction interval for a particular y is always ____________________ than a confidence interval
for the mean of y.
185. There is ____________________ error in estimating a mean than in predicting an individual value.
186. The farther a given value of x is from the mean of x, the ____________________ the estimated error
becomes.
187. Graphically, a prediction interval is represented as two ____________________ lines.
188. Graphically, a confidence interval for the mean of y is represented as two ____________________
lines.
189. A medical statistician wanted to examine the relationship between the amount of sunshine (x) and
incidence of skin discolorations (y). As an experiment he found the number of skin discolorations
detected per 100,000 of population and the average daily sunshine in eight counties around the
country. These data are shown below.
Average Daily Sunshine
5
7
6
7
8
6
4
3
Skin Discolorations per 100,000
7
11
9
12
15
10
7
5
Predict with 95% confidence the skin discolorations per 100,000 in a county with a daily average of
6.5 hours of sunshine.
190. {Sales and Experience Narrative} Predict with 95% confidence the monthly sales of a salesperson with
10 years of experience.
191. {Sales and Experience Narrative} Estimate with 95% confidence the average monthly sales of all
salespersons with 10 years of experience.
192. {Sales and Experience Narrative} Which interval in the previous two questions is narrower: the
confidence interval estimate of the expected value of y or the prediction interval for the same given
value of x (10 years) and same confidence level? Why?
Game Winnings & Education
An ardent fan of television game shows has observed that, in general, the more educated the
contestant, the less money he or she wins. To test her belief she gathers data about the last eight
winners of her favorite game show. She records their winnings in dollars and the number of years of
education. The results are as follows.
Contestant
Years of Education
Winnings
1
11
750
2
15
400
3
12
600
4
16
350
5
11
800
6
16
300
7
13
650
8
14
400
193. {Game Winnings & Education Narrative} Predict with 95% confidence the winnings of a contestant
who has 15 years of education.
194. {Game Winnings & Education Narrative} Predict with 95% confidence the winnings of a contestant
who has 10 years of education.
195. {Game Winnings & Education Narrative} Estimate with 95% confidence the average winnings of all
contestants who have 15 years of education.

196. {Game Winnings & Education Narrative} Estimate with 95% confidence the average winnings of all
contestants who have 10 years of education.
Movie Revenues
A financier whose specialty is investing in movie productions has observed that, in general, movies
with “big-name” stars seem to generate more revenue than those movies whose stars are less well
known. To examine his belief he records the gross revenue and the payment (in $ millions) given to
the two highest-paid performers in the movie for ten recently released movies.
Movie
Cost of Two Highest Paid
Gross Revenue
Performers ($mil)
($mil)
1
5.3
48
2
7.2
65
3
1.3
18
4
1.8
20
5
3.5
31
6
2.6
26
7
8.0
73
8
2.4
23
9
4.5
39
10
6.7
58
197. {Movie Revenues Narrative} Predict with 95% confidence the gross revenue of a movie whose top
two stars earn $5.0 million.
198. {Movie Revenues Narrative} Estimate with 95% confidence the average gross revenue of a movie
whose top two stars earn $5.0 million.
199. {Movie Revenues Narrative} Which interval in the previous two questions is narrower: the confidence
interval estimate of the expected value of y or the prediction interval for the same given value of x (10
years) and same confidence level? Why?
200. {Cost of Books Narrative} Predict with 90% confidence the selling price of a book with 900 pages.
201. {Cost of Books Narrative} Estimate with 90% confidence the average selling price of all books with
900 pages.
202. {Cost of Books Narrative} Which interval in the previous question is narrower: the confidence interval
estimate of the expected value of y or the prediction interval for the same given value of x (10 years)
and same confidence level? Why?
Wayne Newton Concert
At a recent Wayne Newton concert, a survey was conducted that asked a random sample of 20 people
their age and how many concerts they have attended since the first of the year. The following data
were collected:
Age
62
57
40
49
67
54
43
65
54
41
Number of Concerts
6
5
4
3
5
5
2
6
3
1
Age
44
48
55
60
59
63
69
40
38
52
Number of Concerts
3
2
4
5
4
5
4
2
1
3
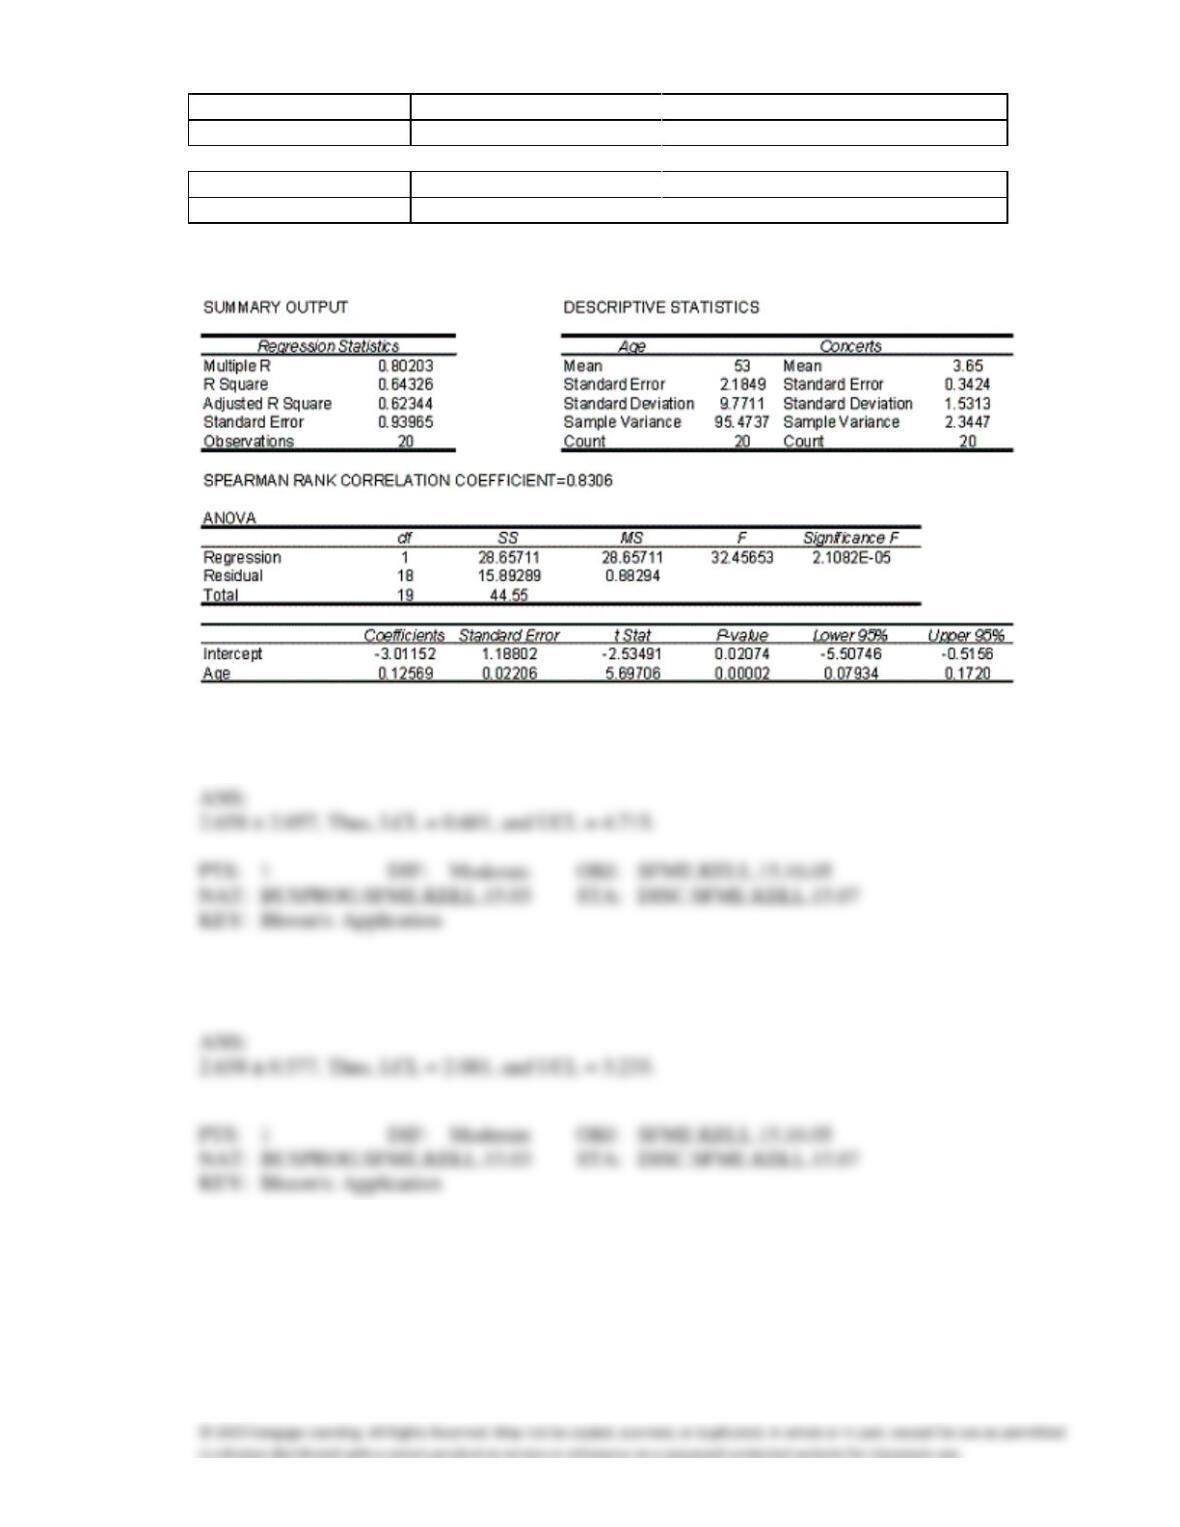
An Excel output follows:
203. {Wayne Newton Concert Narrative} Predict with 95% confidence the number of concerts attended by
a 45 year-old individual.
204. {Wayne Newton Concert Narrative} Estimate with 95% confidence the average number of concerts
attended by all 45 year-old individuals.
205. {Wayne Newton Concert Narrative} Which interval in the previous two questions is narrower: the
confidence interval estimate of the expected value of y or the prediction interval for the same given
value of x (10 years) and same confidence level? Why?
ANS:
206. {Oil Quality and Price Narrative} Predict with 95% confidence the oil price per barrel for an API
degree of 35.
207. {Oil Quality and Price Narrative} Estimate with 95% confidence the average oil price per barrel for an
API degree of 35.
208. {Oil Quality and Price Narrative} Which interval in the previous two questions is narrower: the
confidence interval estimate of the expected value of y or the prediction interval for the same given
value of x (10 years) and same confidence level? Why?