CHAPTER 4B: NUMERICAL DESCRIPTIVE TECHNIQUES
TRUE/FALSE
1. If the covariance of x and y is 26.16 and the standard deviation of x is 32.7, then the slope of the least
squares line is b1 =.80.
2. If , , n = 12, and the slope equals 0.5, then the y-intercept of the least
squares line is b0 = 276.08.
3. If the coefficient of correlation r = 0, then there can be no linear relationship between the dependent
variable y and the independent variable x.
4. If the coefficient of correlation r = 0, then there can be no relationship whatsoever between the
dependent variable y and the independent variable x.
5. If the coefficient of correlation r = −.81, the standard deviations of x and y are 20 and 25, respectively,
then cov(x, y) must be −405.0.
6. The advantage that the coefficient of correlation has over the covariance is that the former has a set
lower and upper limit.
7. If the standard deviations of x and y are 12.5 and 10.8, respectively, and the covariance is 118.8, then
the coefficient of correlation r is 0.88.
8. Generally speaking, if two variables are unrelated, the covariance will be a number close to zero.
9. Three measures of the linear relationship between x and y are the coefficient of correlation, the
coefficient of determination, and the coefficient of variation.
10. The coefficient of correlation r is a number that indicates the direction and the strength of the linear
relationship between the dependent variable y and the independent variable x.
11. The variance is a measure of the linear relationship between two variables.
12. A perfect straight line sloping upward would produce a correlation coefficient value of 1.0.
13. When the standard deviation is expressed as a percentage of the mean, the result is the coefficient of
correlation.
14. If the coefficient of correlation r = 1, then the best-fit linear equation will actually include all of the
observations.
15. If the standard deviation of x is 18, the covariance of x and y is 120, the coefficient r = 0.90, then the
standard deviation of y is 54.87.
MULTIPLE CHOICE
1. Assuming a linear relationship between X and Y, if the coefficient of correlation (r) equals −0.75, this
means that:
a.
there is very weak correlation.
b.
the slope b1 is = −0.75.
c.
the value of X is always greater than the value of Y.
d.
None of these choices are true.
2. The slope b1 of the least squares line represents the:
a.
predicted value of Y when X = 0.
b.
estimated average change in Y per unit change in X.
c.
predicted value of Y.
d.
variation around the regression line.
3. Generally speaking, if two variables are unrelated (as one increases, the other shows no pattern), the
covariance will be:
a.
a large positive number.
b.
a large negative number.
c.
a positive or negative number close to zero.
d.
None of these choices.
4. If the correlation coefficient r = 1.00, then all the observations must fall exactly on:
a.
a straight line with a slope that equals 1.00.
b.
a straight line with a negative slope.
c.
a straight line with a positive slope.
d.
a horizontal straight line with a zero slope.
5. The Y-intercept, b0, of the least squares line represents the:
a.
estimated average value of Y when X = 0.
b.
estimated average change in Y per unit change in X.
c.
predicted value of Y.
d.
variation around the sample regression line.
6. A perfect straight line sloping downward would produce a correlation coefficient equal to:
a.
+1.0
b.
−1.0
c.
0.0
d.
Cannot tell from the information given.
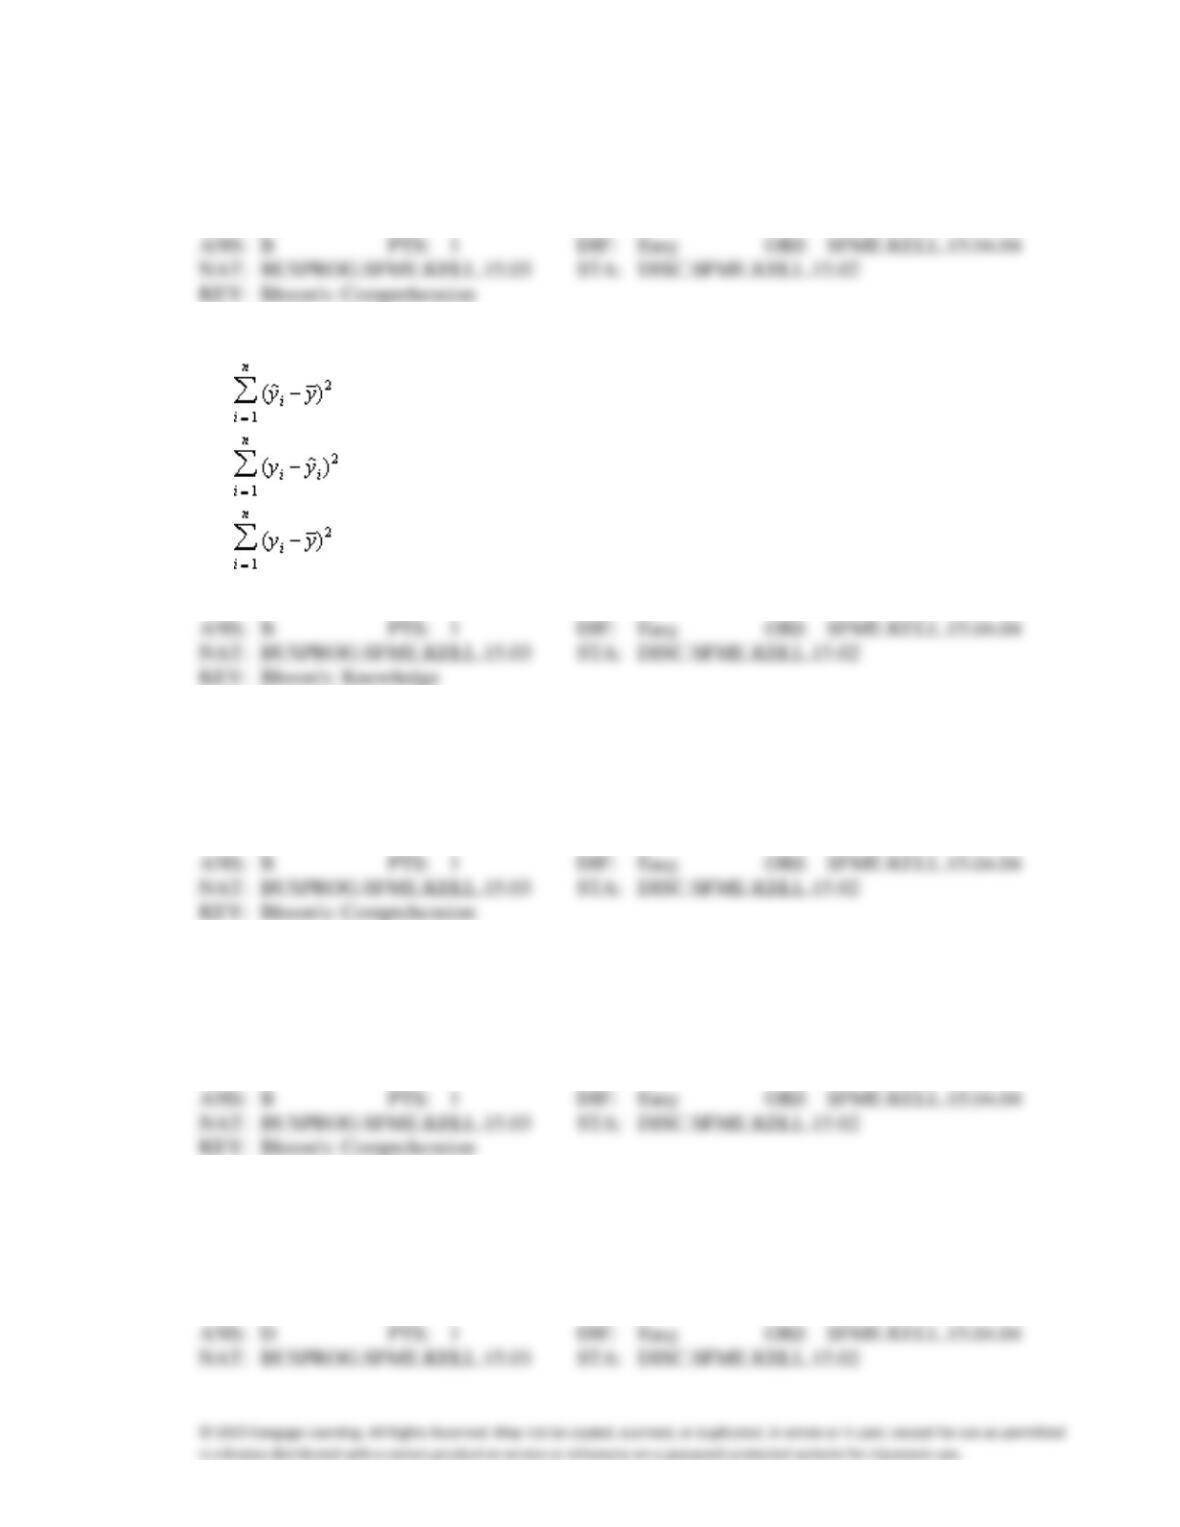
7. The least squares method minimizes which of the following sum of squares?
a.
b.
c.
d.
All of these choices are true.
8. Which of the following is a property of r, the coefficient of correlation?
a.
r always lies between 0 and 1.
b.
r has no units.
c.
If you switch the values of X and Y, the sign of r changes.
d.
All of these choices are true.
9. Which of the following is a property of the slope, b1?
a.
The slope equals one if X and Y have the same variance.
b.
The slope has the same sign as r, the coefficient of correlation.
c.
The slope equals one if r equals one.
d.
All of these choices are true.
10. Which of the following are measures of the linear relationship between two variables?
a.
The covariance
b.
The coefficient of correlation
c.
The variance
d.
Both a and b
11. The strength of the linear relationship between two interval variables can be measured by the:
a.
coefficient of variation.
b.
coefficient of correlation.
c.
slope of the regression line.
d.
Y-intercept.
12. The denominator in the calculation of the sample covariance, cov (x,y), is:
a.
n − 2
b.
n − 1
c.
n
d.
2n − 1
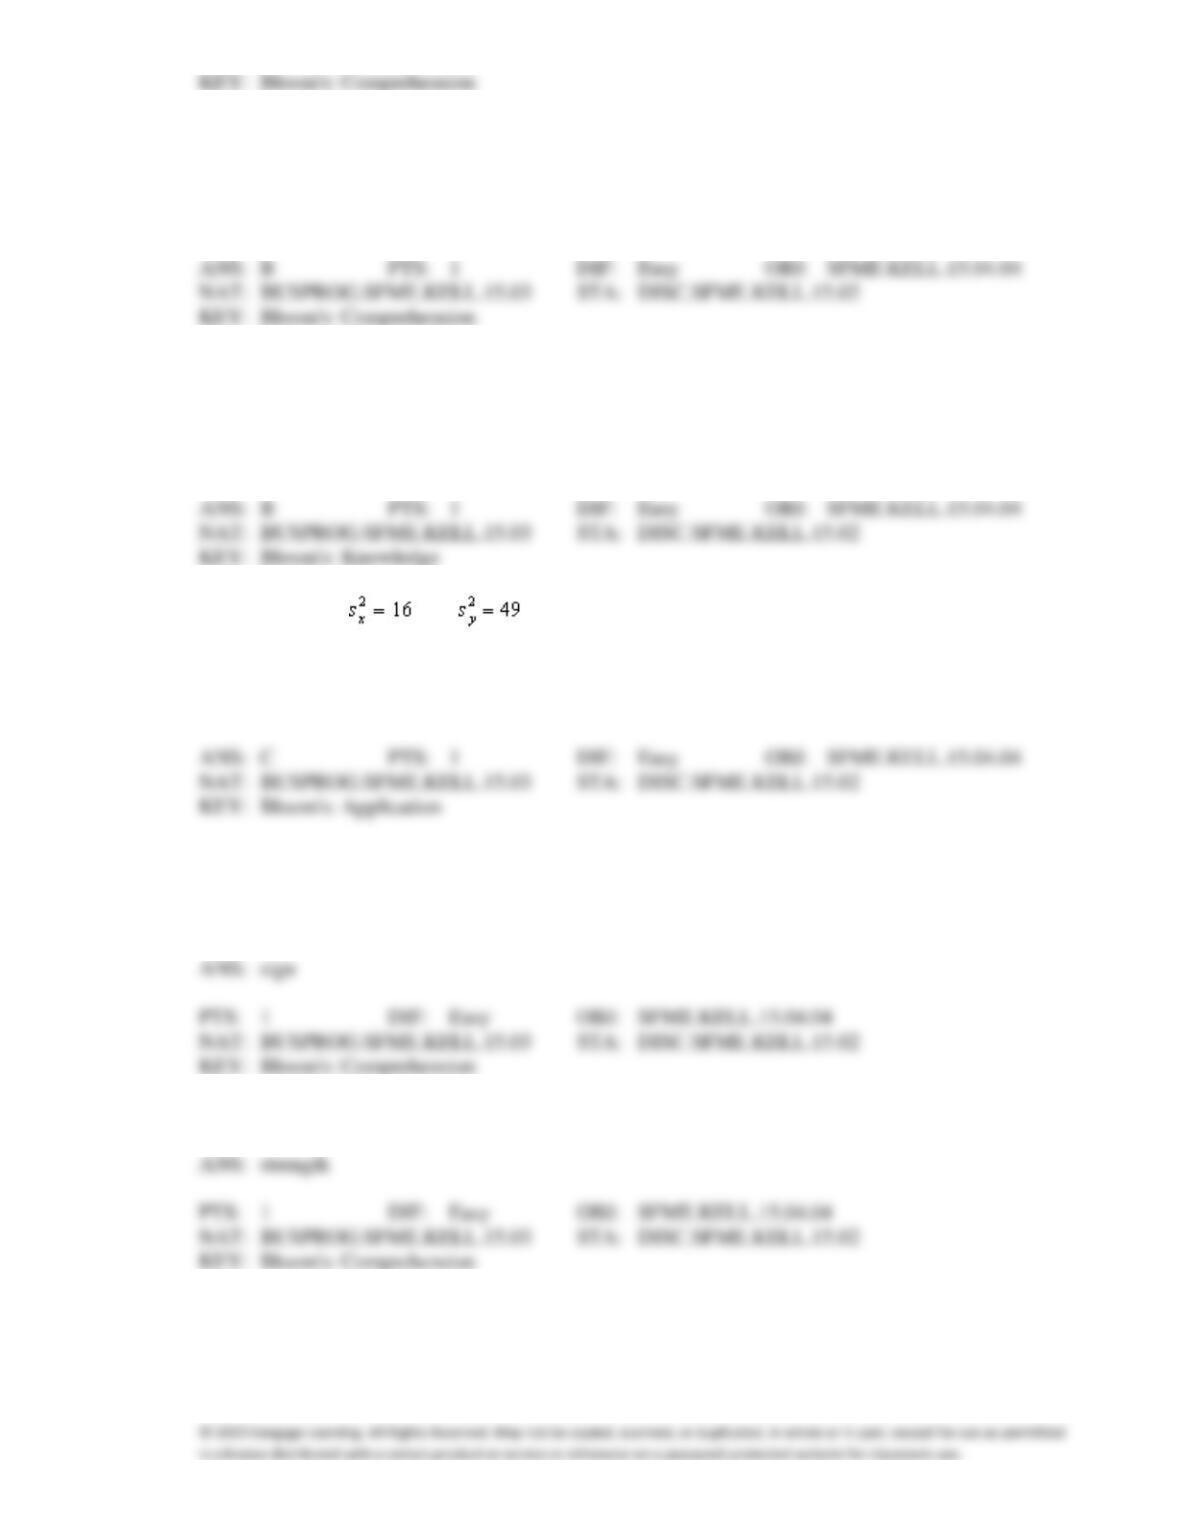
13. If cov(x, y) = 20, and then the sample coefficient of correlation r is:
a.
1.400
b.
0.026
c.
0.714
d.
None of these choices.
COMPLETION
1. The ____________________ of the correlation indicates the direction of a linear relationship.
2. The magnitude of the correlation measures the ____________________ of a linear relationship.
3. The ____________________ of a linear relationship is hard to interpret from the covariance, but it is
easy to interpret from the correlation.
4. The method used to find the best fitting line through the observations is called the
____________________ method.
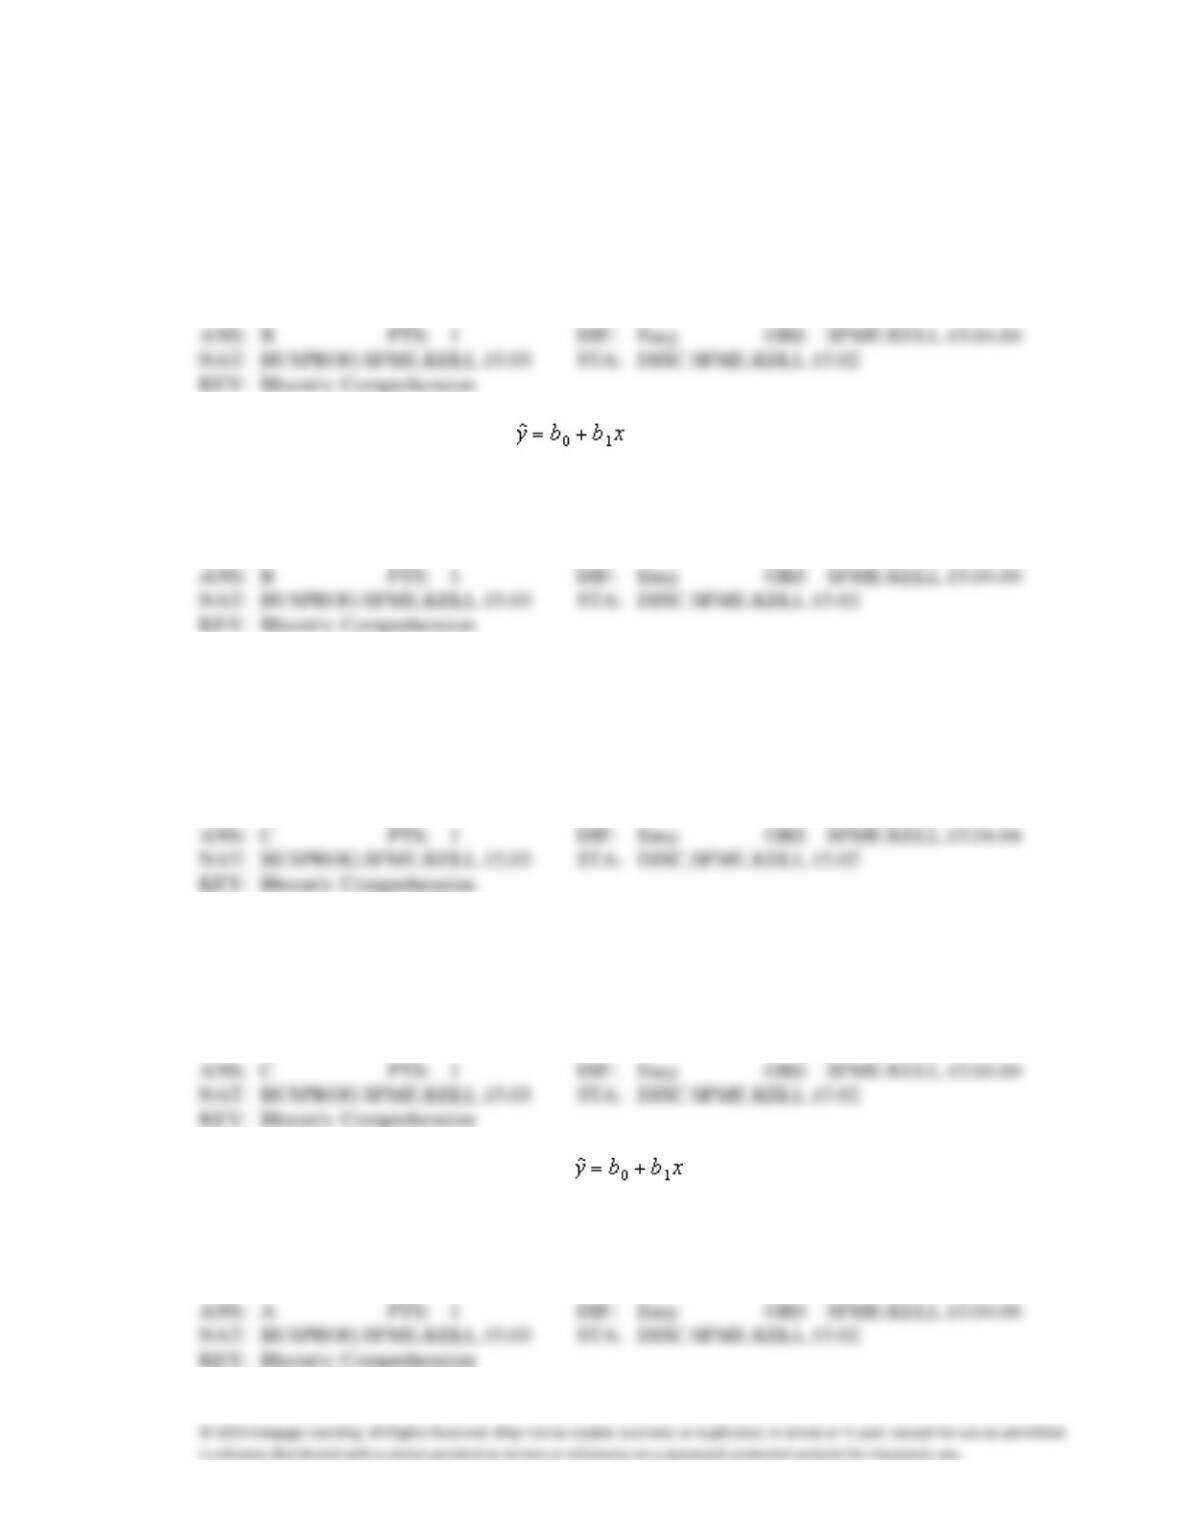
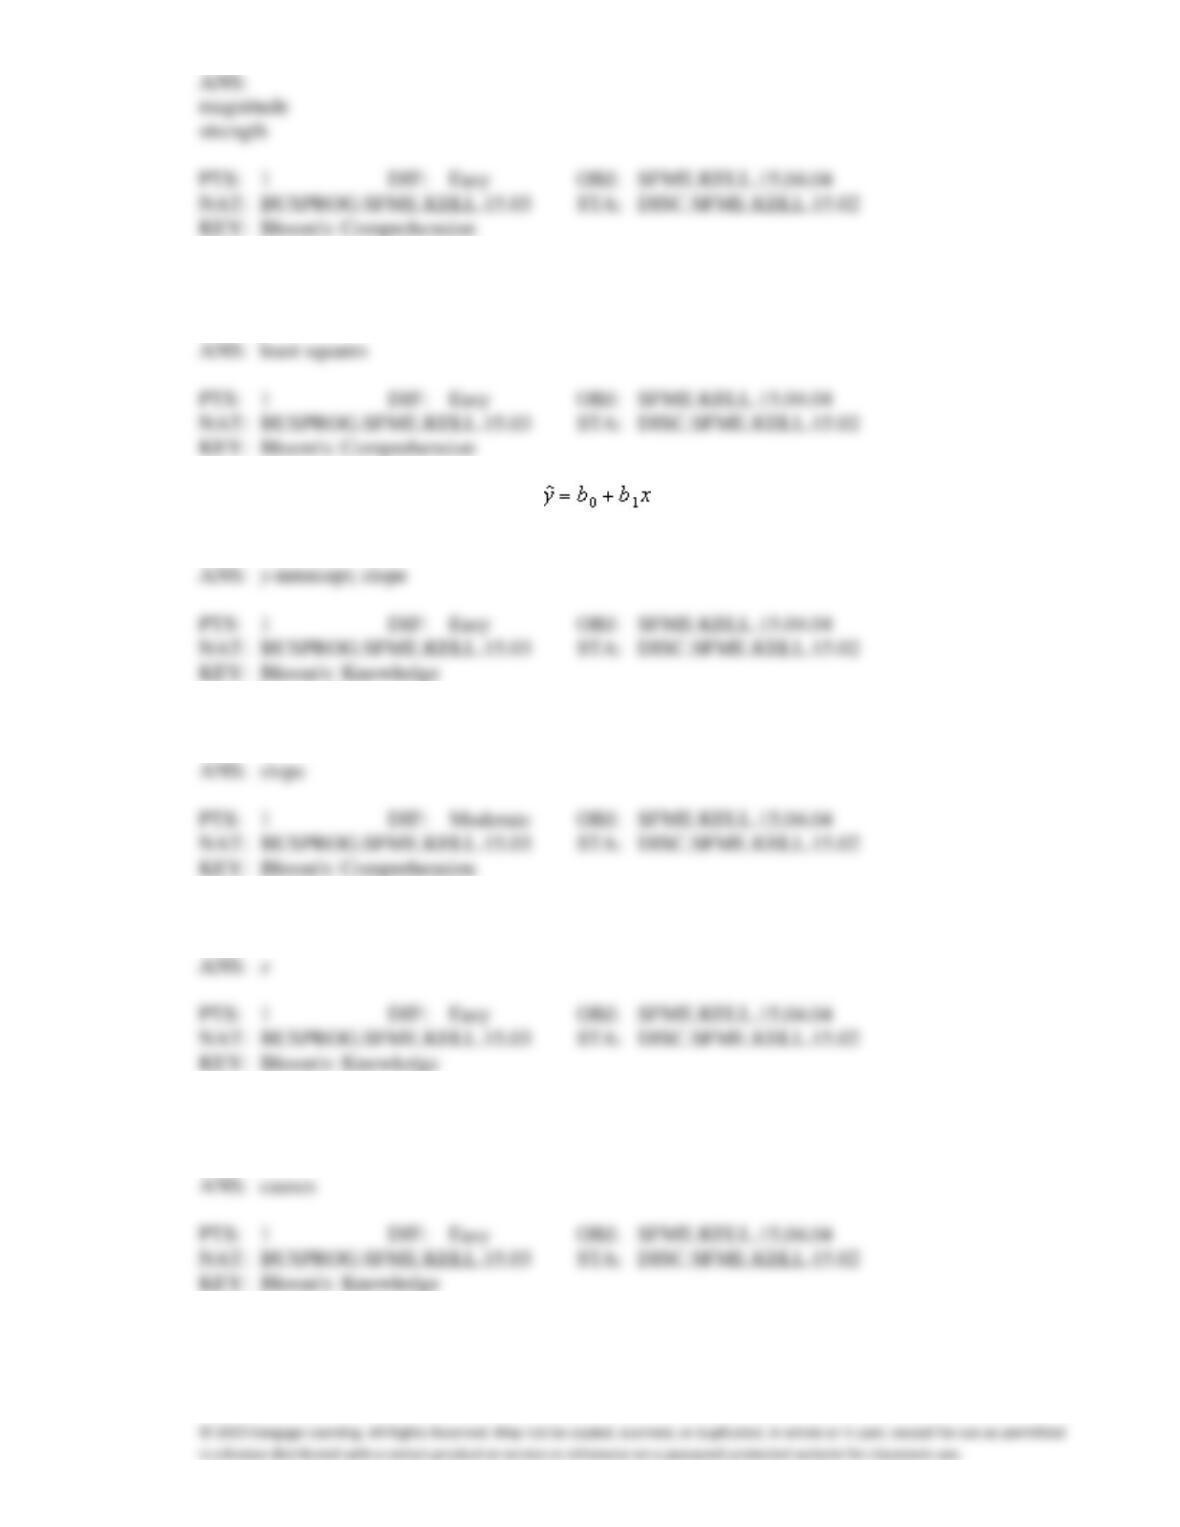
5. In the equation of the least squares line, , b0 is the ____________________ and b1 is the
____________________.
6. The ____________________ measures the margin of relative change in the dependent variable.
7. The y-intercept of the least squares line is the point on the line when ________________ = 0.
8. When two variables x and y are linearly related, it does not necessarily mean that x
____________________ y.
9. The coefficient of determination is the percentage of variation in the ____________________ variable
that is explained by the variation in the ____________________ variable.
SHORT ANSWER
1. Given the following sample data:
x
420
610
625
500
400
450
550
650
480
565
y
2.80
3.60
3.75
3.00
2.50
2.70
3.50
3.90
2.95
3.30
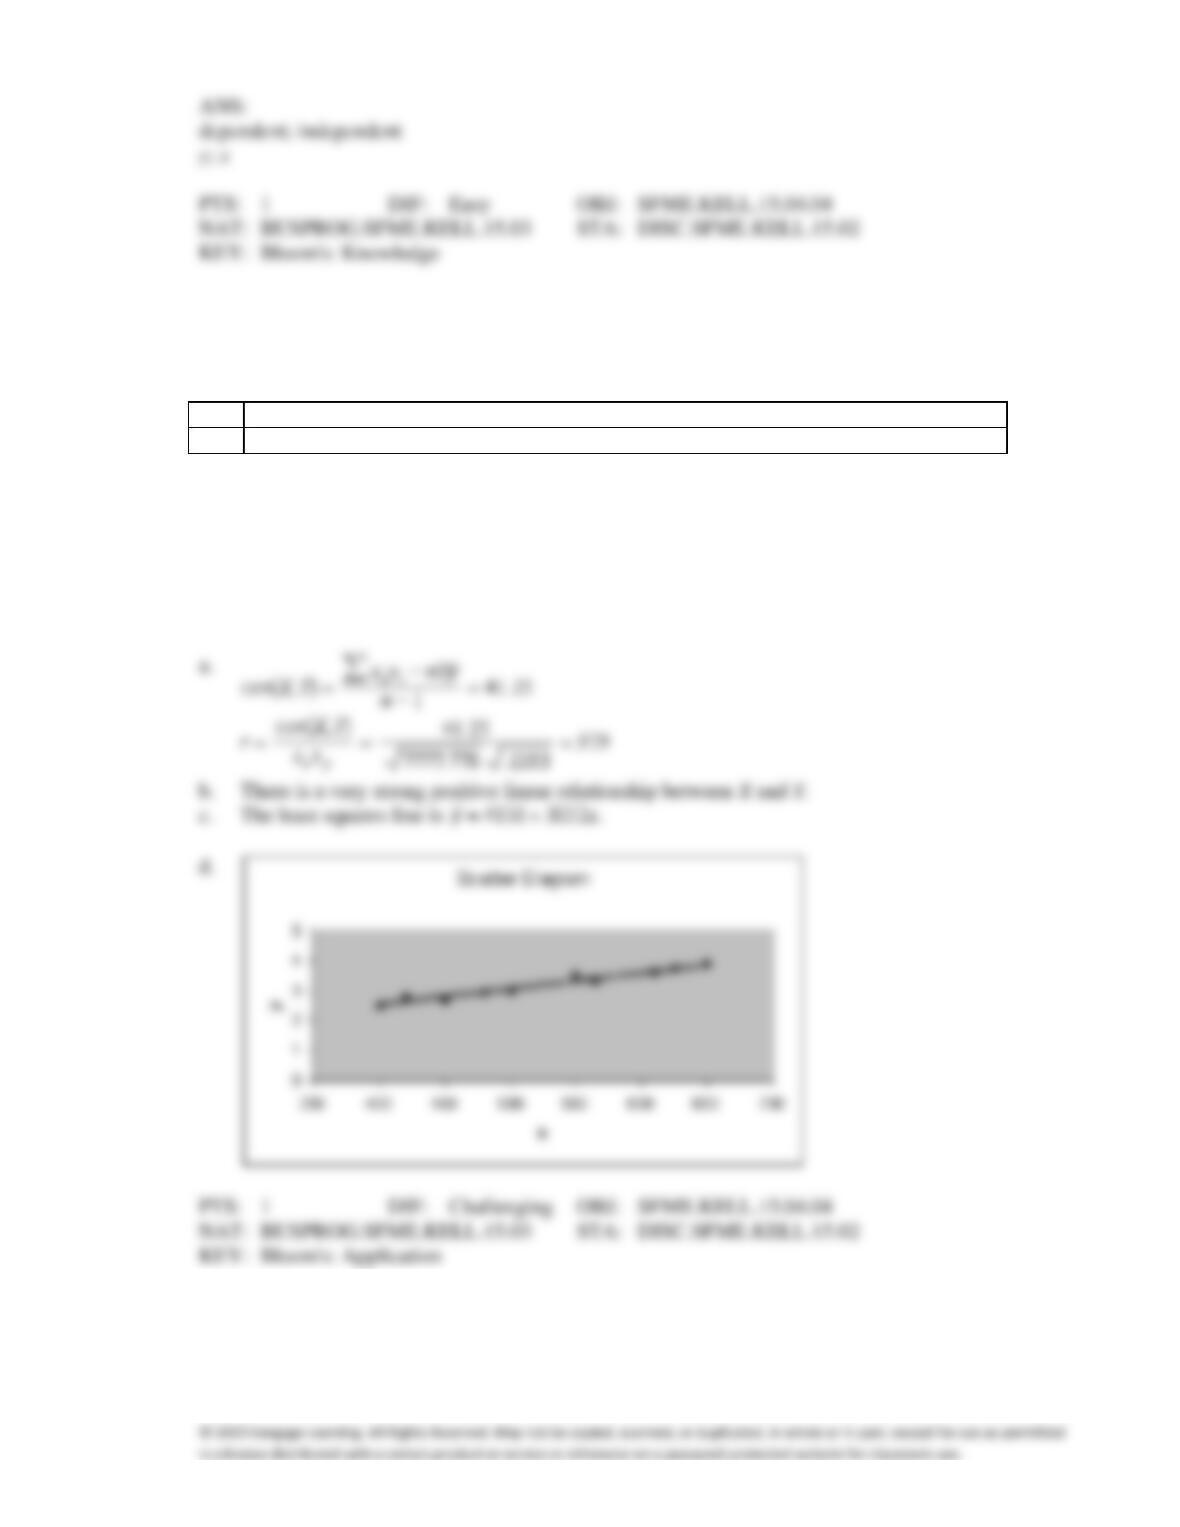
a.
Calculate the covariance and the correlation coefficient.
b.
Comment on the relationship between x and y.
c.
Determine the least squares line.
d.
Draw the scatter diagram and plot the least squares line.
b.
There is a very strong positive linear relationship between X and Y.
ANS:
Longevity and Salary
A sample of eight observations of variables x (years of experience) and y (salary in $1,000s) is shown
below:
x
5
3
7
9
2
4
6
8
y
20
23
15
11
27
21
17
14
2. {Longevity and Salary Narrative}
a.
Calculate and interpret the covariance between x and y.
b.
Give a possible reason that the covariance is negative.
tends to decrease. The magnitude of the covariance cannot be interpreted.
time and are not adjusted upwards for changing market values.
3. {Longevity and Salary Narrative}
a.
Calculate the coefficient of correlation, and comment on the relationship between x and y.
b.
Give a possible reason that the correlation is negative.
to decrease.
time and are not adjusted upwards for changing market values.
4. {Longevity and Salary Narrative} Determine the least squares line, and use it to estimate the value of y
for x = 6.
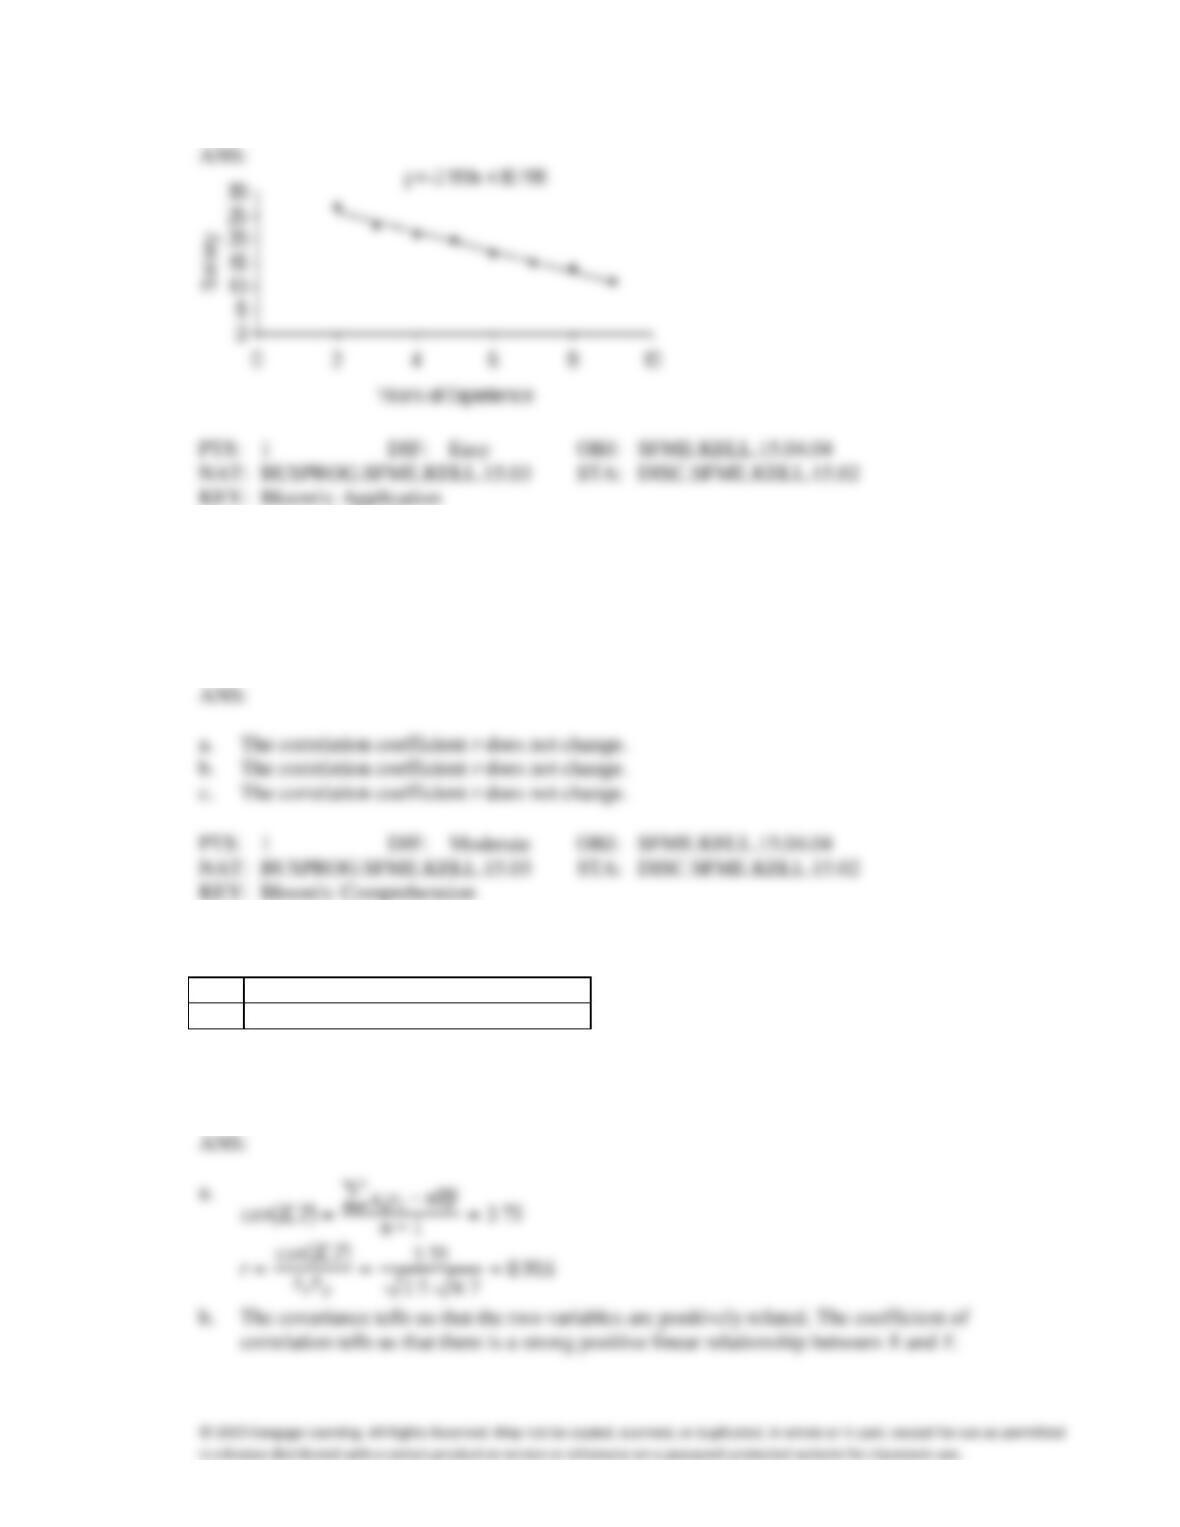
5. {Longevity and Salary Narrative} Draw the scatter diagram and plot the least squares line.
6. How is the value of the correlation coefficient r affected in each of the following cases?
a.
Each x value and y is multiplied by 4.
b.
Each x value is switched with the corresponding y value.
c.
Each x value is increased by 2.
a.
The correlation coefficient r does not change.
b.
The correlation coefficient r does not change.
c.
The correlation coefficient r does not change.
7. Consider the following data:
x
9
6
7
5
8
y
19
14
16
12
15
a.
Calculate the covariance and the coefficient of correlation for the sample.
b.
What do these statistics tell you about the relationship between x and y?
correlation tells us that there is a strong positive linear relationship between X and Y.