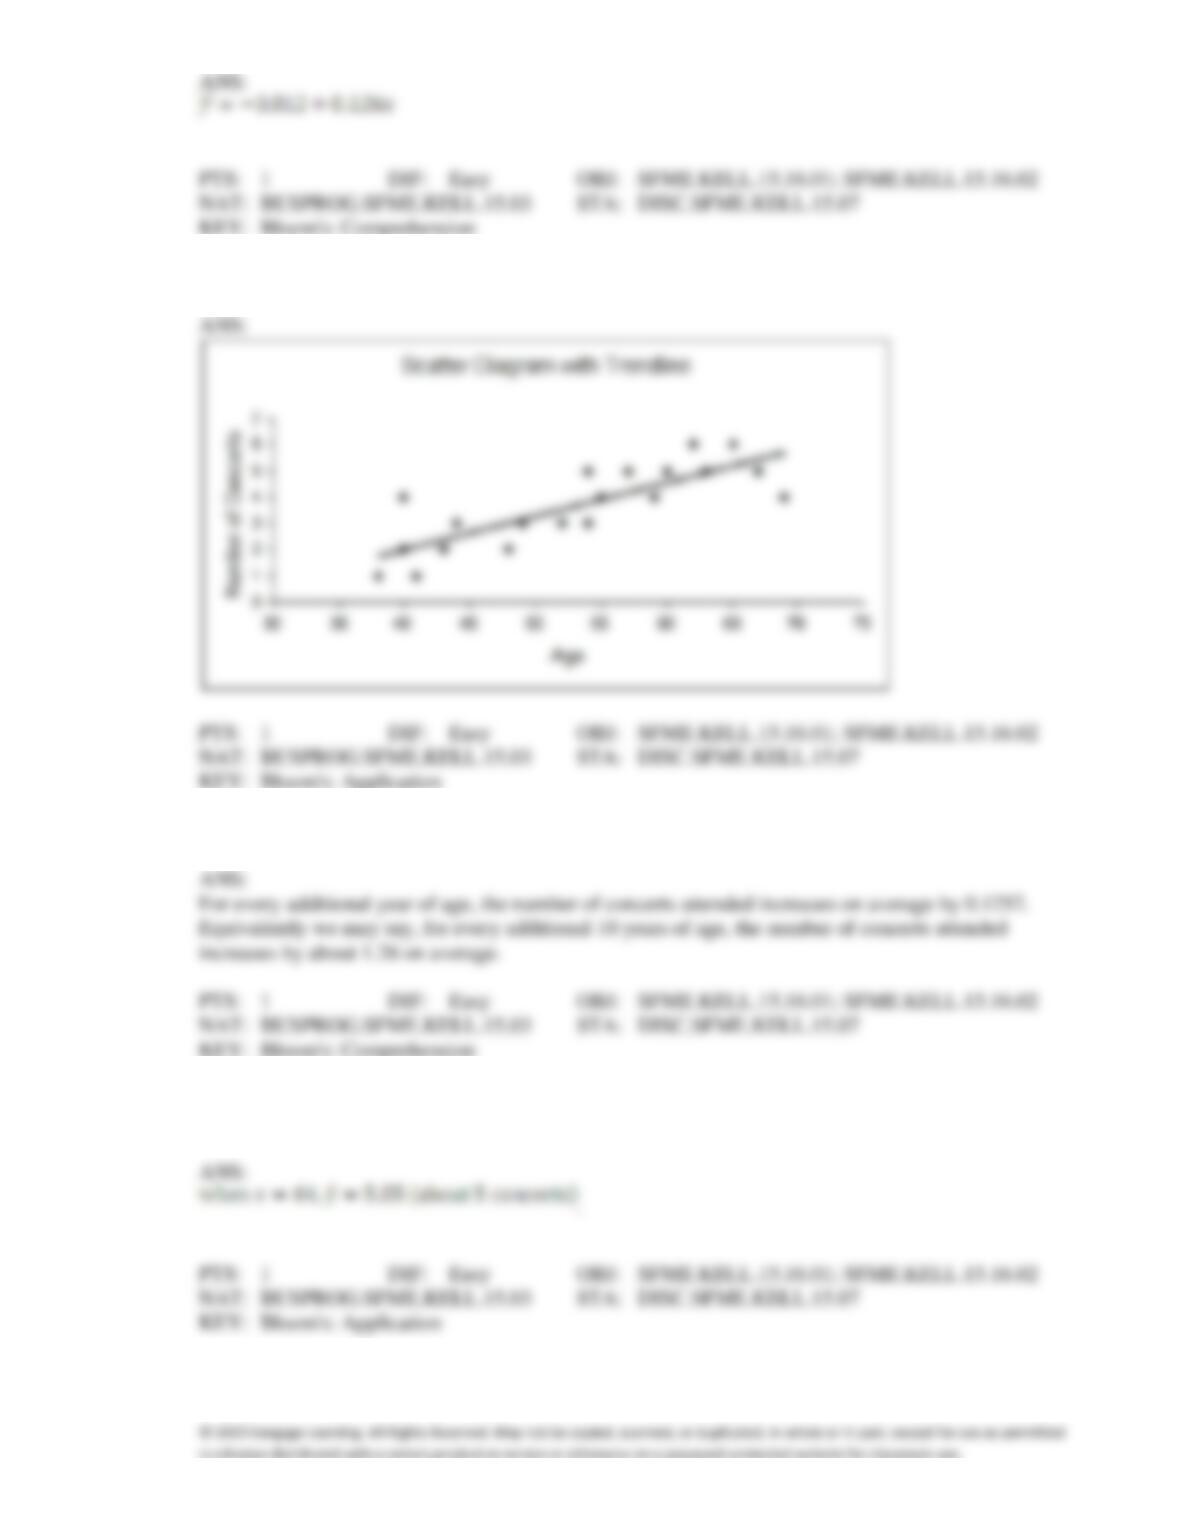
38. {Allman Brothers Concert Narrative} Plot the least squares regression line on the scatter diagram.
39. {Allman Brothers Concert Narrative} Interpret the value of the slope of the regression line.
40. {Allman Brothers Concert Narrative} Estimate the number of Allman Brothers concerts attended by a
64 year old person.
Oil Quality and Price
Quality of oil is measured in API gravity degrees–the higher the degrees API, the higher the quality.
The table shown below is produced by an expert in the field who believes that there is a relationship
between quality and price per barrel.
Oil degrees API
Price per barrel (in $)
27.0
12.02
28.5
12.04
30.8
12.32
31.3
12.27
31.9
12.49
34.5
12.70
34.0
12.80
34.7
13.00
37.0
13.00
41.0
13.17
41.0
13.19
38.8
13.22
39.3
13.27
A partial Minitab output follows:
Descriptive Statistics
Variable
N
Mean
StDev
SE Mean
Degrees
13
34.60
4.613
1.280
Price
13
12.730
0.457
0.127
Covariances
Degrees
Price
Degrees
21.281667
Price
2.026750
0.208833
Regression Analysis
Predictor
Coef
StDev
T
P
Constant
9.4349
0.2867
32.91
0.000
Degrees
0.095235
0.008220
11.59
0.000
S = 0.1314
R-Sq = 92.46%
R-Sq(adj) = 91.7%
Analysis of Variance
Source
DF
SS
MS
F
P
Regression
1
2.3162
2.3162
134.24
0.000
Residual Error
11
0.1898
0.0173
Total
12
2.5060
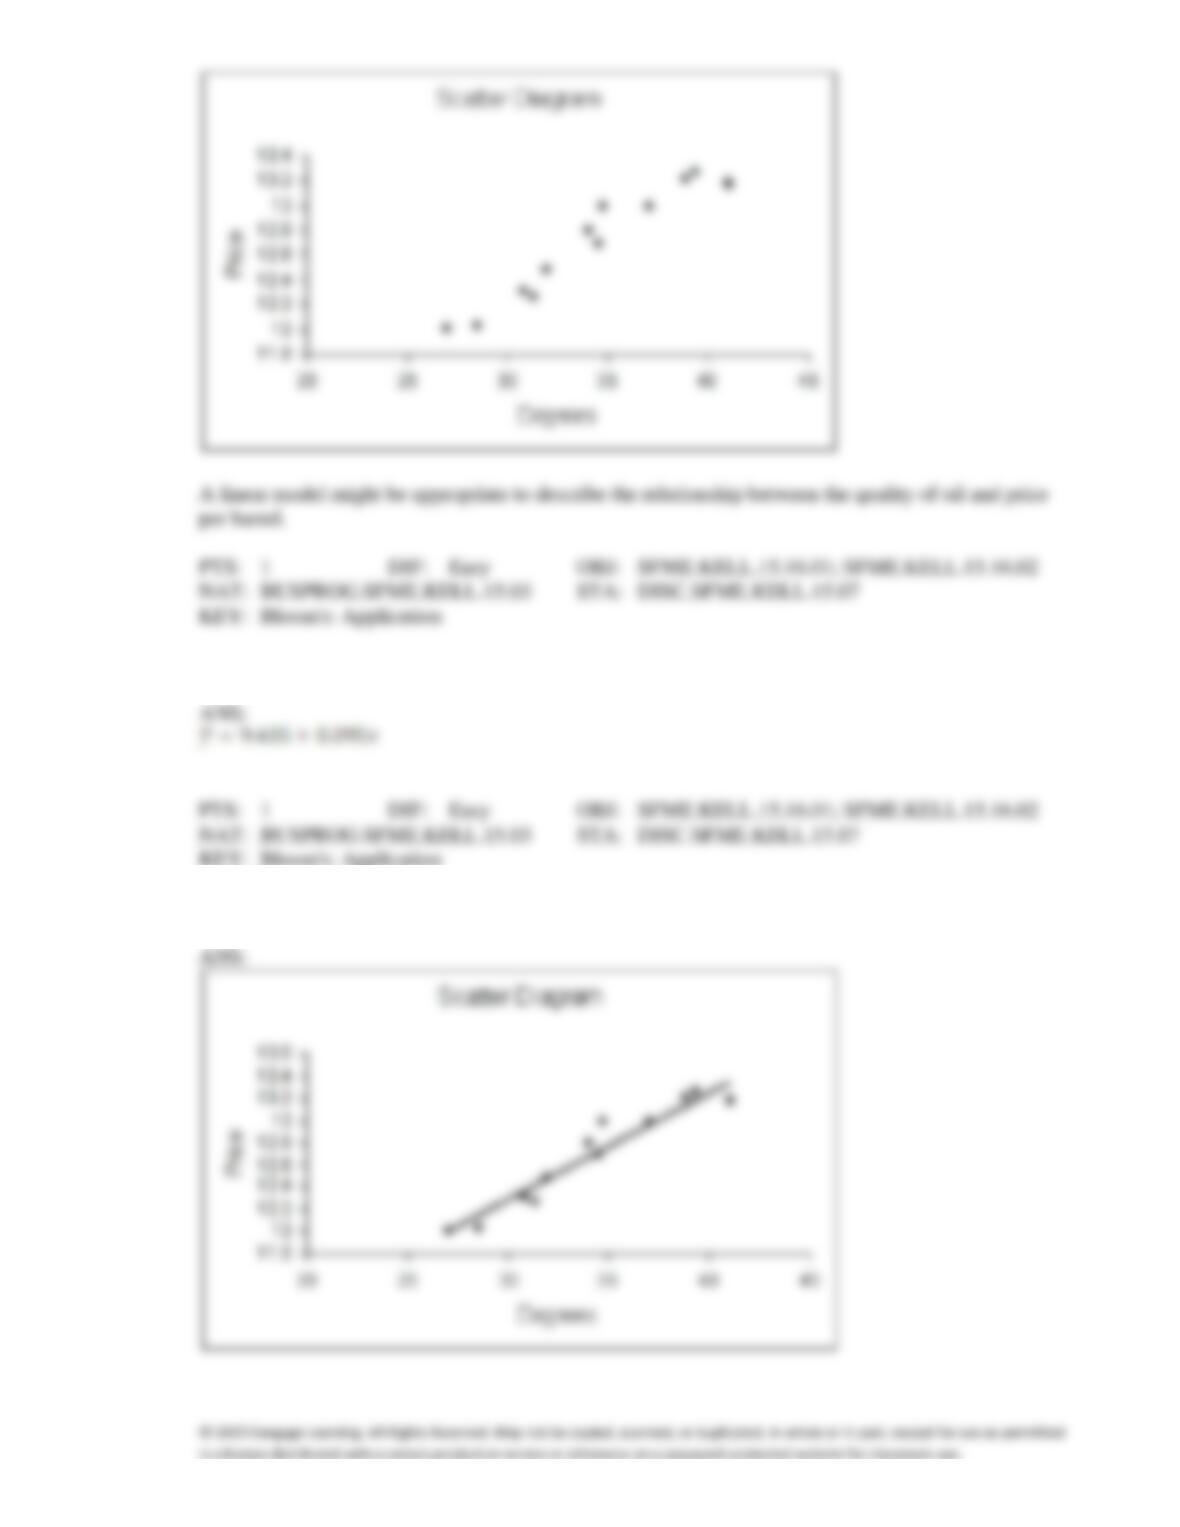
41. {Oil Quality and Price Narrative} Draw a scatter diagram of the data. Comment on whether it appears
that a linear model might be appropriate to describe the relationship between the quality of oil and
price per barrel.
ANS:
42. {Oil Quality and Price Narrative} Determine the least squares regression line.
43. {Oil Quality and Price Narrative} Plot the least squares regression line on the scatter diagram.
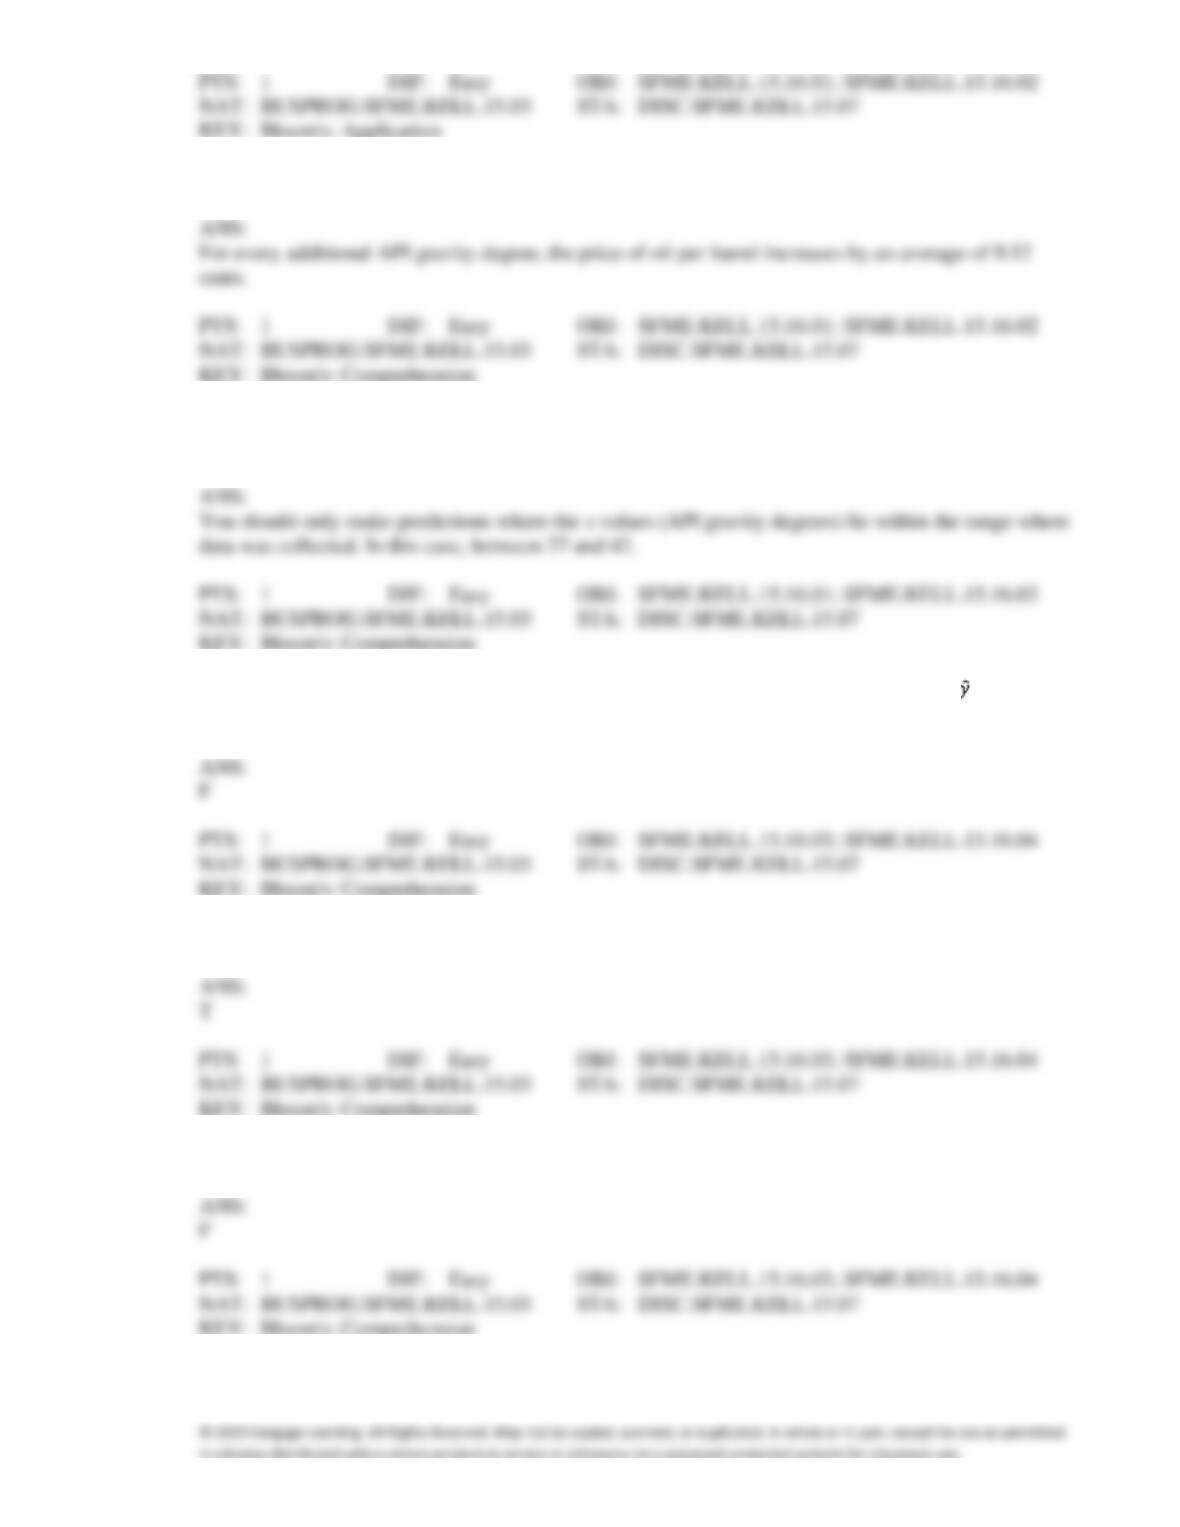
44. {Oil Quality and Price Narrative} Interpret the value of the slope of the regression line.
45. {Oil Quality and Price Narrative} For what values of API gravity degrees do we feel comfortable
making predictions for oil price?
46. When the actual values y of a dependent variable and the corresponding predicted values are the
same, the standard error of the estimate will be 1.0.
47. The value of the sum of squares for regression SSR can never be smaller than 0.0.
48. The value of the sum of squares for regression SSR can never be smaller than 1.
49. If the coefficient of correlation is 1.0, then the coefficient of determination must be 1.0.
50. In a simple linear regression model, testing whether the slope
1 of the population regression line
could be zero is the same as testing whether or not the population coefficient of correlation
equals
zero.
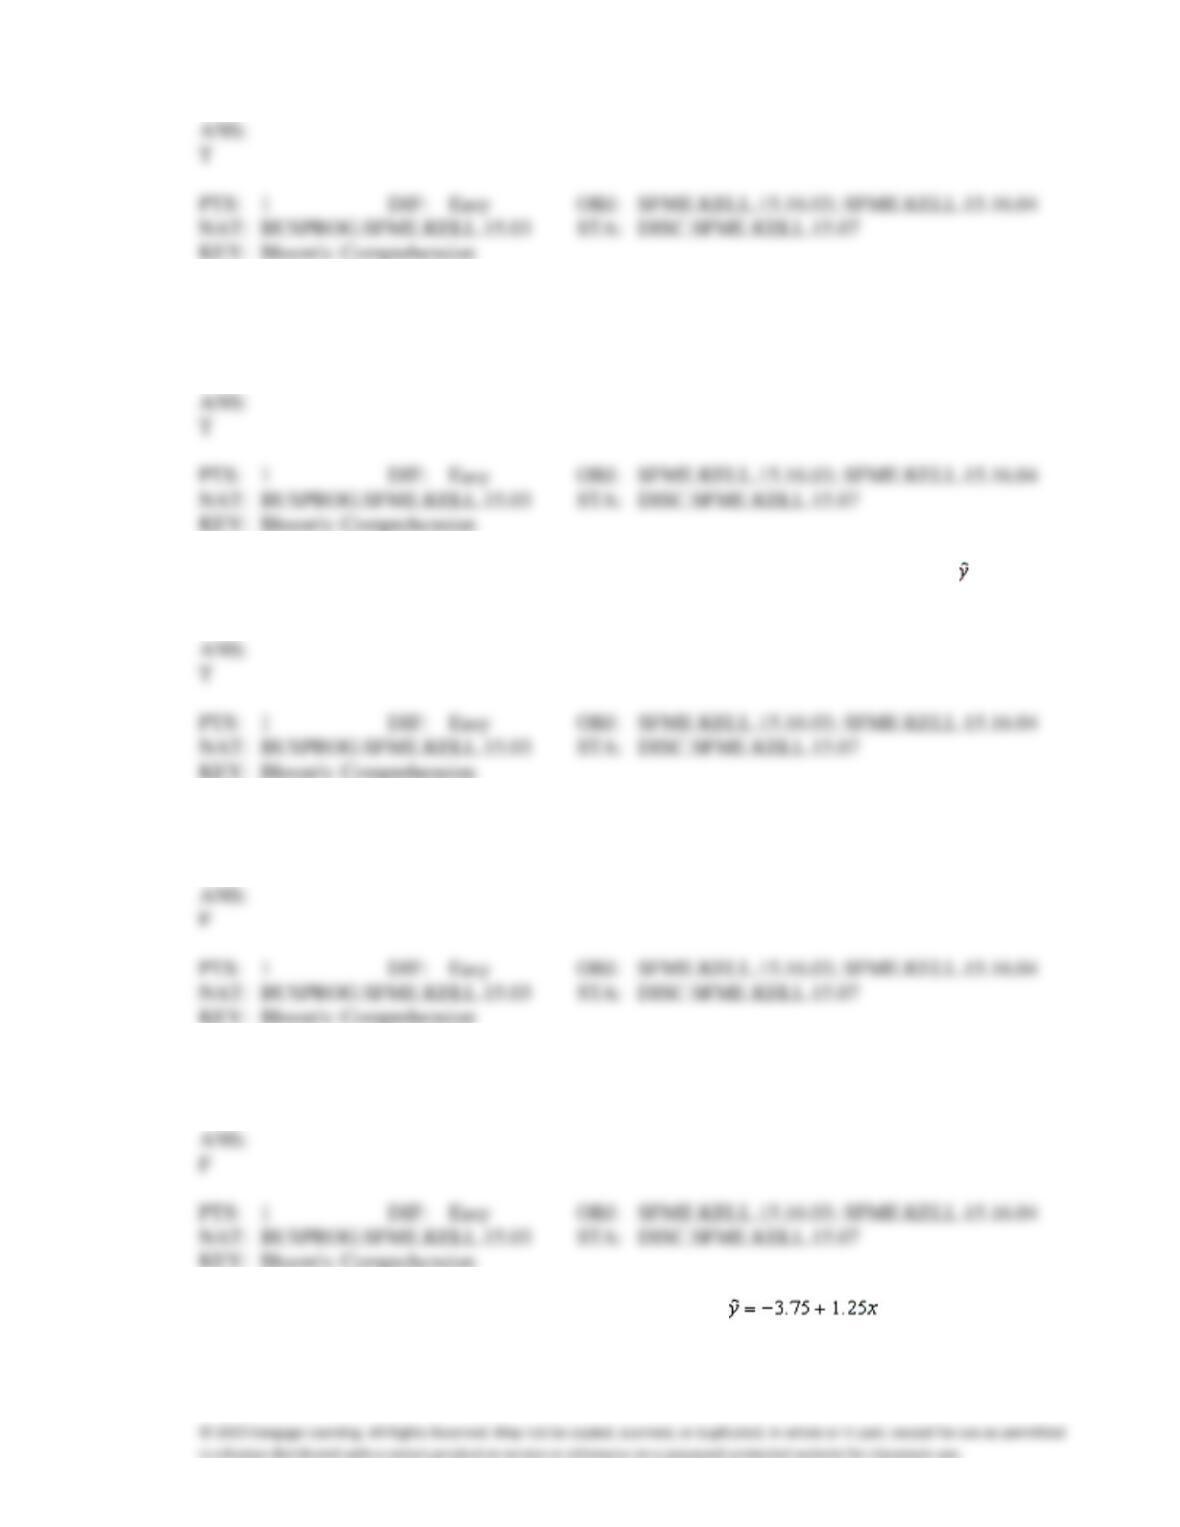
51. When the actual values y of a dependent variable and the corresponding predicted values are the
same, the standard error of estimate s
will be 0.0.
52. If there is no linear relationship between two variables x and y, the coefficient of determination must
be −1.0.
53. The value of the sum of squares for regression SSR can never be larger than the value of sum of
squares for error SSE.
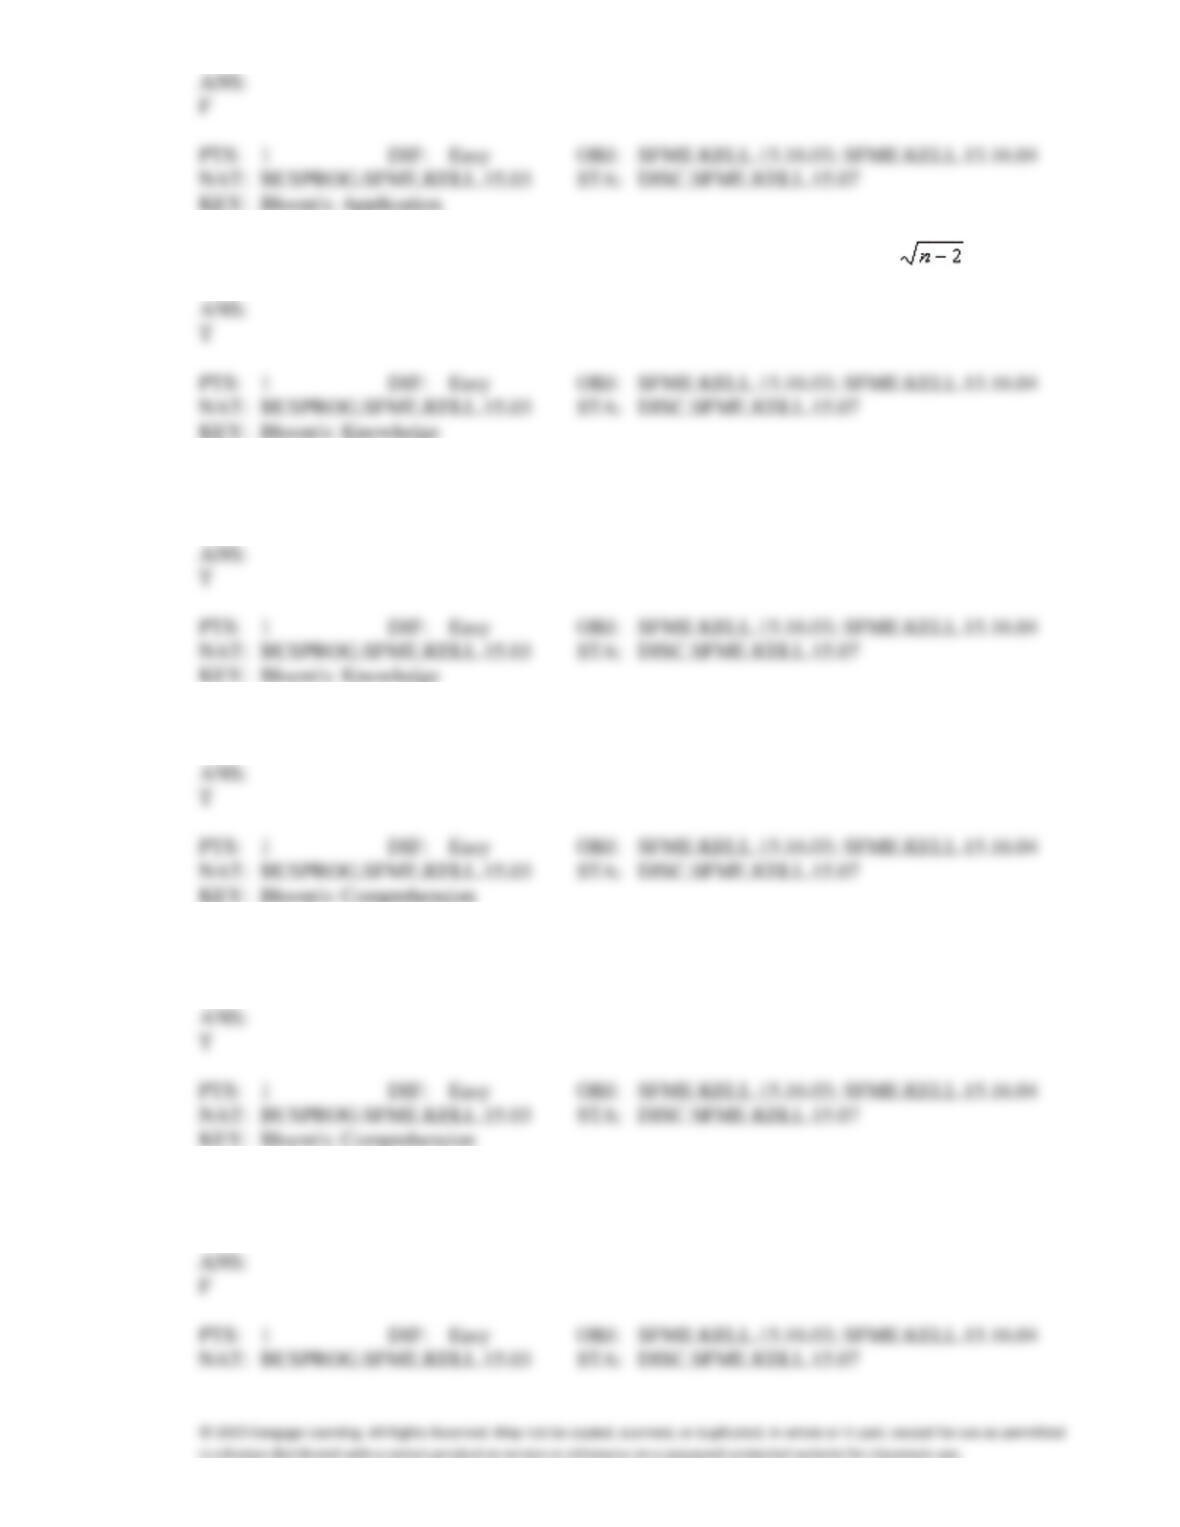
54. In a simple linear regression problem, the least squares line is , and the coefficient of
determination is 0.81. The coefficient of correlation must be −0.90.
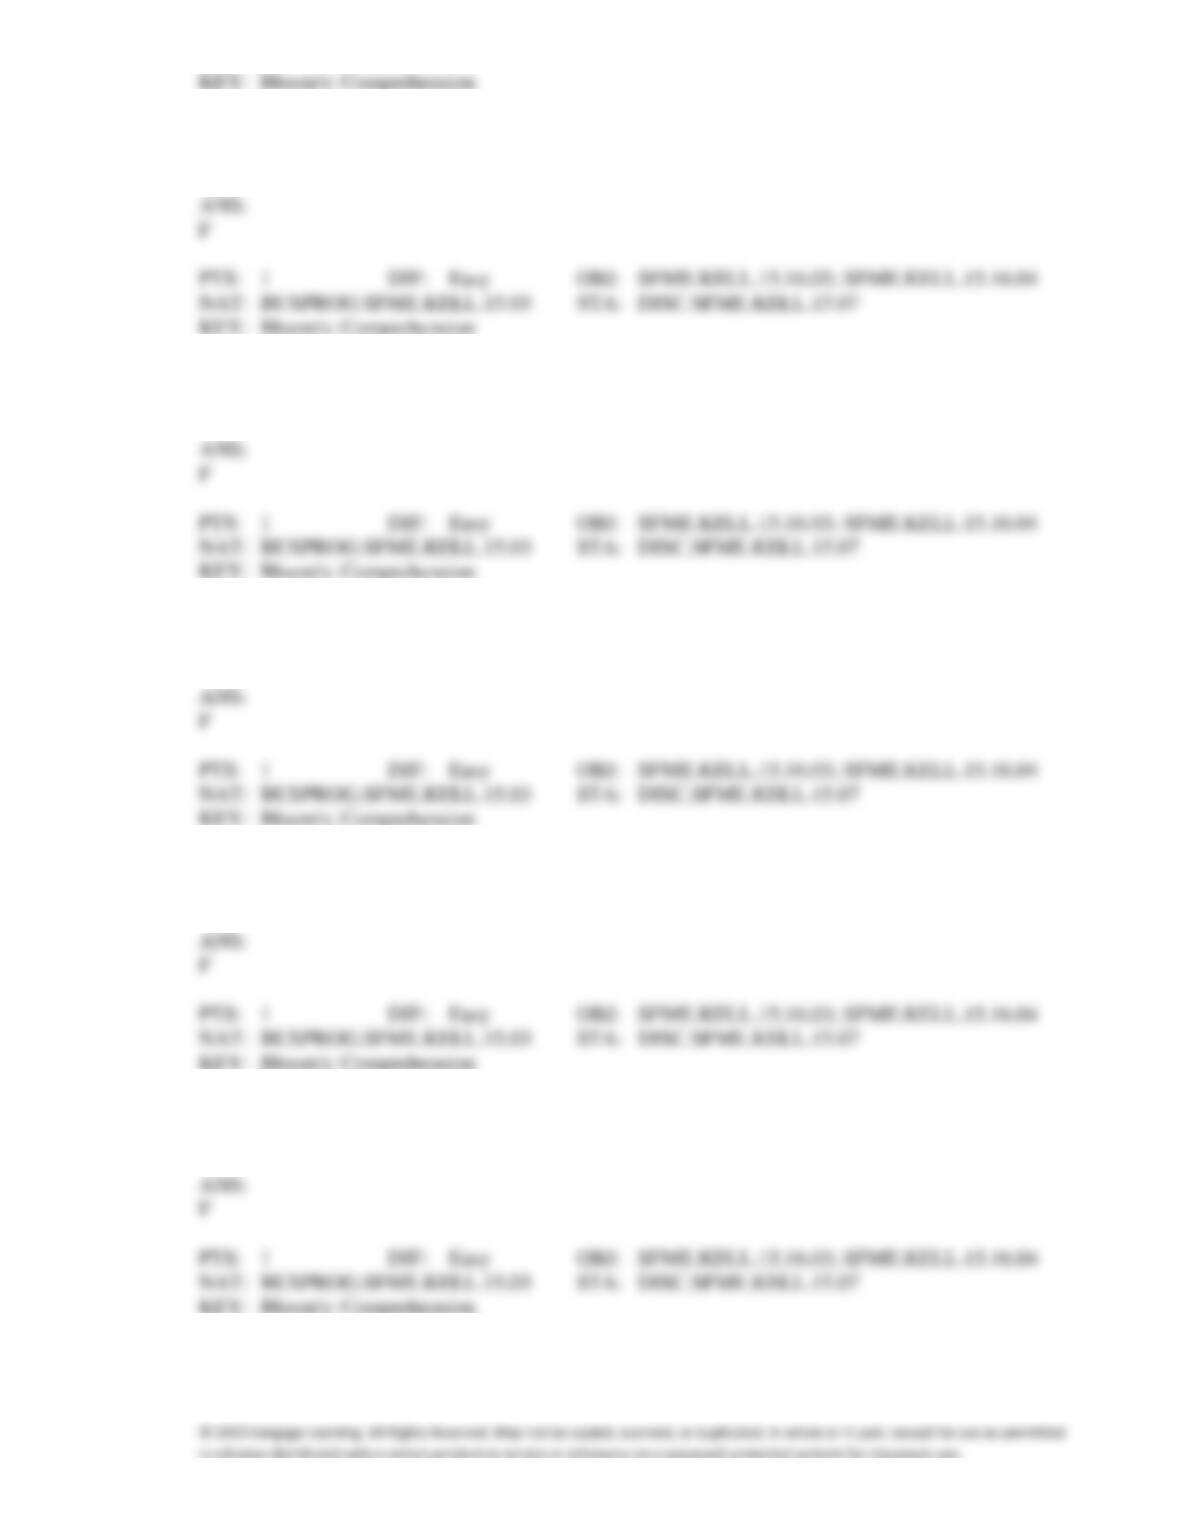
55. In simple linear regression, the denominator of the standard error of estimate s
is .
56. The value of the sum of squares for regression SSR can never be larger than the value of total sum of
squares SST.
57. If the coefficient of determination is 1.0, then the coefficient of correlation must be 1.0.
58. Correlation analysis is used to determine whether there is a linear relationship between an independent
variable x and a dependent variable y.
59. If the value of the sum of squares for error SSE equals zero, then the coefficient of determination must
equal zero.
60. If the coefficient of correlation is −0.81, then the percentage of the variation in y that is explained by
the regression line is 81%.
61. If all the points in a scatter diagram lie on the least squares regression line, then the coefficient of
correlation must be 1.0.
62. The probability distribution of the error variable
is normal, with mean E(
) = 0, and standard
deviation
=1.
63. If the coefficient of determination is 0.95, this means that 95% of the variation in the independent
variable x can be explained by the y variable.
64. If the coefficient of determination is 0.95, this means that 95% of the y values were predicted correctly
by the regression line.
65. If the error variable
is normally distributed, the test statistic for testing H0:
1 = 0 has a Student
t-distribution with n − 2 degrees of freedom.
66. The coefficient of determination is equal to the coefficient of correlation squared.
67. A zero correlation coefficient between a pair of random variables means that there is no linear
relationship between the random variables.
68. A zero population correlation coefficient for x and y means that there is no type of relationship
whatsoever between x and y.
69. A store manager gives a pre-employment examination to new employees. The test is scored from 1 to
100. He has data on their sales at the end of one year measured in dollars. He wants to know if there is
any linear relationship between pre-employment examination score and sales. An appropriate test to
use is the t-test of the population correlation coefficient.
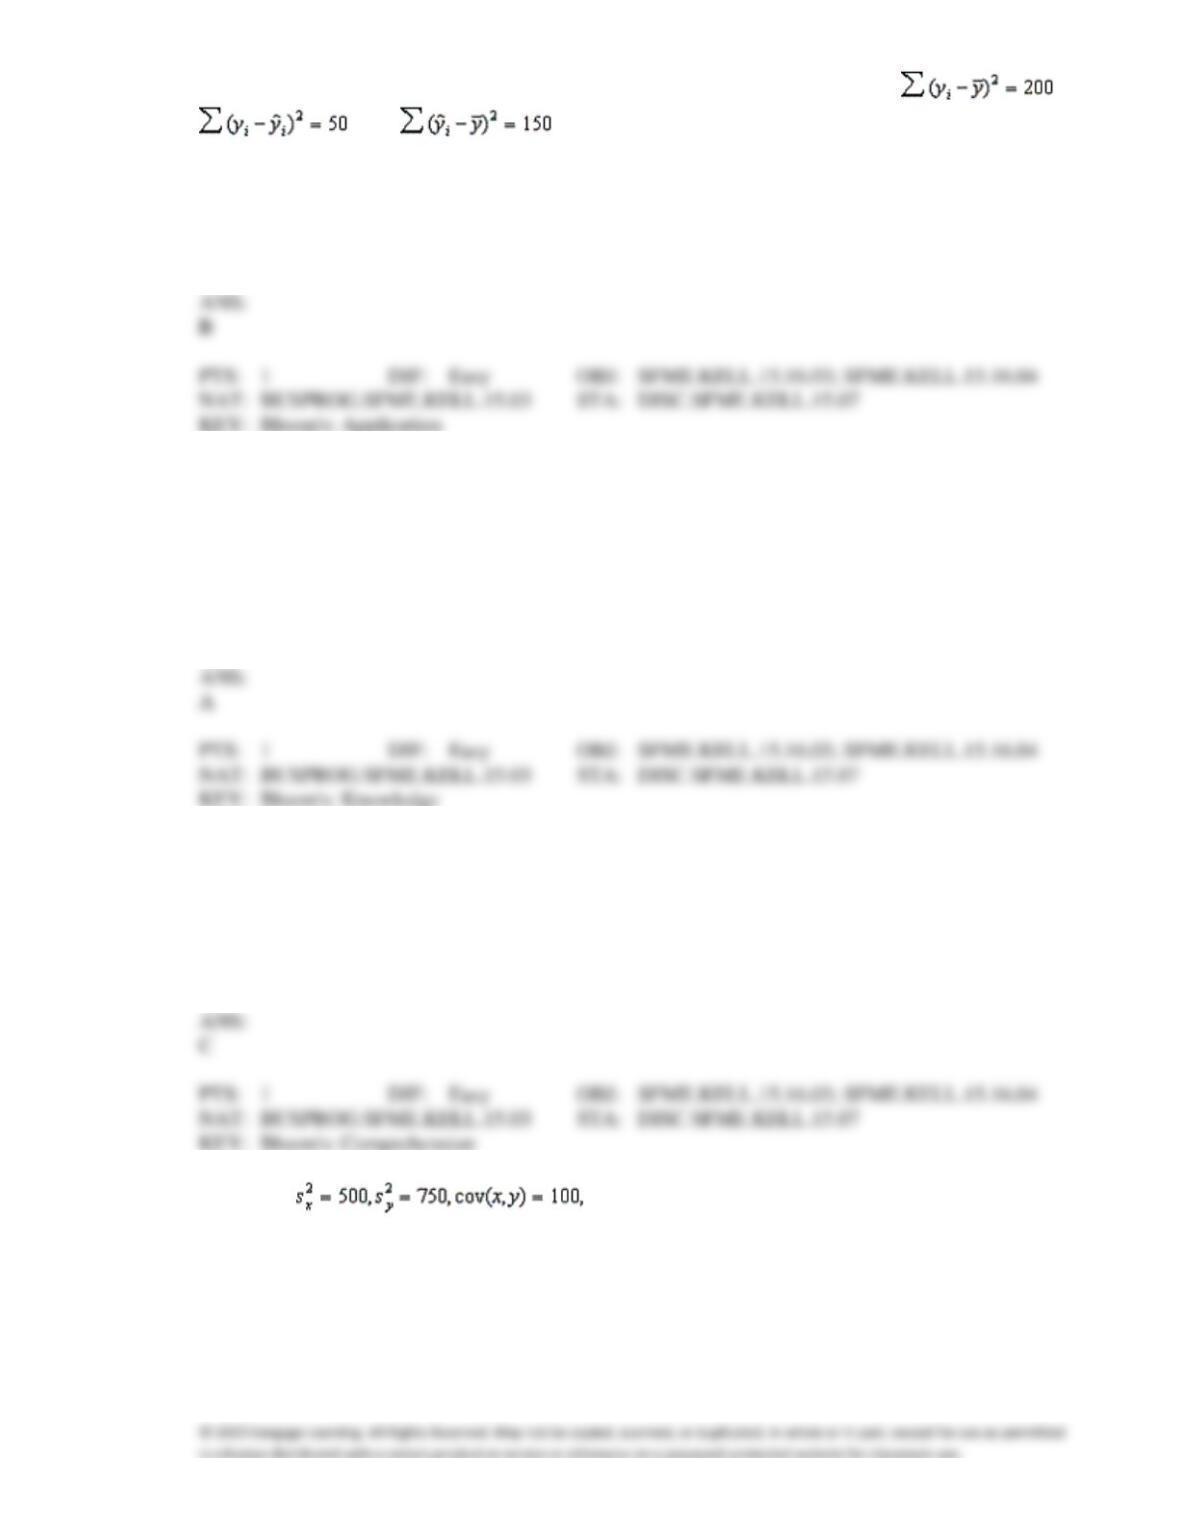
70. In a simple linear regression problem, the following sum of squares are produced: ,
, and . The percentage of the variation in y that is explained by the
variation in x is:
a.
25%
b.
75%
c.
33%
d.
50%
71. In simple linear regression, most often we perform a two-tail test of the population slope
1 to
determine whether there is sufficient evidence to infer that a linear relationship exists. The null
hypothesis is stated as:
a.
H0:
1 = 0
b.
H0:
1 = b1
c.
H0:
1 0
d.
None of these choices.
72. Testing whether the slope of the population regression line could be zero is equivalent to testing
whether the:
a.
sample coefficient of correlation could be zero
b.
standard error of estimate could be zero
c.
population coefficient of correlation could be zero
d.
sum of squares for error could be zero
73. Given that and n = 6, the standard error of estimate is:
a.
3,749.00
b.
937.25
c.
30.21
d.
None of these choices.
ANS:
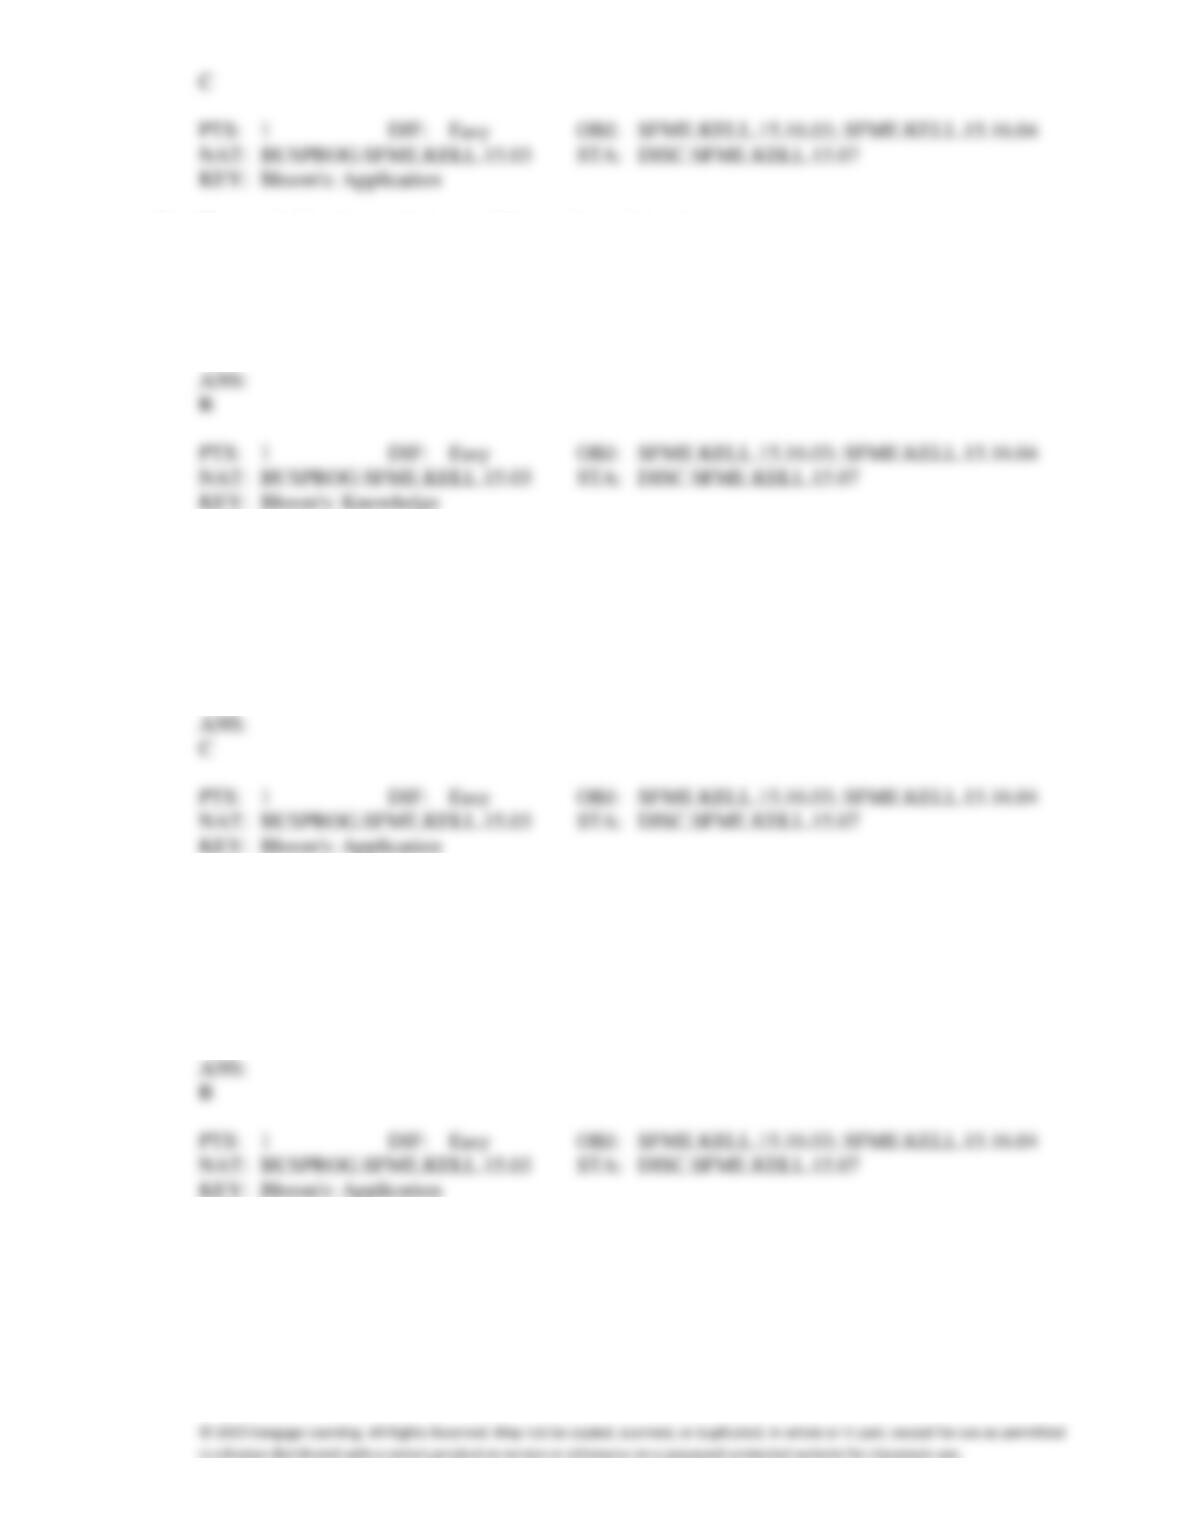
74. The symbol for the population coefficient of correlation is:
a.
r
b.
c.
r2
d.
2
75. Given that the sum of squares for error is 60 and the sum of squares for regression is 140, then the
coefficient of determination is:
a.
0.429
b.
0.300
c.
0.700
d.
None of these choices.
76. A regression line using 25 observations produced SSR = 118.68 and SSE = 56.32. The standard error
of estimate was:
a.
2.11
b.
1.56
c.
2.44
d.
None of these choices.
77. The symbol for the sample coefficient of correlation is:
a.
r
b.
c.
r2
d.
2
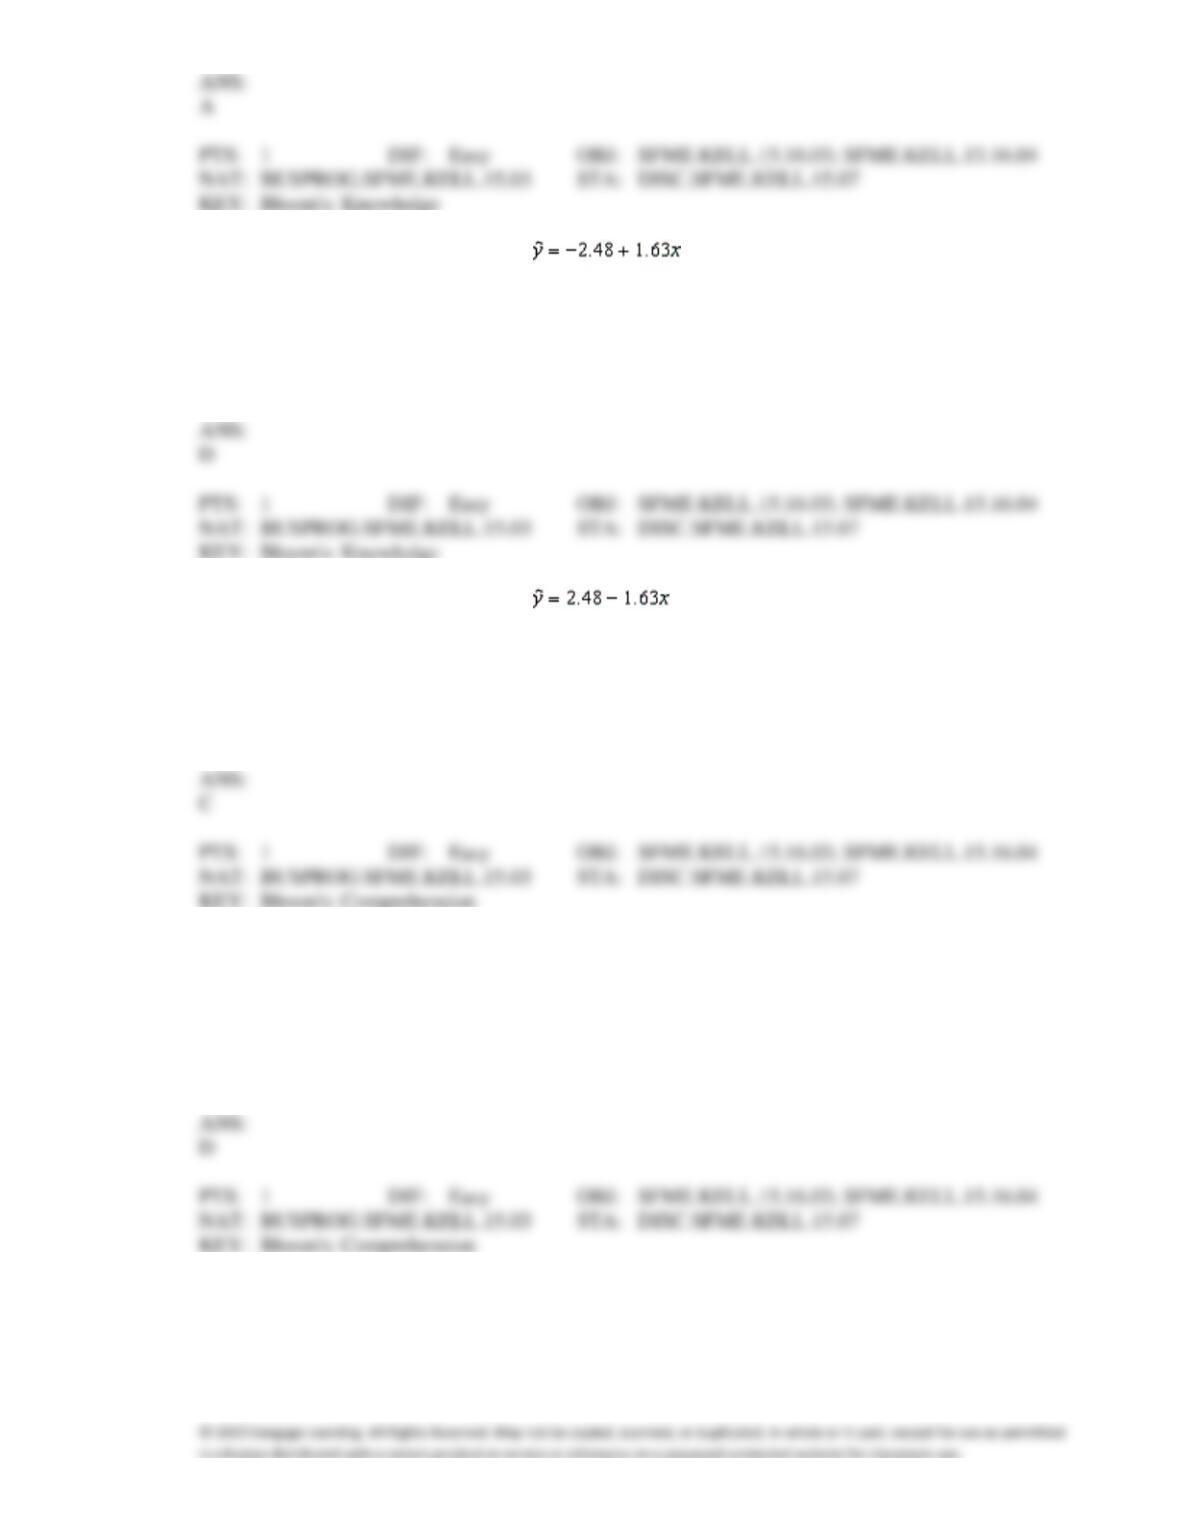
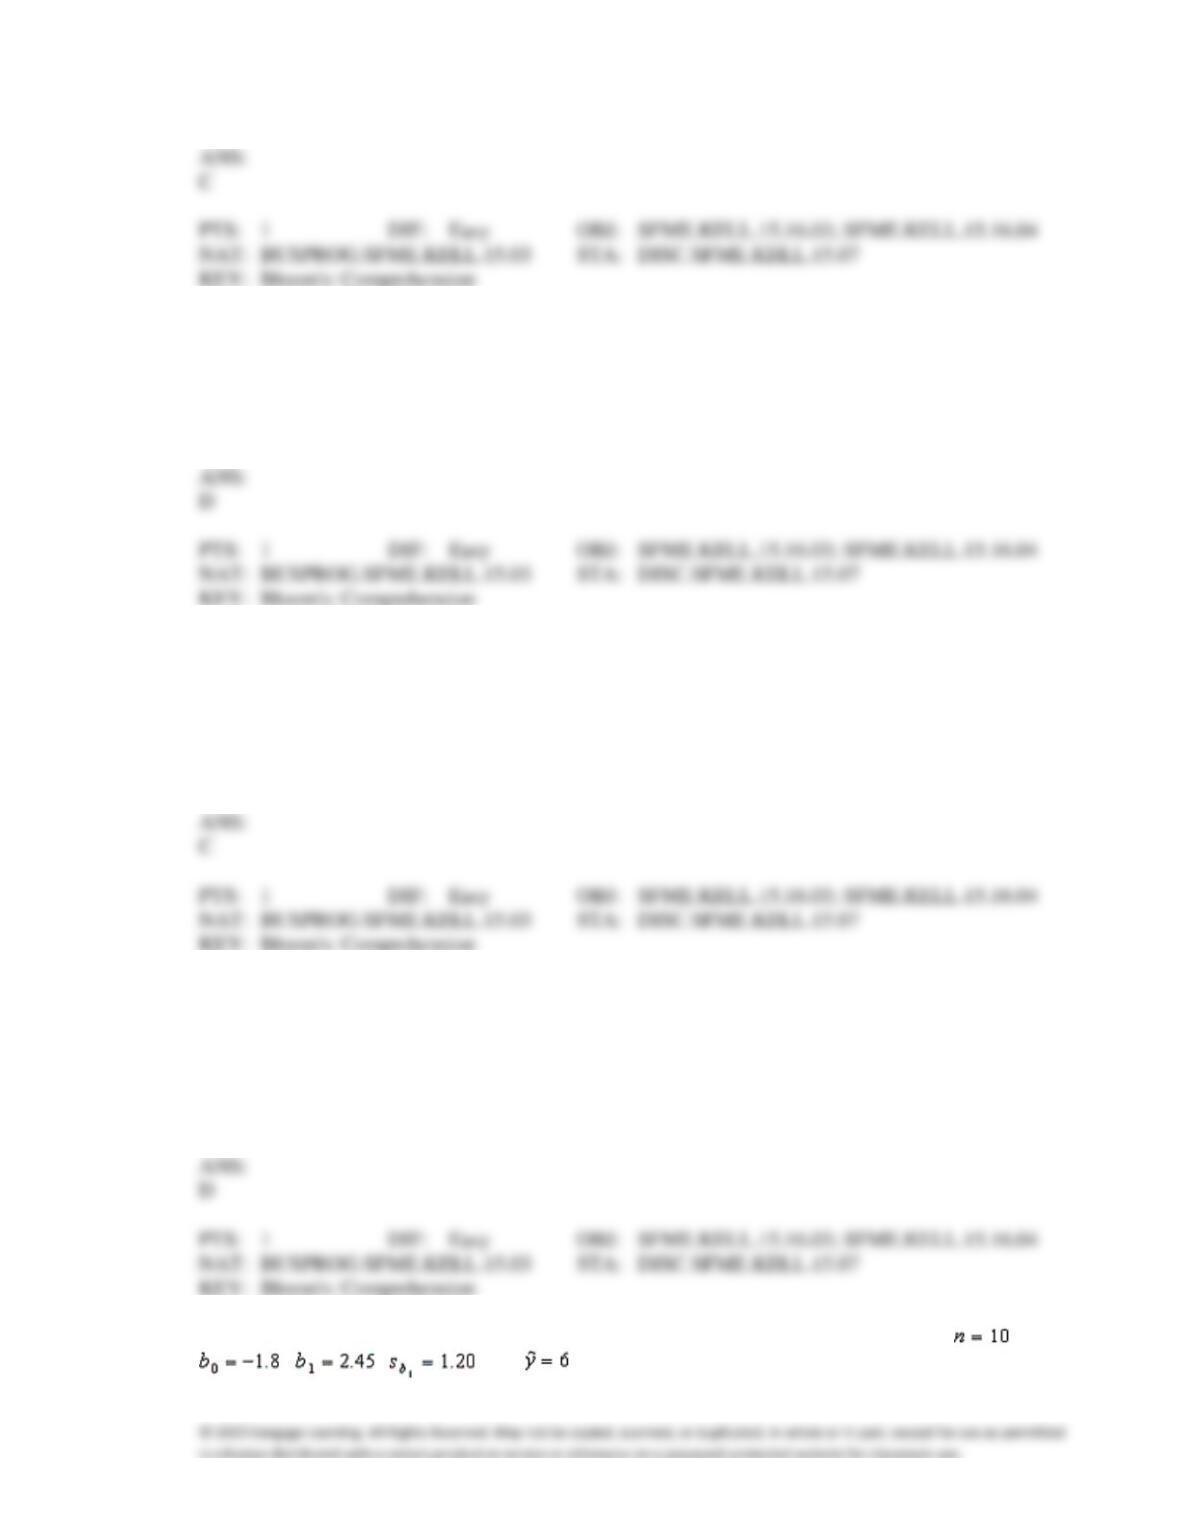
78. Given the least squares regression line , and a coefficient of determination of 0.81,
the coefficient of correlation is:
a.
−0.66
b.
0.81
c.
−0.90
d.
0.90
79. Given the least squares regression line , and a coefficient of determination of 0.81, the
coefficient of correlation is:
a.
−0.66
b.
0.81
c.
−0.90
d.
0.90
80. If the coefficient of determination is 0.975, then which of the following is true regarding the slope of
the regression line?
a.
All we can tell is that it must be positive.
b.
It must be 0.975.
c.
It must be 0.987.
d.
Cannot tell the sign or the value.
81. In regression analysis, if the coefficient of determination is 1.0, then:
a.
the sum of squares for error must be 1.0
b.
the sum of squares for regression must be 1.0
c.
the sum of squares for error must be 0.0
d.
the sum of squares for regression must be 0.0
82. The coefficient of correlation is used to determine:
a.
the strength and direction of the linear relationship between x and y.
b.
the least squares estimates of the regression parameters.
c.
the predicted value of y for a given value of x.
d.
All of these choices.
83. If the coefficient of correlation is −0.80, then the percentage of the variation in y that is explained by
the variation in x is:
a.
80%
b.
64%
c.
89%
d.
None of these choices.
84. If all the points in a scatter diagram lie on the least squares regression line, then the coefficient of
correlation must be:
a.
1.0
b.
−1.0
c.
either 1.0 or −1.0
d.
0.0
85. If the coefficient of correlation is −0.60, then the coefficient of determination is:
a.
−0.60
b.
−0.36
c.
0.36
d.
0.77
86. If the coefficient of correlation between x and y is close to 1.0, this indicates that:
a.
y causes x to happen.
b.
x causes y to happen.
c.
both a and b.
d.
there may or may not be a causal relationship between x and y.
87. When all the actual values of y are equal to their predicted values, the standard error of estimate will
be:
a.
1.0
b.
−1.0
c.
0.0
d.
None of these choices.
88. Which of the following statistics and procedures can be used to determine whether a linear model
should be employed?
a.
The standard error of estimate.
b.
The coefficient of determination.
c.
The t-test of the slope.
d.
All of these choices are true.
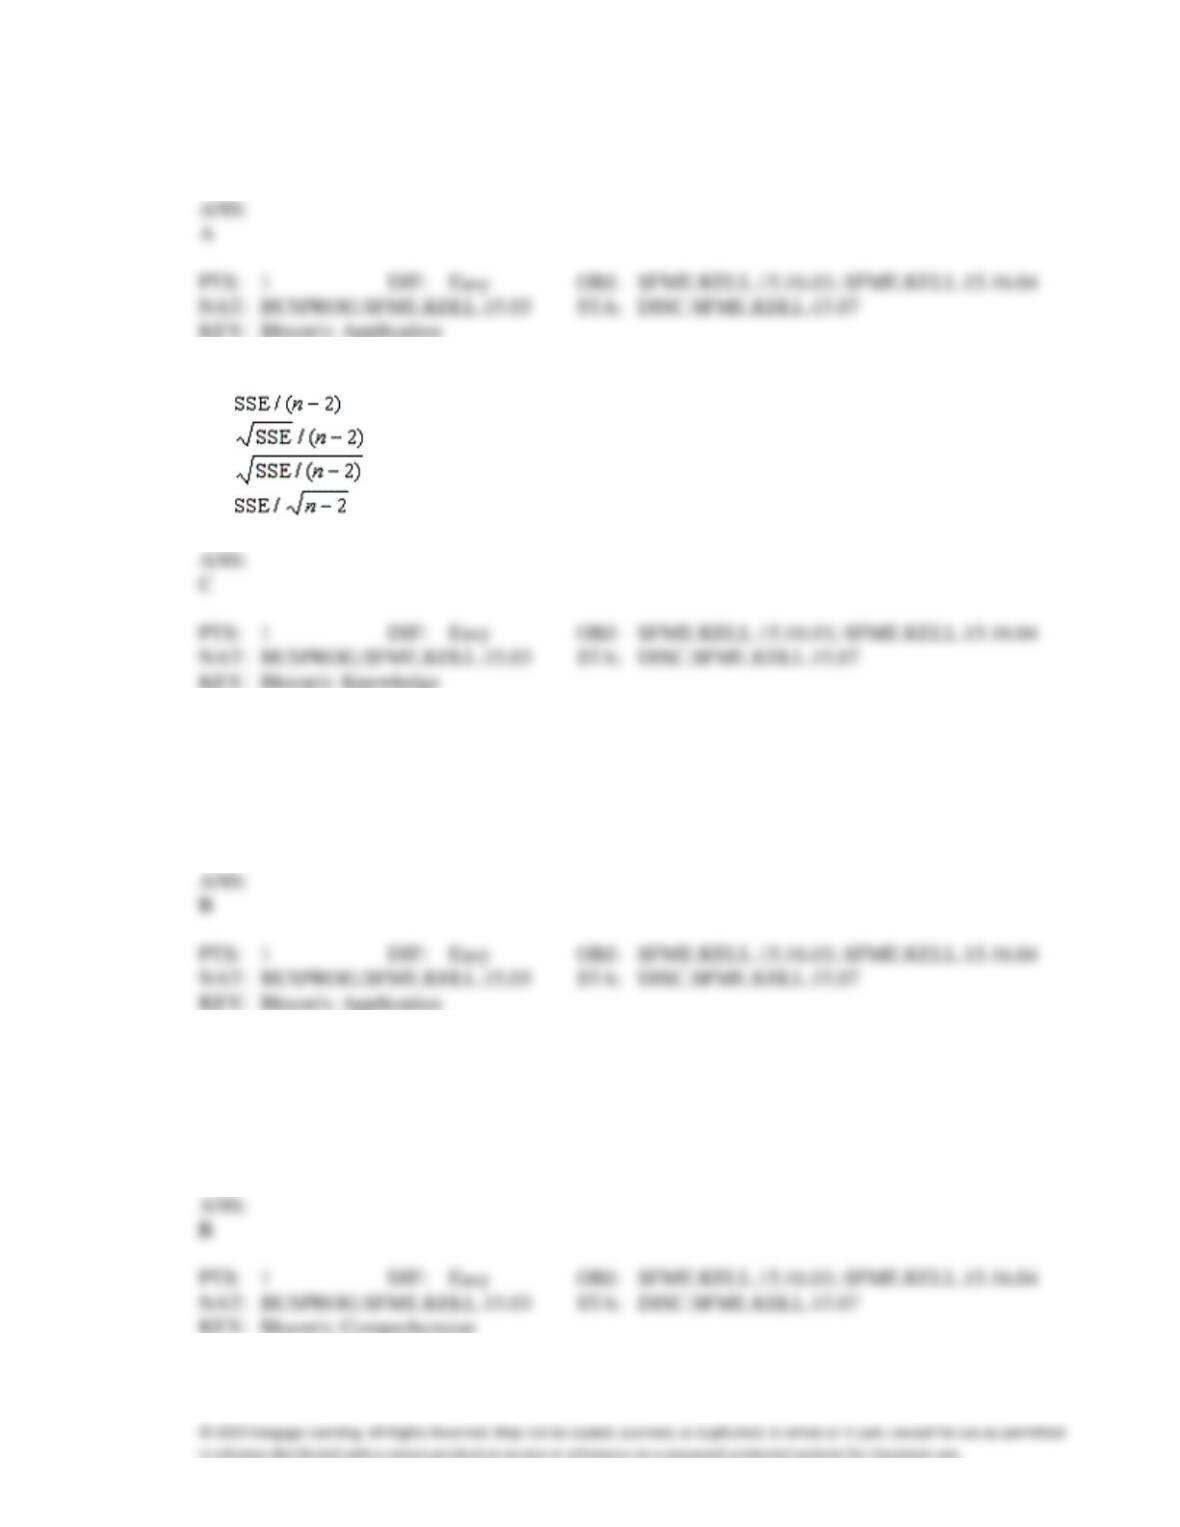
89. In testing the hypotheses: H0:
1 = 0 vs. H0:
1 0, the following statistics are available: ,
, , , and . The value of the test statistic is:
a.
2.042
b.
0.306
c.
−1.50
d.
−0.300
90. The standard error of estimate s is given by:
a.
b.
c.
d.
91. If the standard error of estimate s = 20 and n = 10, then the sum of squares for error, SSE, is:
a.
400
b.
3,200
c.
4,000
d.
40,000
92. The smallest value that the standard error of estimate s can assume is:
a.
−1
b.
0
c.
1
d.
−
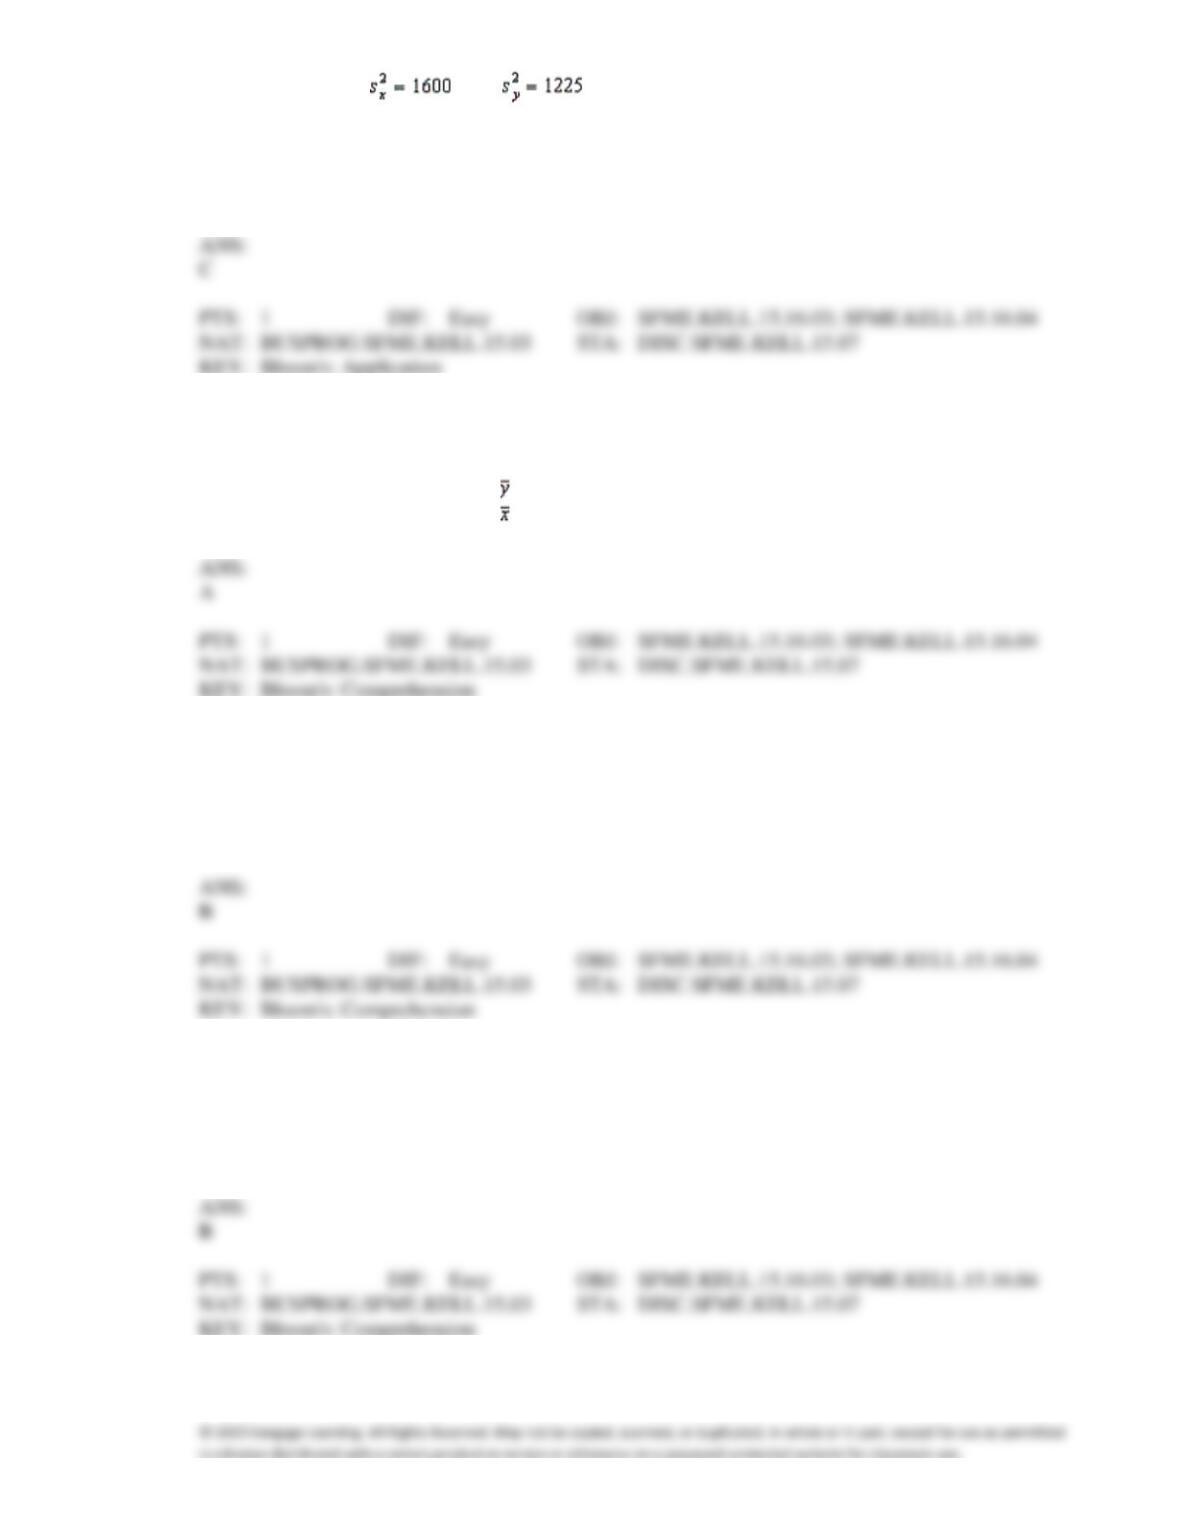
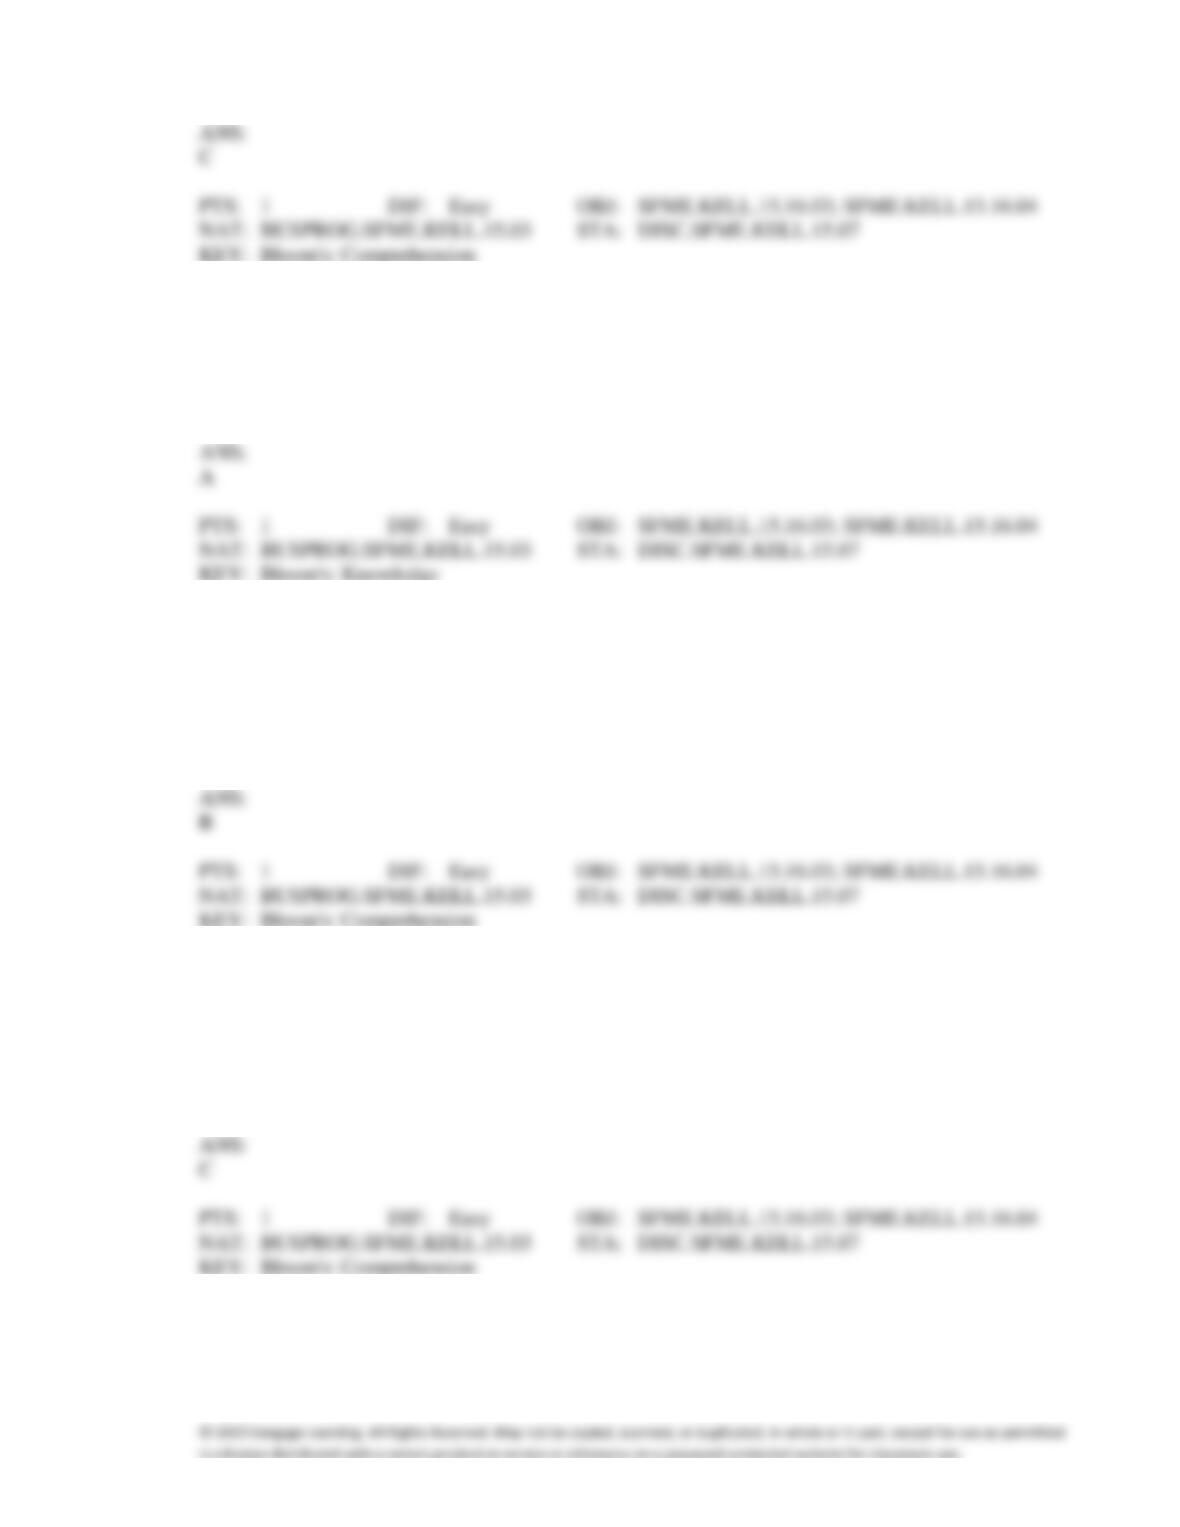
93. If cov(x, y) = 1260, , and , then the coefficient of determination is:
a.
0.90
b.
1.23
c.
0.81
d.
0.006
94. The standard error of estimate s is a measure of the:
a.
variation of y around the regression line.
b.
variation of x around the regression line.
c.
variation of y around the mean .
d.
variation of x around the mean .
95. The Pearson coefficient of correlation r equals one when there is no:
a.
linear relationship between x and y.
b.
unexplained variation.
c.
y-intercept in the model.
d.
slope in the model.
96. In regression analysis, the coefficient of determination R2 measures the amount of variation in y that is:
a.
caused by the variation in x.
b.
explained by the variation in x.
c.
unexplained by the variation in x.
d.
None of these choices.
97. If we are interested in determining whether two variables are linearly related, it is necessary to:
a.
perform the t-test of the slope
1.
b.
perform the t-test of the coefficient of correlation
.
c.
either a or b since they are identical.
d.
None of these choices.
98. In a regression problem the following pairs of (x, y) are given: (3, 1), (3, −1), (3, 0), (3, −2) and (3, 2).
That indicates that the:
a.
correlation coefficient is −1/2.
b.
correlation coefficient is 0.
c.
correlation coefficient is 1.
d.
coefficient of determination is 3.
99. In a regression problem, if the coefficient of determination is 0.95, this means that:
a.
95% of the y values are positive.
b.
95% of the variation in y can be explained by the variation in x.
c.
95% of the y values are predicted correctly by the model.
d.
None of these choices.
100. The sample correlation coefficient between x and y is 0.375. It has been found out that the p-value is
0.256 when testing H0:
= 0 against the two-sided alternative H1:
0. To test H0:
= 0 against the
one-sided alternative H1:
> 0 at a significant level of 0.193, the p-value will be equal to
a.
0.128
b.
0.512
c.
0.744
d.
0.872
101. In simple linear regression, which of the following statements indicates there is no linear relationship
between the variables x and y?
a.
Coefficient of determination is −1.0.
b.
Coefficient of correlation is 0.0.
c.
Sum of squares for error is 0.0.
d.
None of these choices.
102. If the sum of squared residuals is zero, then the:
a.
coefficient of determination must be 1.0.
b.
coefficient of correlation must be 1.0.
c.
linear relationship between x and y is perfect.
d.
All of these choices are true.
103. If the standard error of estimate is zero, then:
a.
the coefficient of determination must be 1.0.
b.
all the points fall on the regression line.
c.
there is no unexplained variation left.
d.
All of these choices are true.
104. The standard error of the estimate is a measure of the:
a.
total variation in the y variable.
b.
variation around the regression line.
c.
percentage of variation in y explained by the variation in x.
d.
the variation of the x variable.
105. In simple linear regression, the coefficient of correlation r and the least squares estimate b1 of the
population slope
1:
a.
must be equal.
b.
must have the same sign.
c.
are not related.
d.
None of these choices.
106. In performing a regression analysis which of the following must be true about the distribution of the
error variable?
a.
The distribution is normal with mean zero.
b.
The errors associated with one y value are independent of errors associated with another y
value.
c.
The standard deviation is constant for each value of x.
d.
All of these choices are true.
107. Which of the following assumptions concerning the probability distribution of the random error term is
stated incorrectly?
a.
The distribution is normal.
b.
The mean of the distribution is 0.
c.
The variance of the distribution increases as x increases.
d.
The errors are independent from one value of y to the next.
108. In a simple linear regression problem, r and b0:
a.
must be equal to each other.
b.
must have the same sign.
c.
must have opposite signs.
d.
are not related.
109. If the coefficient of correlation is 0.90, then the percentage of the variation in the dependent variable y
that is explained by the variation in the independent variable x is:
a.
90%
b.
81%
c.
95%
d.
None of these choices.
110. For a regression analysis to be valid, the error variable must have a(n) ____________________
distribution.
111. For a regression analysis to be valid, the error variable must have a mean of ____________________.
112. For a regression analysis to be valid, the error variable must have a standard deviation that is
____________________ regardless of the value of x.
113. For a regression analysis to be valid, the value of the error variable associated with any particular
value of y is ____________________ of the value of the error variable associated with any other value
of y.
114. If the standard error of estimate is ____________________, this implies that the model’s fit is poor.
115. The unbiased estimator of the variance of the error variable is found by taking
____________________ divided by n − 2.
116. If the regression line is horizontal, then we conclude that y ____________________ (is/is not) related
to x.
117. If the regression line is horizontal, the slope is ____________________ and x and y are not related.
118. The degrees of freedom for the test statistic for the slope is ____________________.