b
2.33
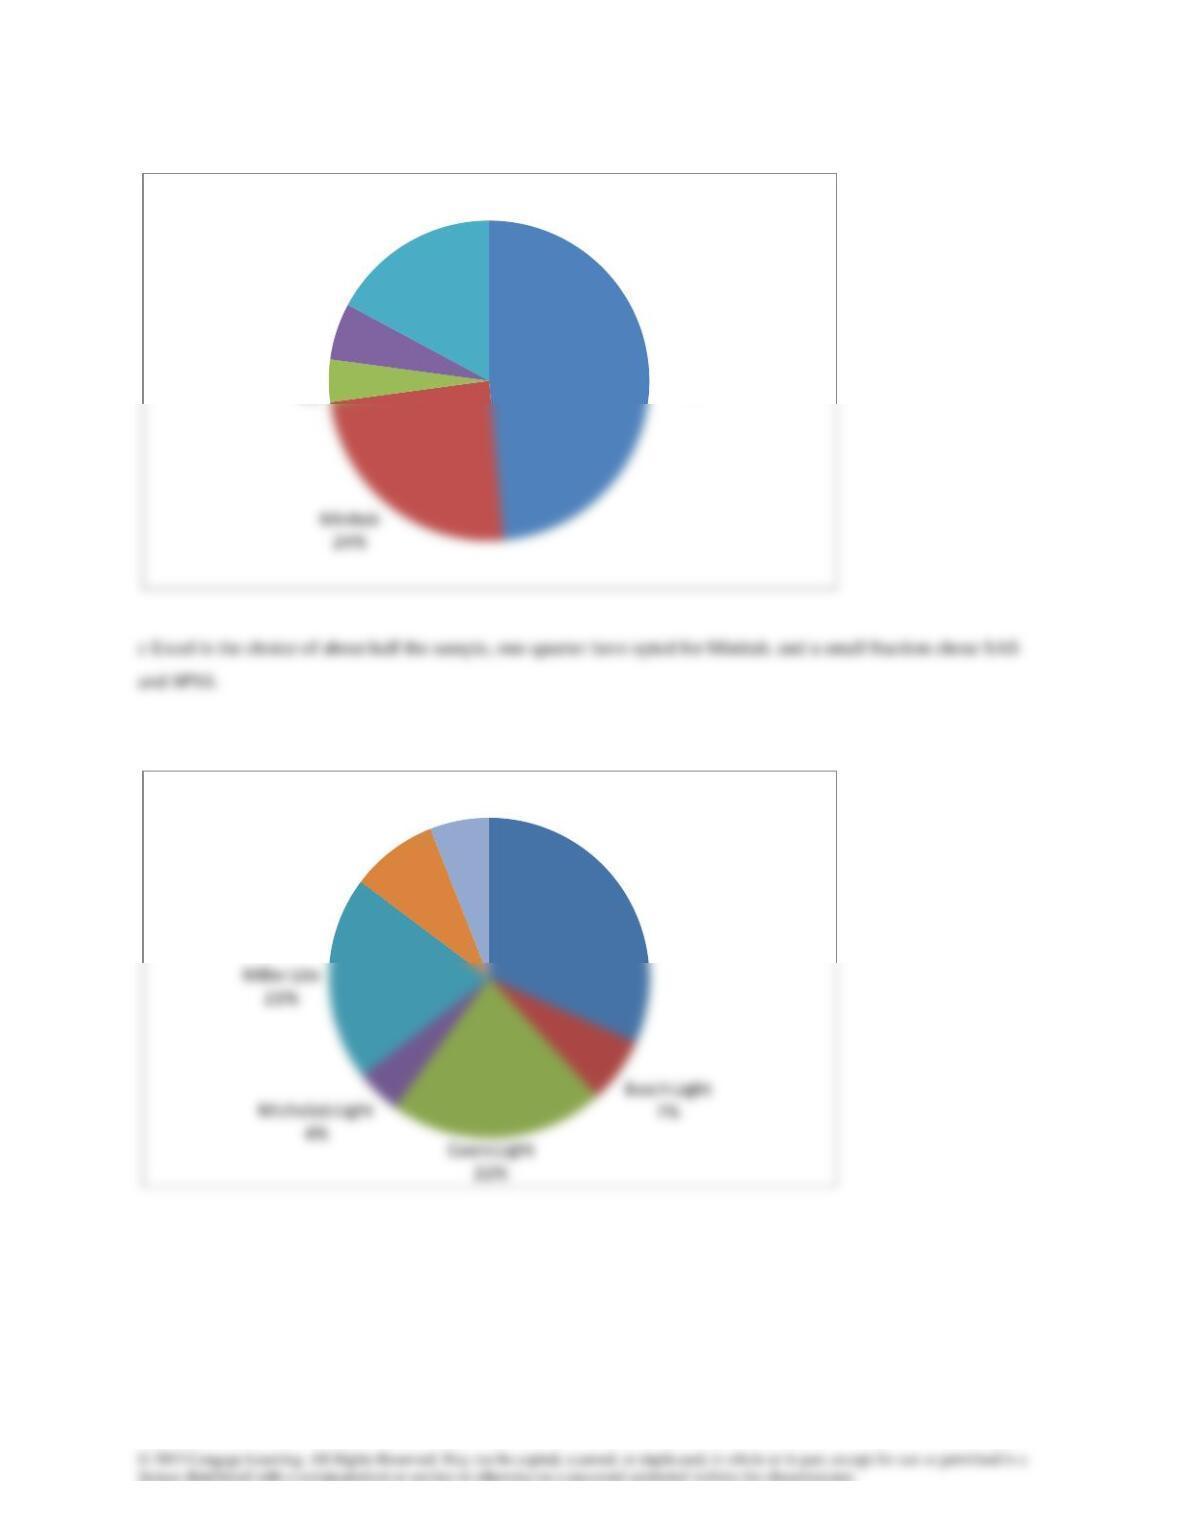
Excel
49%
SAS
4%
SPSS
6%
Other
17%
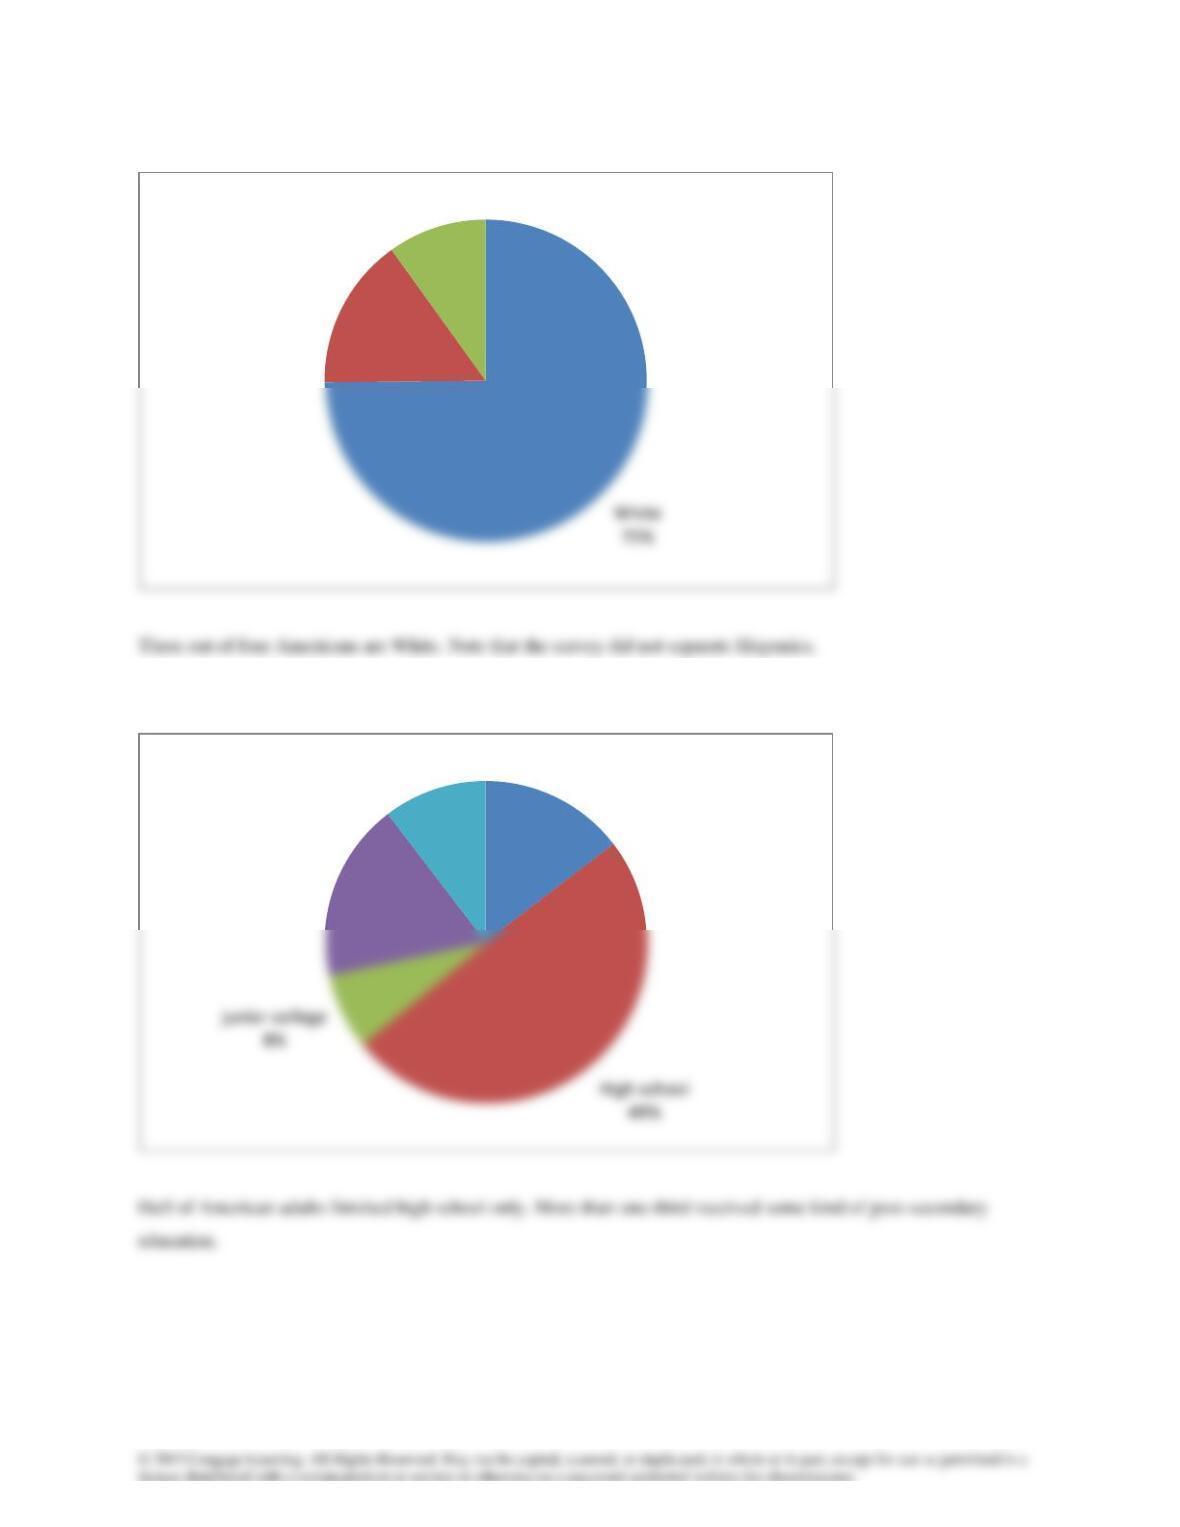
Bud Light
31%
Natural Light
9%
Other
6%
2.34
2.35
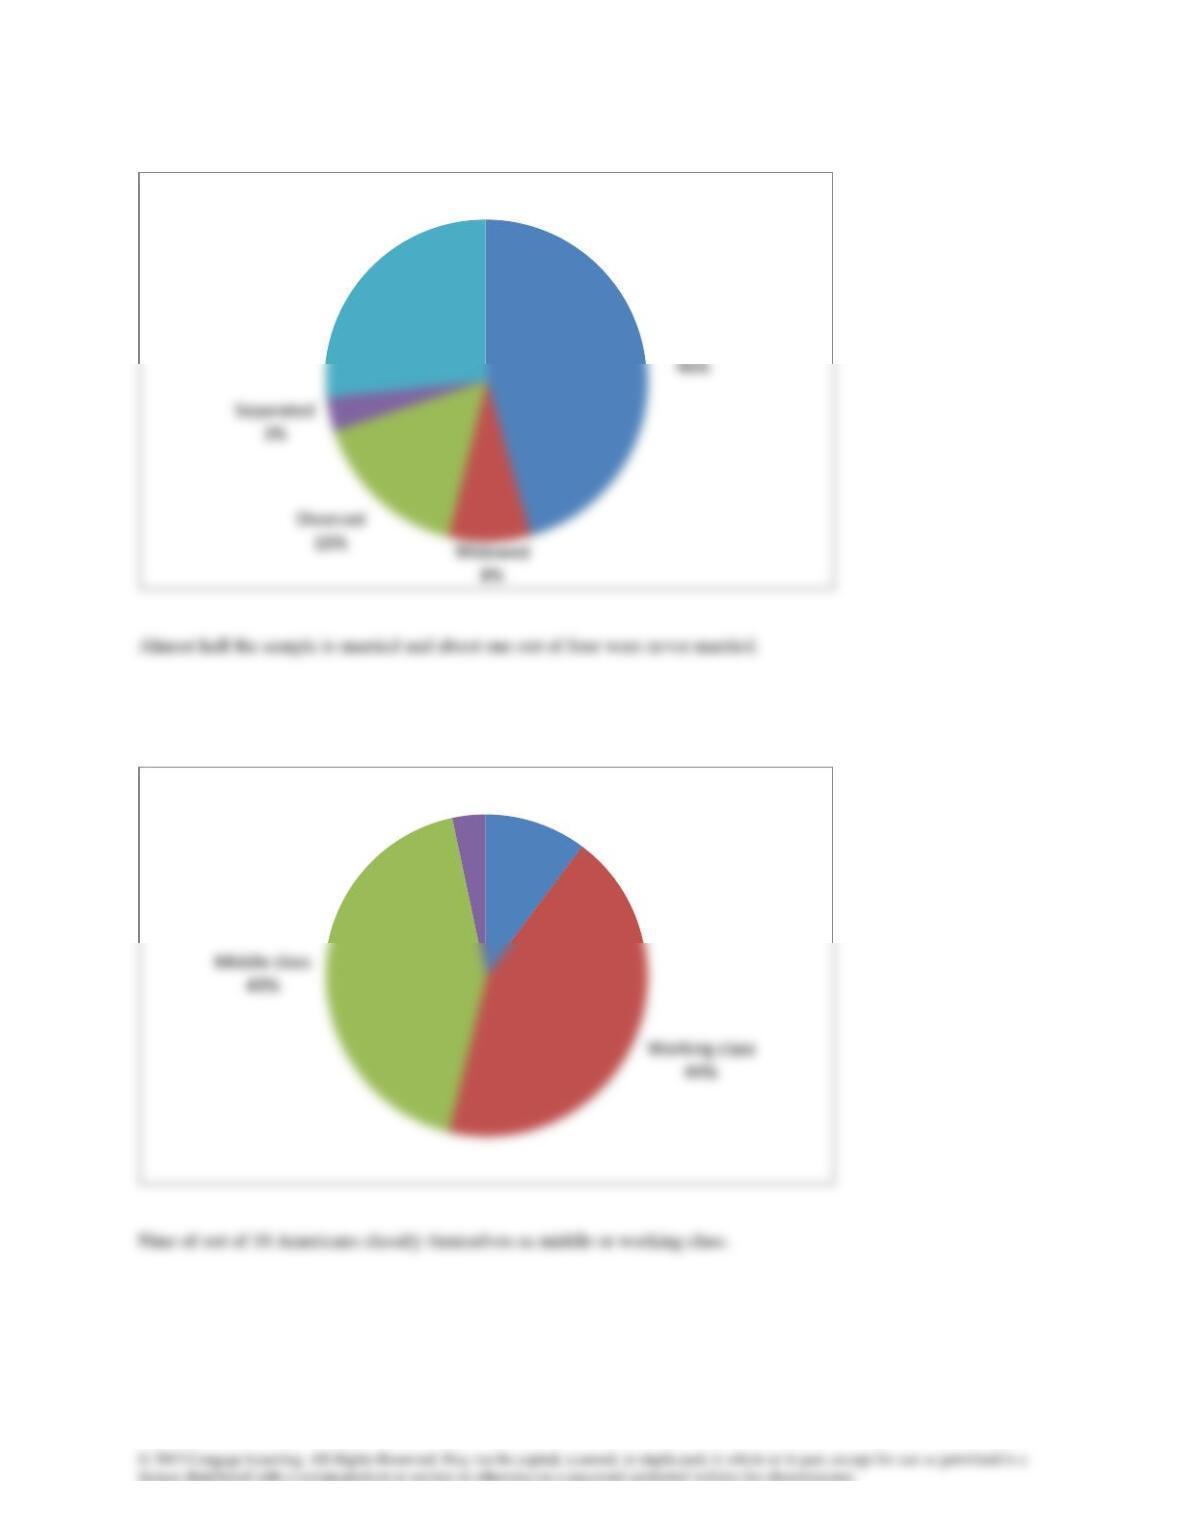
Black
15%
Other
10%
Left high school
15%
Bachelor’s
degree
18%
Graduate
degree
10%
2.36
2.37
Married
Never married
27%
Lower class
10%
Upper class
3%
2.38
2.39
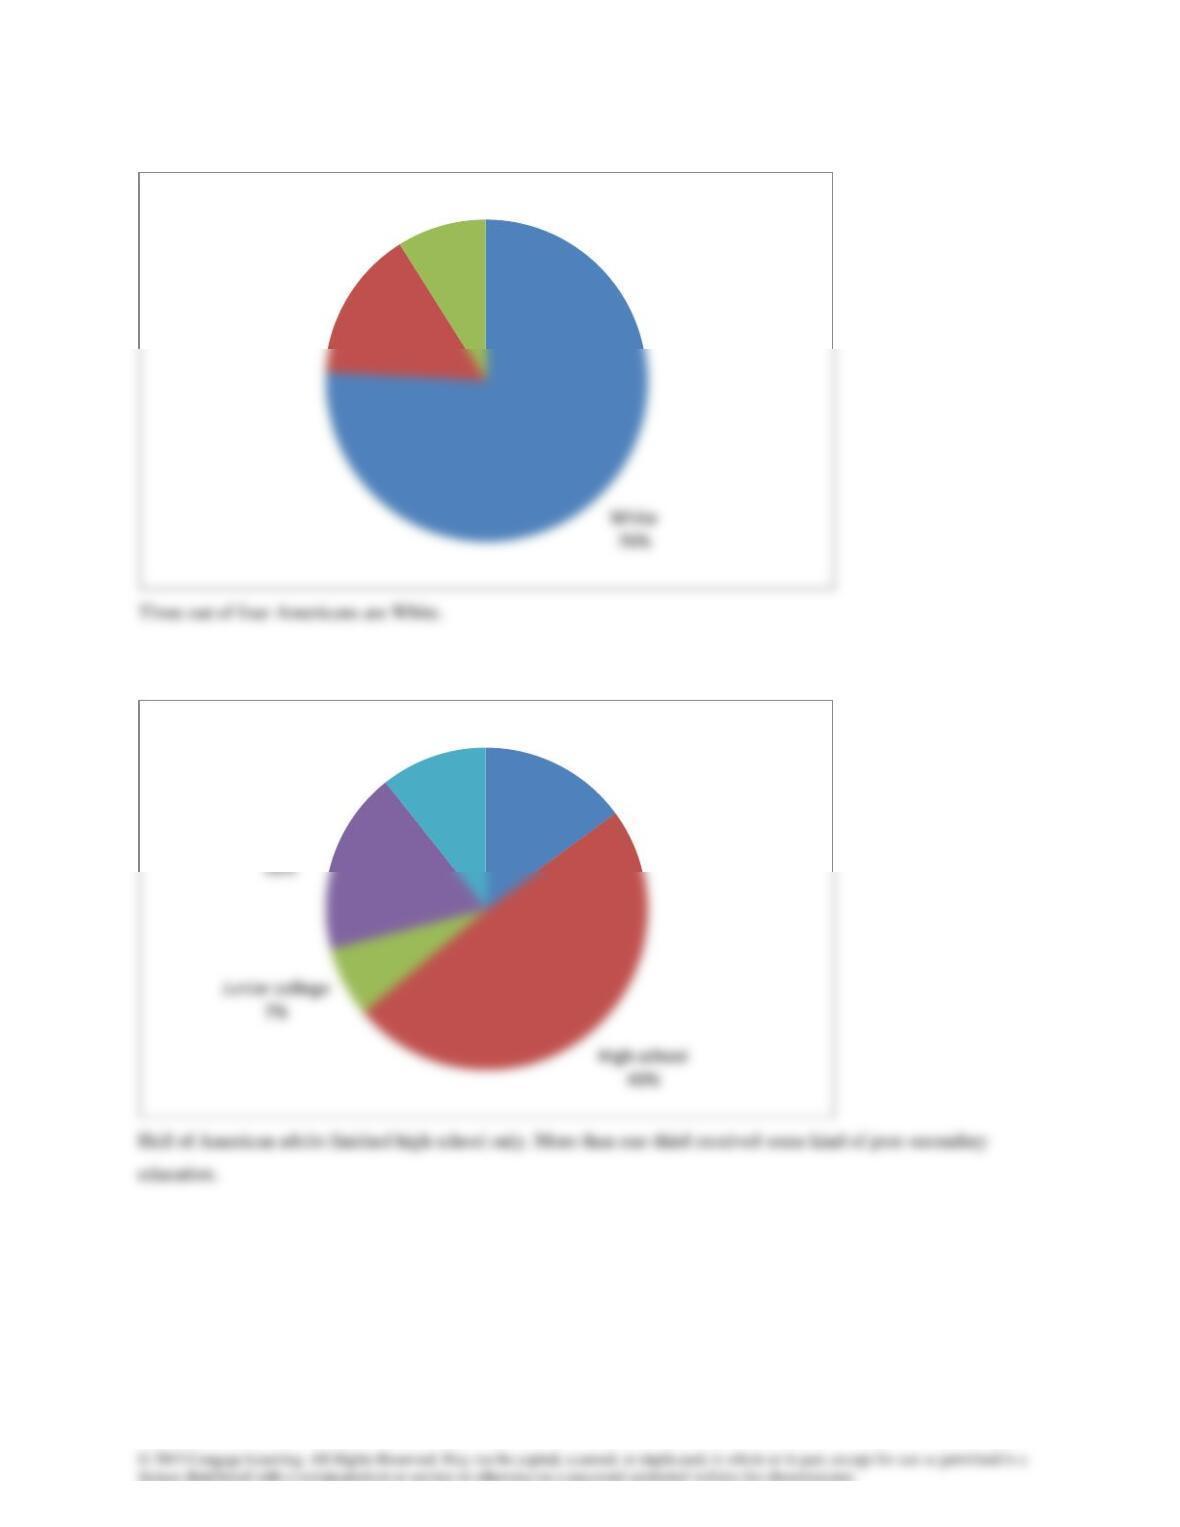
Blck
15%
Other
9%
Left high school
15%
Bachelor’s
degree
Graduate
degree
11%
2.40
2.41
30,000
35,000
40,000
45,000
50,000
Less than high school
80,000
100,000
120,000
140,000
160,000
180,000
1995
2.42 Australian Energy Sources
New Zealand Energy Sources
Nuclear
0.0%
Hydroelectric
1.2%
Biomass
4.1%
Other
0.3%
Coal
7.0%
Oil
Hydroelectric
Biomass
4.4%
Other
15.1%
2.43
2.44
100
150
200
250
300
350
Year 1995
Year 2000
Year 2005
30
40
50
60
B.A.
B.Eng
B.B.A.
2.45
The column proportions are similar; the two nominal variables appear to be unrelated. There does not appear to be
any brand loyalty.
2.46
The two variables are related.
2.47
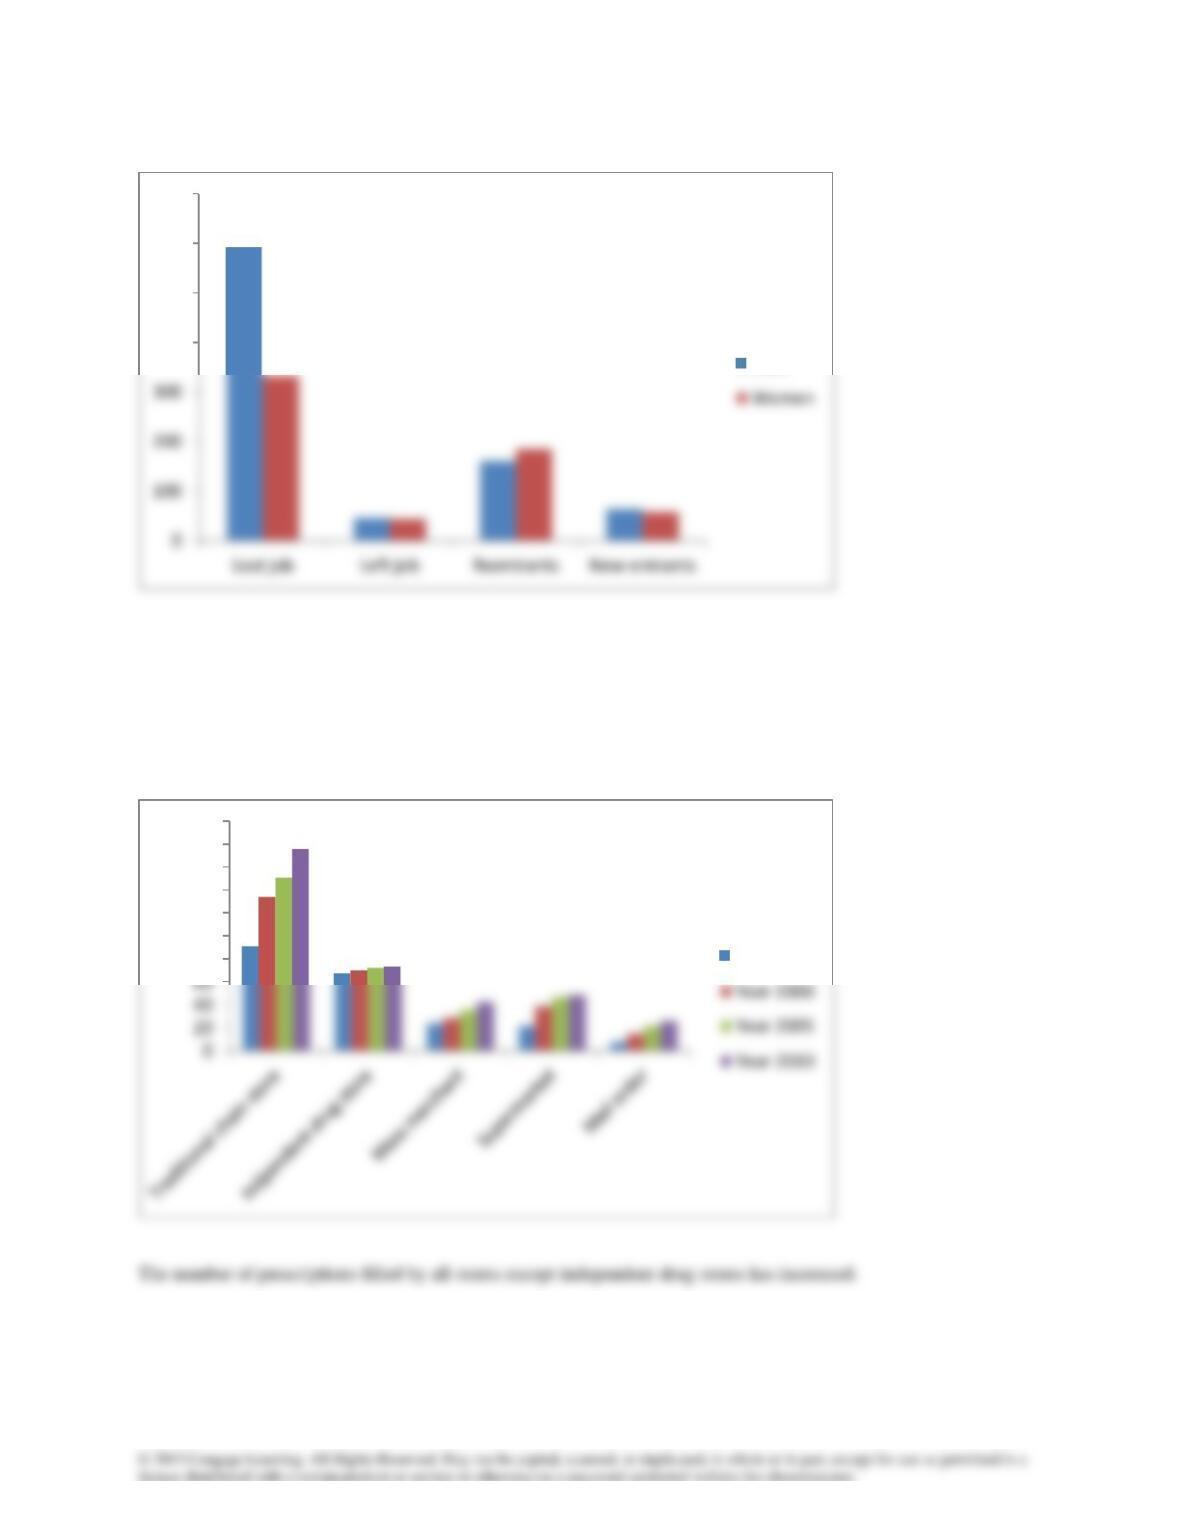
There are large differences between men and women in terms of the reason for unemployment.
2.48
400
500
600
700
Men
80
100
120
140
160
180
200
Year 1995
2.49
2.50
20%
25%
30%
35%
40%
Poor
15%
Very good
10%
Excellent
3%
2.51
2.52 Canada
Manual
18%
Computer
44%
Yahoo
15%
Other
11%
United States
2.53
Google
36%
Other
18%
Strongly
disagree
15%
Disagree
Agree
23%
Strongly agree
4%
2.54
2.55
20%
25%
30%
35%
40%
45%
Children
10.0
20.0
30.0
40.0
50.0
Manufacturers
Services
2.56
2,000,000,000,000
3,000,000,000,000
4,000,000,000,000
5,000,000,000,000
6,000,000,000,000
U.S. Individuals and
Institutions
Japan
Oil Exporters
2%
Brazil
2%
United Kingdom
1%
All Other
Countries
15%
2.57
b
Area and job satisfaction are related. Graduates who work in finance and general management appear to be more
satisfied than those in accounting, marketing/sales, and others.
15
20
25
30
35
40
45
15
20
25
30
35
40
Very satisfied