34. In regression analysis, a nominal independent variable such as color, with three different categories
such as red, white, and blue, is best represented by three indicator variables to represent the three
colors.
35. In regression analysis, indicator variables are also called dependent variables.
36. In general, to represent a nominal independent variable that has c possible categories, we would create
(c − 1) dummy variables.
37. When a dummy variable is included in a multiple regression model, the interpretation of the estimated
slope coefficient does not make any sense anymore.
38. In order to represent a nominal variable with m categories, we must create m − 1 indicator variables.
39. The last category represented by I1 = I2 = …..Im
−
1 = 0 is called the omitted category.
40. Dummy variables are variables that can take on only two values (namely, 0 or 1) and that are used to
indicate the absence or presence of a particular nominal characteristic.
41. In explaining the amount of money spent on children’s shoes each month, which of the following
independent variables is best represented with an indicator variable?
a.
Gender
b.
Height
c.
Age
d.
Weight
42. In explaining students’ test scores, which of the following independent variables would not best be
represented with indicator variables?
a.
Gender
b.
Race
c.
Number of hours studying for the test
d.
Marital status
43. In explaining starting salaries for graduates of psychology programs, which of the following
independent variables would not best be represented with dummy variables?
a.
Marital status
b.
Grade point average
c.
Race
d.
Gender
44. In explaining the income earned by college graduates, which of the following independent variables is
best represented by a dummy variable?
a.
Grade point average
b.
Age
c.
Number of years since graduating from high school
d.
College major
45. If a nominal independent variable has 4 possible categories, the number of dummy variables needed to
uniquely represent these categories is:
a.
5.
b.
4.
c.
3.
d.
2.
46. An indicator variable is a variable that can assume:
a.
one of two values (usually 0 and 1).
b.
one of three values (usually 0, 1, and 2).
c.
any number of values.
d.
None of these choices.
47. An indicator variable is also called:
a.
a response variable.
b.
a dummy variable.
c.
a predictor variable.
d.
a dependent variable.
48. In general, to represent a nominal independent variable that has m possible categories, we must create:
a.
(m + 1) indicator variables.
b.
m indicator variables.
c.
(m − 1) indicator variables.
d.
(m − 2) indicator variables.
49. In regression analysis, indicator variables allow us to incorporate:
a.
interval variables into the model.
b.
nominal variables into the model.
c.
first-order variables into the model.
d.
None of these choices.
50. If a nominal independent variable contains 5 categories, the number of dummy variables needed to
uniquely represent these categories is:
a.
0.
b.
4.
c.
5.
d.
None of these choices.
51. Suppose that we want to model the randomized block design of the analysis of variance with, say, one
nominal variable with three categories and one nominal variable with four categories. We would
create:
a.
7 indicator variables.
b.
6 indicator variables.
c.
5 indicator variables.
d.
11 indicator variables.
52. A dummy variable is used as an independent variable in a regression model when:
a.
the variable involved is interval.
b.
the variable involved is nominal.
c.
a curvilinear relationship is suspected.
d.
two independent variables interact.
53. We can incorporate any nominal variable into regression analysis by creating one or more dummy
variables, also known as:
a.
dependent variables.
b.
response variables.
c.
indicator variables.
d.
None of these choices.
54. Which of the following statements about dummy variables is false?
a.
We can incorporate any nominal variable into regression analysis by creating one or more
dummy variables.
b.
Dummy variables are also known as binary variables, nominal variables, or indicator
variables.
c.
These variables take on only two values, namely 0 or 1, and those values then indicate the
absence or presence of a particular nominal characteristic.
d.
All of these choices are true.
55. Color of truck is a(n) ____________________ variable.
56. In general, to represent a nominal variable with m categories, we must create _______________
indicator variables. The last category represented by I1 = I2 = …..Im
−
1 = 0 is called the
_______________ category.
57. It is possible to include nominal variables in a regression model. This is accomplished through the use
of ____________________ variables, also known as ____________________ variables.
58. An indicator variable is a nominal variable that can assume _______________ possible values.
59. An indicator variable can assume either one of only two values (usually 0 and 1), where
_______________ represents the existence of a certain condition and _______________ indicates that
the condition does not hold.
60. It is possible to include ____________________ variables in a regression model. This is accomplished
through the use of indicator (or dummy) variables.
61. In order to represent 3 categories of a nominal variable, we need to create _______________ indicator
variables.
62. Because indicator variables represent different groups, t-tests on the indicator variables allow us to
draw inferences about the ____________________ in y between the groups.
Incomes of Physicians
An economist is analyzing the incomes of physicians (general practitioners, surgeons, and
psychiatrists). He realizes that an important factor is the number of years of experience. However, he
wants to know if there are differences among the three professional groups. He takes a random sample
of 125 physicians and estimates the multiple regression model y =
0 +
1x1 +
2x2 +
3x3 +
, where y
= annual income (in $1,000), x1 = years of experience, x2 = 1 if physician and 0 if not, and x3 = 1 if
surgeons and 0 if not. The computer output is shown below.
THE REGRESSION EQUATION IS
y = 71.65 + 2.07x1 + 10.16x2 − 7.44x3
Predictor
Coef
StDev
T
Constant
71.65
18.56
3.860
x1
2.07
.81
2.556
x2
10.16
3.16
3.215
x3
−7.44
2.85
−2.611
S = 42.6
R−Sq = 30.9%
ANALYSIS OF VARIANCE
Source of Variation
df
SS
MS
F
Regression
3
98008
32669.333
18.008
Error
121
219508
1814.116
Total
124
317516
63. {Incomes of Physicians Narrative} Estimate the annual income for a general practitioner with 15 years
of experience.
64. {Incomes of Physicians Narrative} Estimate the annual income for a surgeon with 15 years of
experience.
65. {Incomes of Physicians Narrative} Estimate the annual income for a psychiatrist with 15 years of
experience.
66. {Incomes of Physicians Narrative} Do these results allow us to conclude at the 1% significance level
that the model is useful in predicting the income of physicians?
67. {Incomes of Physicians Narrative} Is there enough evidence at the 5% significance level to conclude
that income and experience are linearly related?
68. {Incomes of Physicians Narrative} Is there enough evidence at the 1% significant level to conclude
that general practitioners earn more on average than psychiatrists?
69. {Incomes of Physicians Narrative} Is there enough evidence at the 10% significance level to conclude
that surgeons earn less on average than psychiatrists?
Senior Medical Students
A professor of Anatomy wanted to develop a multiple regression model to predict the students’ grades
in her fourth-year medical course. She decides that the two most important factors are the student’s
grade point average in the first three years and the student’s major. She proposes the model y =
0 +
1x1 +
2x2 +
3x3 +
, where y = Fourth-year medical course final score (out of 100), x1 = G.P.A. in
first three years (range from 0 to 12), x2 = 1 if student’s major is medicine and 0 if not, and x3 = 1 if
student’s major is biology and 0 if not. The computer output is shown below.
THE REGRESSION EQUATION IS
y = 9.14 + 6.73x1 + 10.42x2 + 5.16x3
Predictor
Coef
StDev
T
Constant
9.14
7.10
1.287
x1
6.73
1.91
3.524
x2
10.42
4.16
2.505
x3
5.16
3.93
1.313
S = 15.0
R−Sq = 44.2%
ANALYSIS OF VARIANCE
Source of Variation
df
SS
MS
F
Regression
3
17098
5699.333
25.386
Error
96
21553
224.510
Total
99
38651
70. {Senior Medical Students Narrative} Predict the final grade (out of 100) in the fourth-year medical
course for a medical student who has a 10.95 G.P.A. in their first three years (range from 0 to 12).
71. {Senior Medical Students Narrative} Predict the final grade (out of 100) in the fourth-year medical
course for a biology major student who has a 10.95 G.P.A. in their first three years (range from 0 to
12).
72. (Senior Medical Students Narrative) Predict the final grade (out of 100) in the fourth-year medical
course for an anatomy major student who has a 10.95 G.P.A. in their first three years (range from 0 to
12).
73. {Senior Medical Students Narrative} Do these results allow us to conclude at the 1% significance level
that the model is useful in predicting the fourth-year medical course final grade?
74. {Senior Medical Students Narrative} Do these results allow us to conclude at the 1% significance level
that on average medical majors outperform those whose majors are not medical or biology?
75. {Senior Medical Students Narrative} Do these results allow us to conclude at the 1% significance level
that on average biology majors outperform those whose majors are not medical or biology?
76. {Senior Medical Students Narrative} Do these results allow us to conclude at the 1% significance level
that grade point average in first three years is linearly related to the fourth-year medical final grade?
77. {Senior Medical Students Narrative} Interpret the coefficient b2.
78. {Senior Medical Students Narrative} Interpret the coefficient b3.
79. The stepwise regression procedure begins by computing the simple regression model for each
independent variable.
80. The stepwise regression procedure begins by computing the multiple regression model for all
independent variables of interest.
81. In stepwise regression, the independent variable with the largest F-statistic, or equally the smallest
p-value, is chosen as the first entering variable.
82. In stepwise regression, if two independent variables are highly correlated, both variables must enter
the model simultaneously.
83. At each step of the stepwise regression procedure, the p-values of all variables are computed and
composed to the F–to-remove. If a variable’s F-statistic falls below this standard, it is removed from
the equation.
84. Indicator variables can assume as many values as there are categories of its corresponding nominal
variable.
85. Another name for an indicator variable is an interval variable.
86. If two indicator variables are used in a logistic regression model, then the nominal variable they
represent has only two categories.
87. If the odds ratio that an obese person who smokes 15 or more cigarettes per day suffers a heart attack
is 9, then the probability that the person will suffer a heart attack is 0.81.
88. In a stepwise regression procedure, if two independent variables are highly correlated, then:
a.
neither variable will enter the equation.
b.
both variables will enter the equation
c.
only one variable will enter the equation.
d.
not enough information is given to answer this question.
89. Stepwise regression is an iterative procedure that:
a.
adds one independent variable at a time.
b.
deletes one independent variable at a time.
c.
Either a or b.
d.
Both a and b.
90. In a multiple regression analysis, which procedure permits variables to enter and leave the model at
different stages of its development?
a.
Stepwise regression
b.
Backward elimination
c.
Residual analysis
d.
Forward selection
91. One of the requirements of regression analysis is that the dependent variable must be:
a.
discrete.
b.
continuous.
c.
interval.
d.
nominal.
92. If the probability of an event is .20, then the odds ratio in favor of the event occurring is expressed as
a.
1 to 4
b.
1 to 3
c.
1 to 2
d.
1 to 1
93. In stepwise regression procedure, the independent variable with the largest F-statistic, or equally with
the smallest p-value, is chosen as the first entering variable. The standard, also called the F–to-enter, is
usually set at F equals:
a.
0
b.
1
c.
2
d.
4
94. When the dependent variable is nominal, a(n) ____________________ regression model is used.
95. ____________________ regression is an iterative procedure that adds and deletes one independent
variable at a time to/from the regression model.
96. In stepwise regression the dependent variable must be ____________________.
97. The ____________________ variable of a regression model is the variable that you wish to analyze or
predict.
98. In building a regression model, it is best to use the ____________________ number of independent
variables that produce a satisfactory model.
99. To gather the required observations for your potential regression models, a general rule is that there
should be at least ____________________ observations for each independent variable used in the
equation.
100. In multiple regression, which procedure permits variables to enter and leave the model at different
stages of its development?
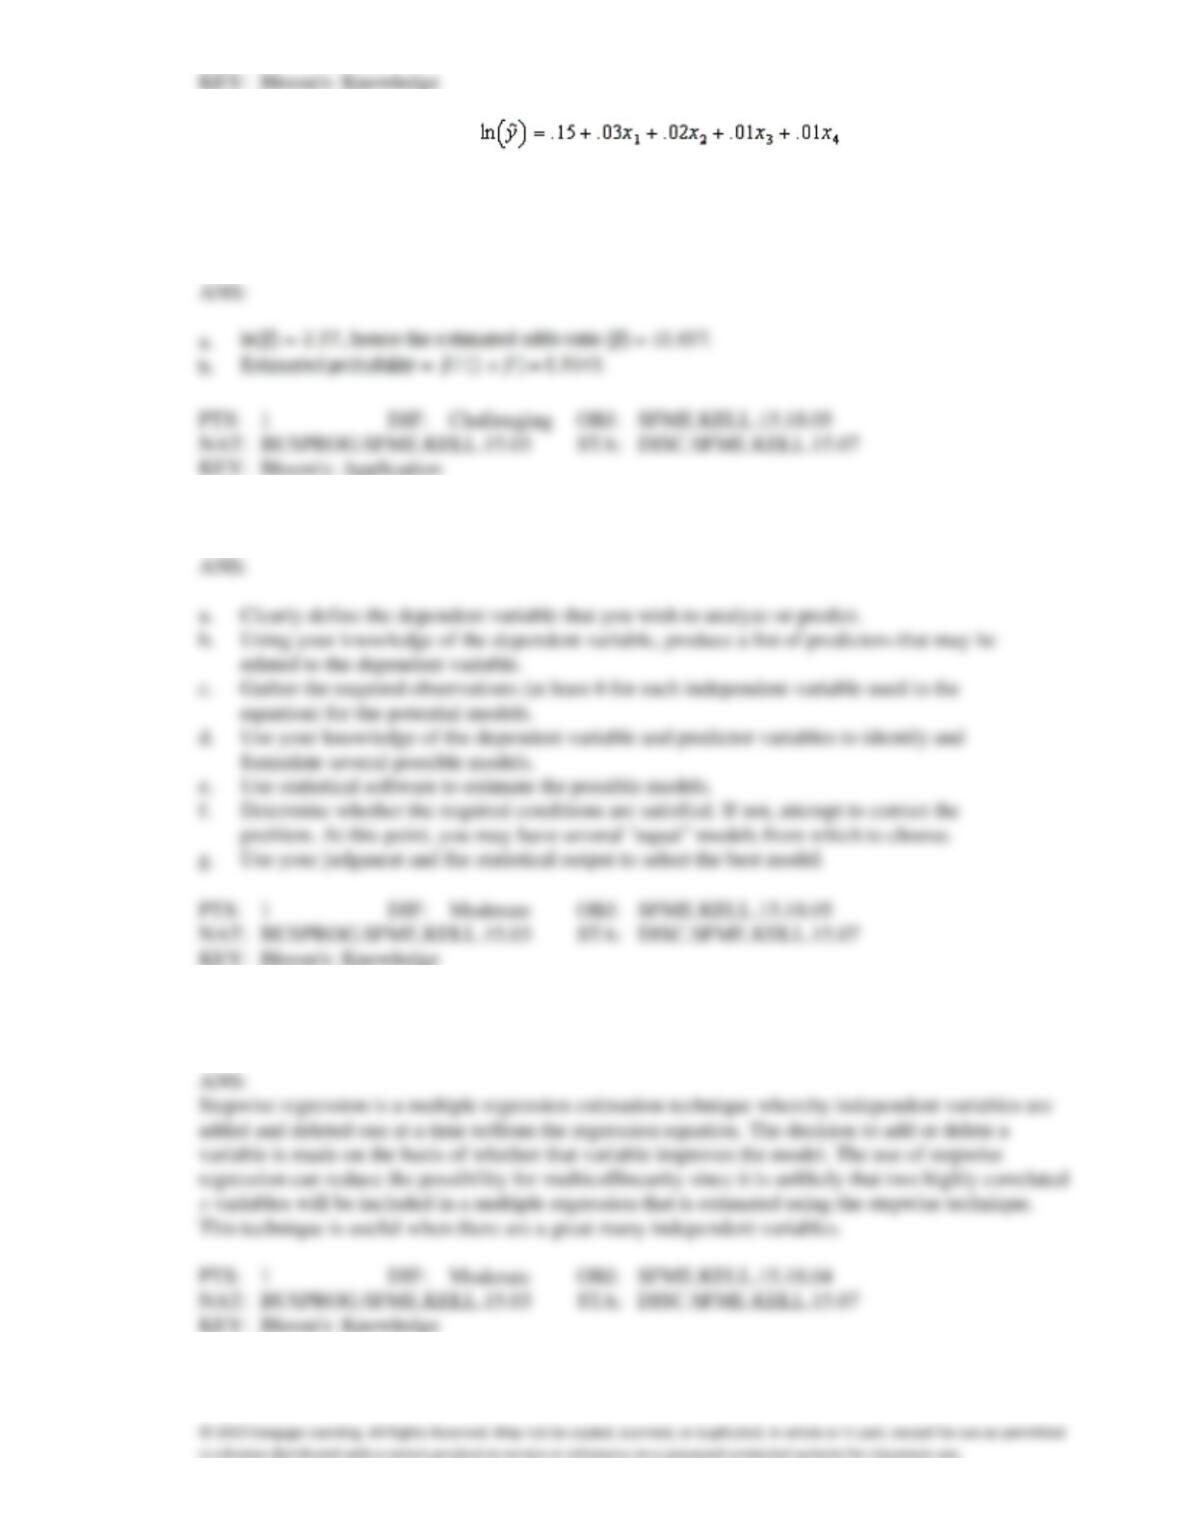
101. A logistic regression equation is .
a.
What is the estimated odds ratio for the event of interest occurring when x1 = 30, x2 = 60,
x3 = 8, and x4 = 4?
b.
What is the estimated probability of the event described in part a?
102. Discuss briefly the procedure that is employed in the building of a model.
related to the dependent variable.
c.
Gather the required observations (at least 6 for each independent variable used in the
d.
Use your knowledge of the dependent variable and predictor variables to identify and
problem. At this point, you may have several “equal” models from which to choose.
103. What is stepwise regression, and when is it desirable to make use of this multiple regression
technique?
104. The two largest values in a correlation matrix are the .89 correlation between y and x3, and the .83
correlation between y and x7. During a stepwise regression analysis x3 is the first independent variable
brought into the equation. Will x7 necessarily be next? If not, why not?
105. In general, on what basis are independent variables selected for entry into the equation during stepwise
regression?