CHAPTER 18: MODEL BUILDING
TRUE/FALSE
1. Regression analysis allows the statistics practitioner to use mathematical models to realistically
describe relationships between the dependent variable and independent variables.
2. A first-order polynomial model with one predictor variable is the familiar simple linear regression
model.
3. We interpret the coefficients in a multiple regression model by holding all variables in the model
constant.
4. Suppose that the sample regression equation of a model is . If we examine
the relationship between x1 and y for four different values of x2, we observe that the four equations
produced differ only in the intercept term.
5. The model is used whenever the statistician believes that, on average, y is
linearly related to x1 and x2 and the predictor variables do not interact.
6. The graph of the model is shaped like a straight line going upwards.
7. The model is referred to as a polynomial model with one
predictor variable.

8. Suppose that the sample regression line of the first-order model is . If we examine the
relationship between y and x1 for three different values of x2, we observe that the effect of x1 on y
remains the same no matter what the value of x2.
9. In the first-order model , a unit increase in x1, while holding x2 constant at
a value of 2, decreases the value of y on average by 8 units.
10. The model y =
0 +
1x +
2x2 +
is referred to as a simple linear regression model.
11. In a first-order model with two predictors x1 and x2, an interaction term may be used when the
relationship between the dependent variable y and the predictor variables is linear.
12. In the first-order model , a unit increase in x2, while holding x1 constant at
1, changes the value of y on average by −5 units.
13. In the first-order regression model , a unit increase in x1 increases the value
of y on average by 6 units.
14. In the first-order model , a unit increase in x2, while holding x1 constant, increases the
value of y on average by 5 units.
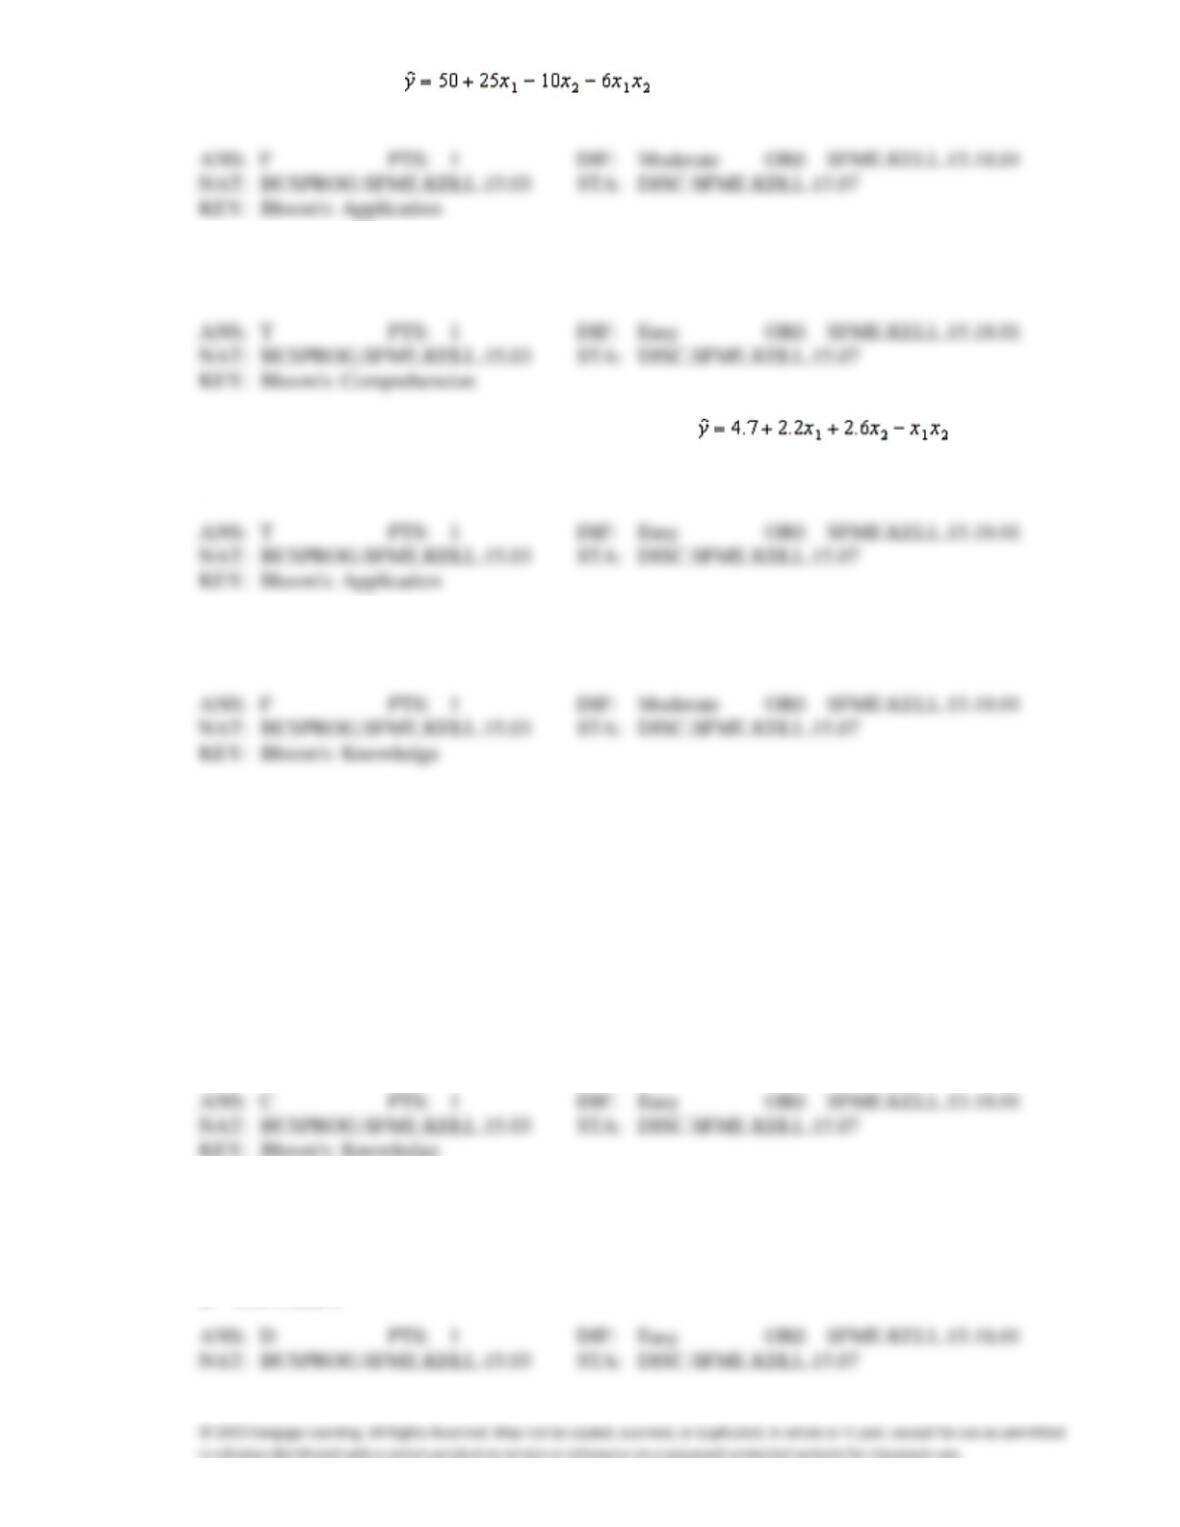
15. In the first-order model , a unit increase in x2, while holding x1 constant at
a value of 3, decreases the value of y on average by 3 units.
16. The model y =
0 +
1x1 +
2x2 +
is referred to as a first-order model with two predictor variables
with no interaction.
17. Suppose that the sample regression equation of a model is . If we
examine the relationship between y and x2 for x1 = 1, 2, and 3, we observe that the three equations
produced not only differ in the intercept term, but the coefficient of x2 also varies.
18. The model y =
0 +
1x1 +
2x2 +
3x1x2 +
is referred to as a second-order model with two predictor
variables with interaction.
MULTIPLE CHOICE
1. Which of the following is not an advantage of multiple regression as compared with analysis of
variance?
a.
Multiple regression can be used to estimate the relationship between the dependent
variable and independent variables.
b.
Multiple regression handles problems with more than two independent variables easier
than analysis of variance.
c.
Multiple regression handles nominal variables better than analysis of variance.
d.
All of these choices are true are advantages of multiple regression as compared with
analysis of variance.
2. In a first-order model with two predictors x1 and x2, an interaction term may be used when the:
a.
relationship between the dependent variable and the independent variables is linear.
b.
effect of x1 on the dependent variable is influenced by x2.
c.
effect of x2 on the dependent variable is influenced by x1.
d.
both b and c.
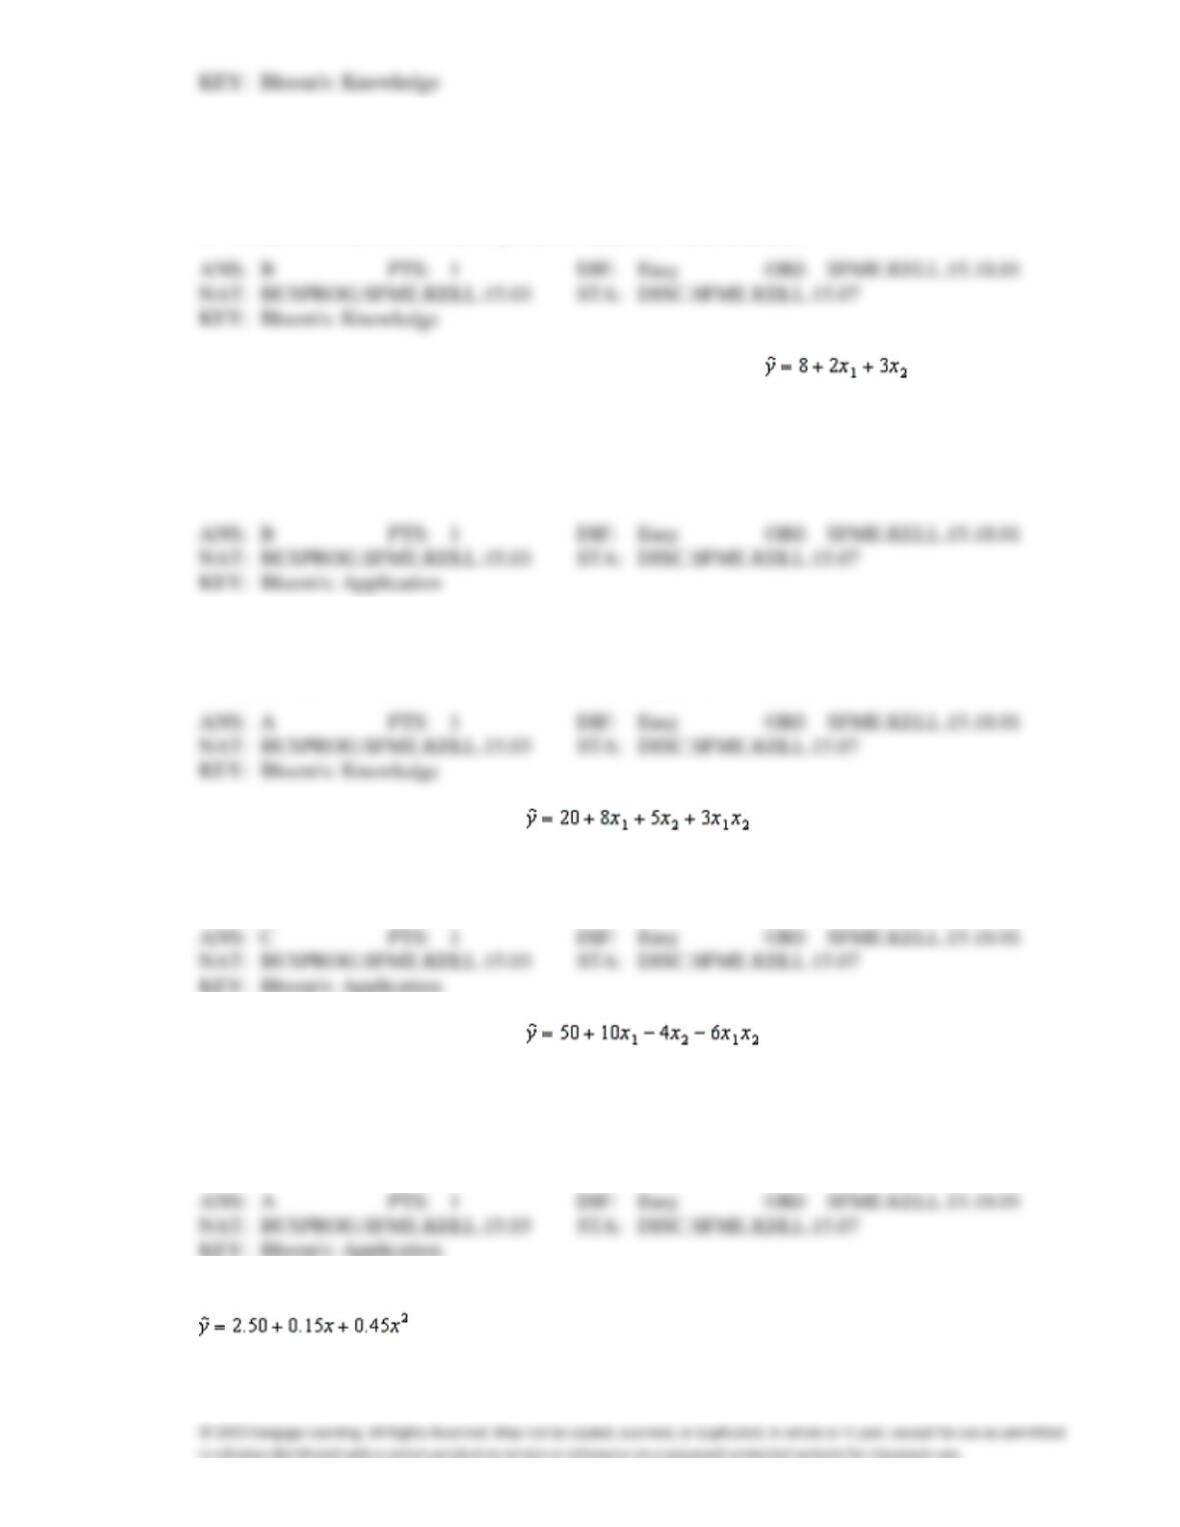
3. The model y =
0 +
1x1 +
2x2 +
3x1x2 +
is referred to as a:
a.
first-order model with two predictor variables with no interaction.
b.
first-order model with two predictor variables with interaction.
c.
second-order model with three predictor variables with no interaction.
d.
second-order model with three predictor variables with interaction.
4. Suppose that the sample regression line of the first-order model is . If we examine the
relationship between y and x1 for four different values of x2, we observe that the:
a.
only difference in the four equations produced is the coefficient of x2.
b.
effect of x1 on y remains the same no matter what the value of x2.
c.
effect of x1 on y remains the same no matter what the value of x1.
d.
Cannot answer this question without more information.
5. The model y =
0 +
1x +
2x2 +………+
pxp +
is referred to as a polynomial model with:
a.
one predictor variable.
c.
(p + 1) predictor variables.
b.
p predictor variables.
d.
x predictor variables.
6. For the following regression equation , which combination of x1 and x2,
respectively, results in the largest average value of y?
a.
3 and 5
c.
6 and 3
b.
5 and 3
d.
3 and 6
7. For the following regression equation , a unit increase in x2, while holding
x1 constant at a value of 3, decreases the value of y on average by:
a.
22
b.
50
c.
56
d.
An amount that depends on the value of x2
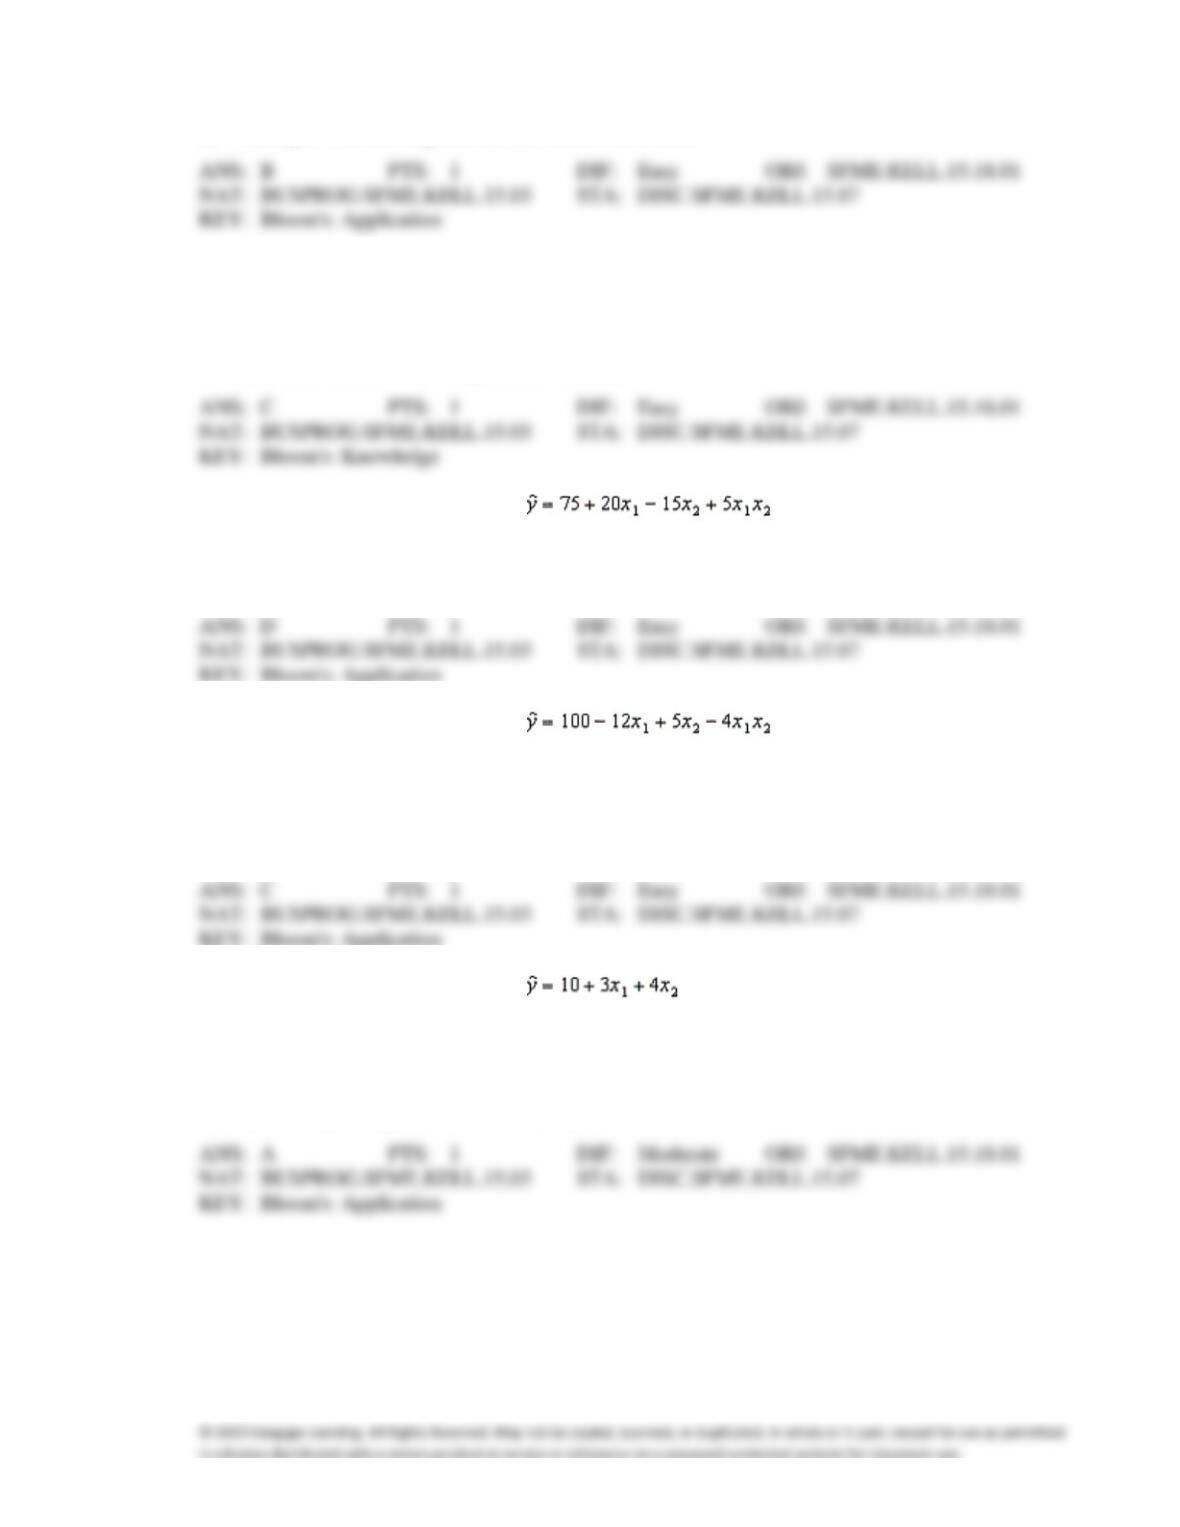
8. Suppose that the sample regression equation of a second-order model is given by
. Then, the value 4.60 is the:
a.
predicted value of y for any positive value of x.
b.
predicted value of y when x = 2.
c.
estimated change in y when x increases by 1 unit .
d.
intercept where the response surface strikes the x-axis.
9. The model y =
0 +
1x +
2x2 +
is referred to as a:
a.
simple linear regression model.
b.
first-order model with one predictor variable.
c.
second-order model with one predictor variable.
d.
third order model with two predictor variables.
10. For the following regression equation , a unit increase in x2, while
holding x1 constant at 1, changes the value of y on average by:
a.
−5
c.
10
b.
+5
d.
−10
11. For the following regression equation , a unit increase in x1, while
holding x2 constant at a value of 2, decreases the value of y on average by:
a.
92
b.
85
c.
20
d.
an amount that depends on the value of x1.
12. For the following regression equation , a unit increase in x2 increases the value of y
on average by:
a.
4
b.
7
c.
17
d.
an amount that depends on the value of x1.
13. The model y =
0 +
1x1 +
2x2 +
is used whenever the statistician believes that, on average, y is
linearly related to:
a.
x1 and the predictor variables do not interact.
b.
x2 and the predictor variables do not interact.
c.
both a and b.
d.
None of these choices.
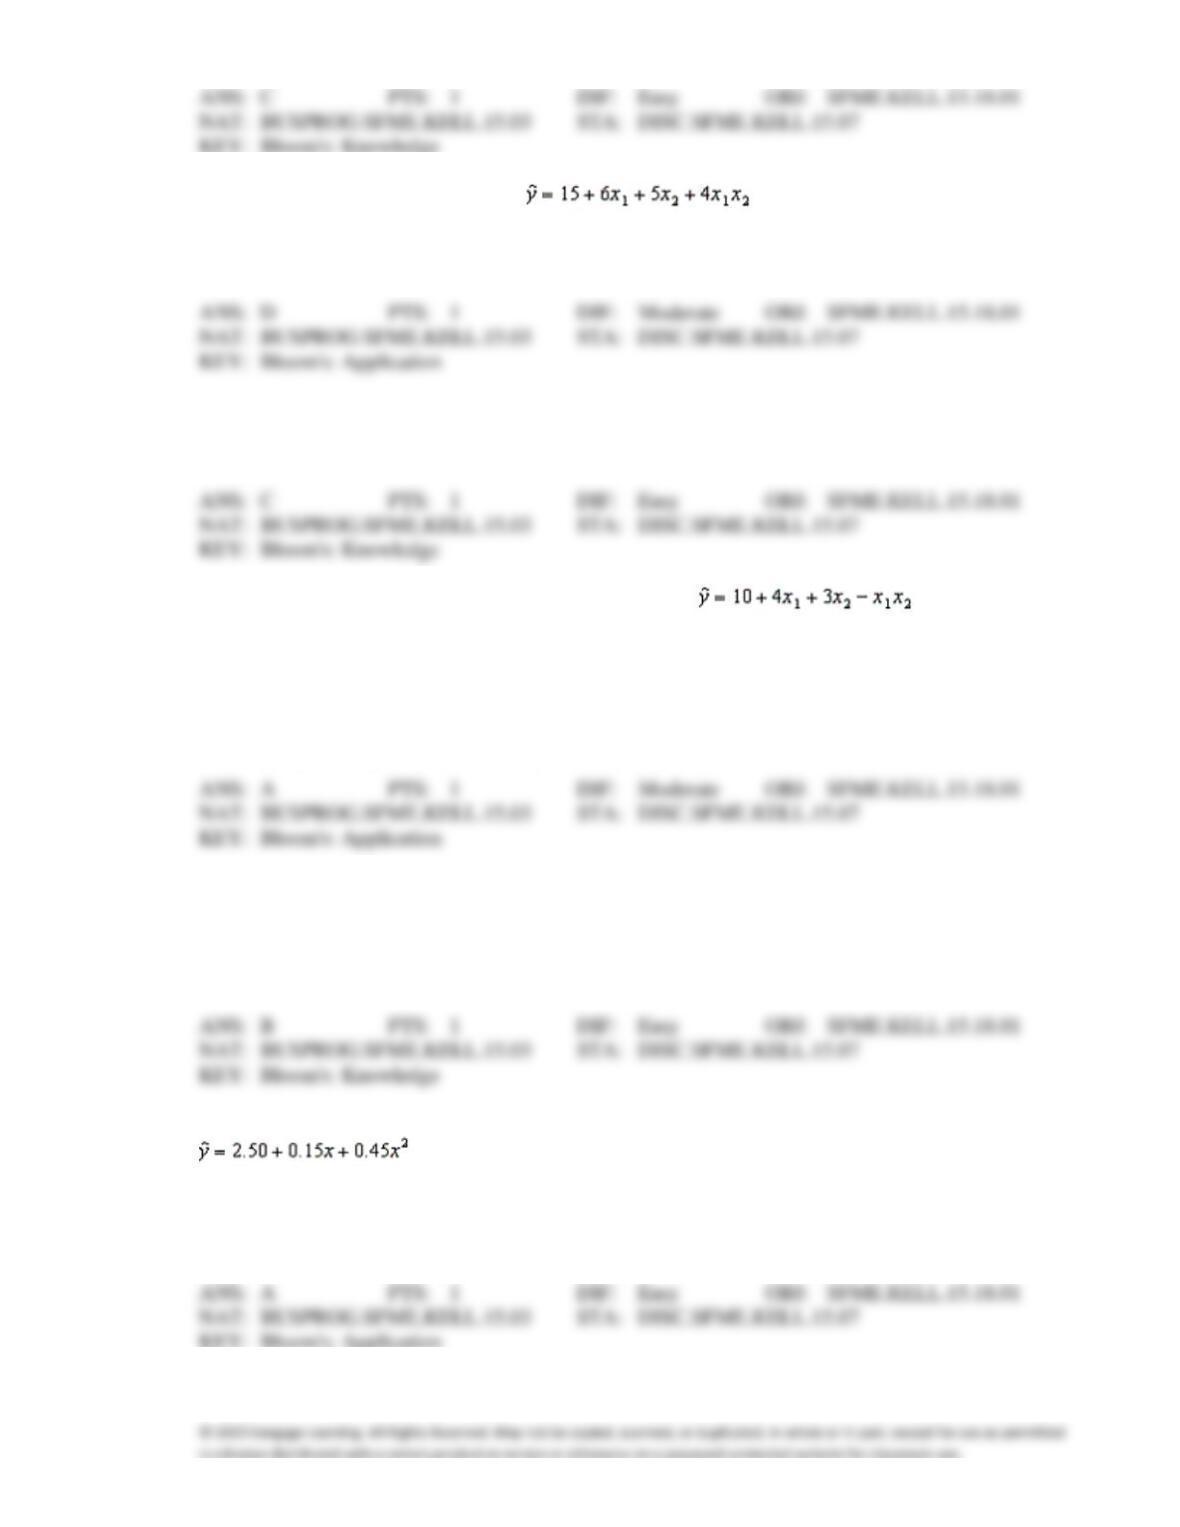
14. For the following regression equation , a unit increase in x1 increases the
value of y on average by:
a.
5
c.
26
b.
30
d.
an amount that depends on the value of x2
15. When we plot x versus y, the graph of the model y =
0 +
1x +
2x2 +
is shaped like a:
a.
straight line going upwards.
c.
parabola.
b.
circle.
d.
None of these choices.
16. Suppose that the sample regression equation of a model is . If we examine
the relationship between x1 and y for three different values of x2, we observe that the:
a.
three equations produced differ not only in the intercept term but also the coefficient of x1
varies.
b.
coefficient of x2 remains unchanged.
c.
coefficient of x1 varies.
d.
three equations produced differ only in the intercept.
17. The model y =
0 +
1x1 +
2x2 +
is referred to as a:
a.
first-order model with one predictor variable.
b.
first-order model with two predictor variables.
c.
second-order model with one predictor variable.
d.
second-order model with two predictor variables.
18. Suppose that the sample regression equation of a second-order model is given by
. Then, the value 2.50 is the:
a.
intercept where the response surface strikes the y-axis.
b.
intercept where the response surface strikes the x-axis.
c.
predicted value of y.
d.
None of these choices.
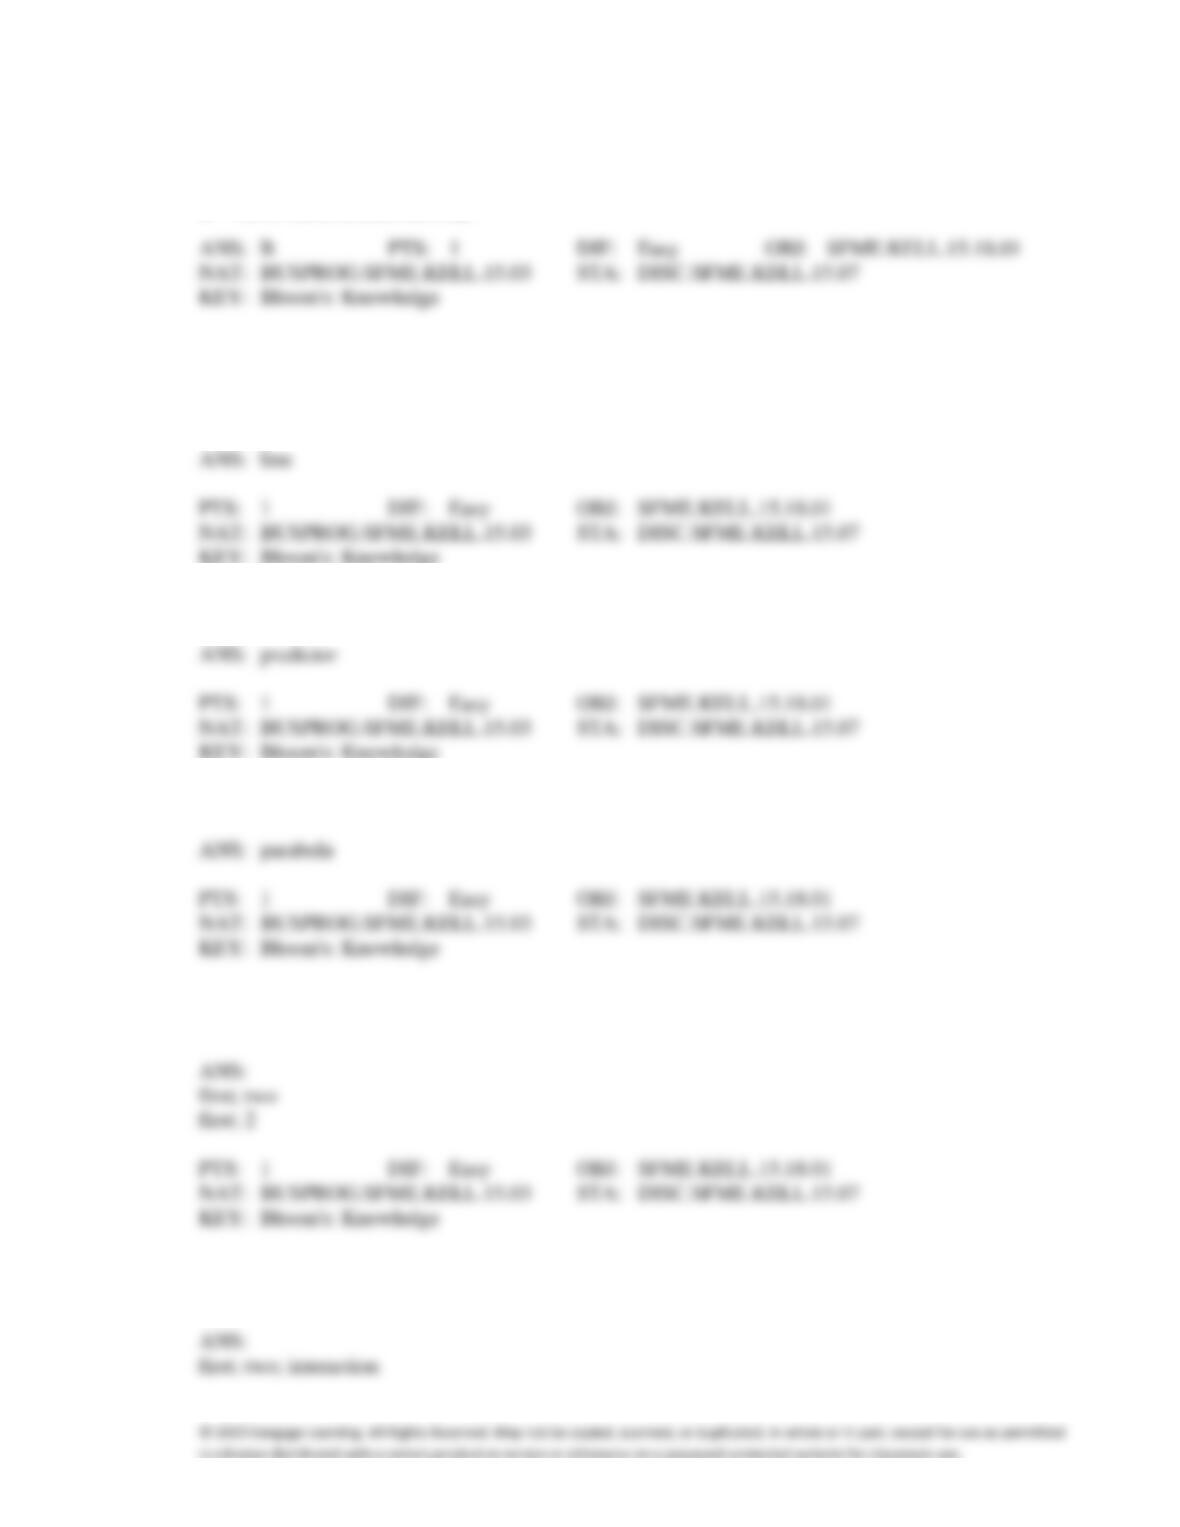
19. Which of the following statements is false regarding the graph of the second-order polynomial model y
=
0 +
1x +
2x2 +
?
a.
If
2 is negative, the graph is concave, while if
2 is positive, the graph is convex.
b.
The greater the absolute value of
2, the smaller the rate of curvature.
c.
When we plot x versus y, the graph is shaped like a parabola.
d.
All of these choices are true.
COMPLETION
1. Another term for a first-order polynomial model is a regression ____________________.
2. The independent variable x in a polynomial model is called the ____________________ variable.
3. A second-order polynomial model is shaped like a(n) ____________________.
4. The model y =
0 +
1x1 +
2x2 +
is a(n) ____________________-order polynomial model with
____________________ predictor variable(s).
5. The model y =
0 +
1x1 +
2x2 +
3x1x2 +
is a(n) ____________________-order polynomial model
with ____________________ predictor variables and ____________________.
6. ____________________ means that the effect of x1 on y is influenced by the value of x2, and vice
versa.
7. In a first-order polynomial model with no interaction, the effect of x1 on y remains the same no matter
what the value of x2 is. The graph of this model produces straight lines that are
____________________ to each other.
8. If a quadratic relationship exists between y and each of x1 and x2, you use a(n)
____________________-order polynomial model.
SHORT ANSWER
Computer Training
Consider the following data for two variables, x and y. The independent variable x represents the
amount of training time (in hours) for a salesperson starting in a new computer store to adjust fully,
and the dependent variable y represents the weekly sales (in $1000s).
x
10
14
16
20
25
30
35
40
50
y
12
20
23
27
36
45
40
28
30
Use statistical software to answer the following question(s).
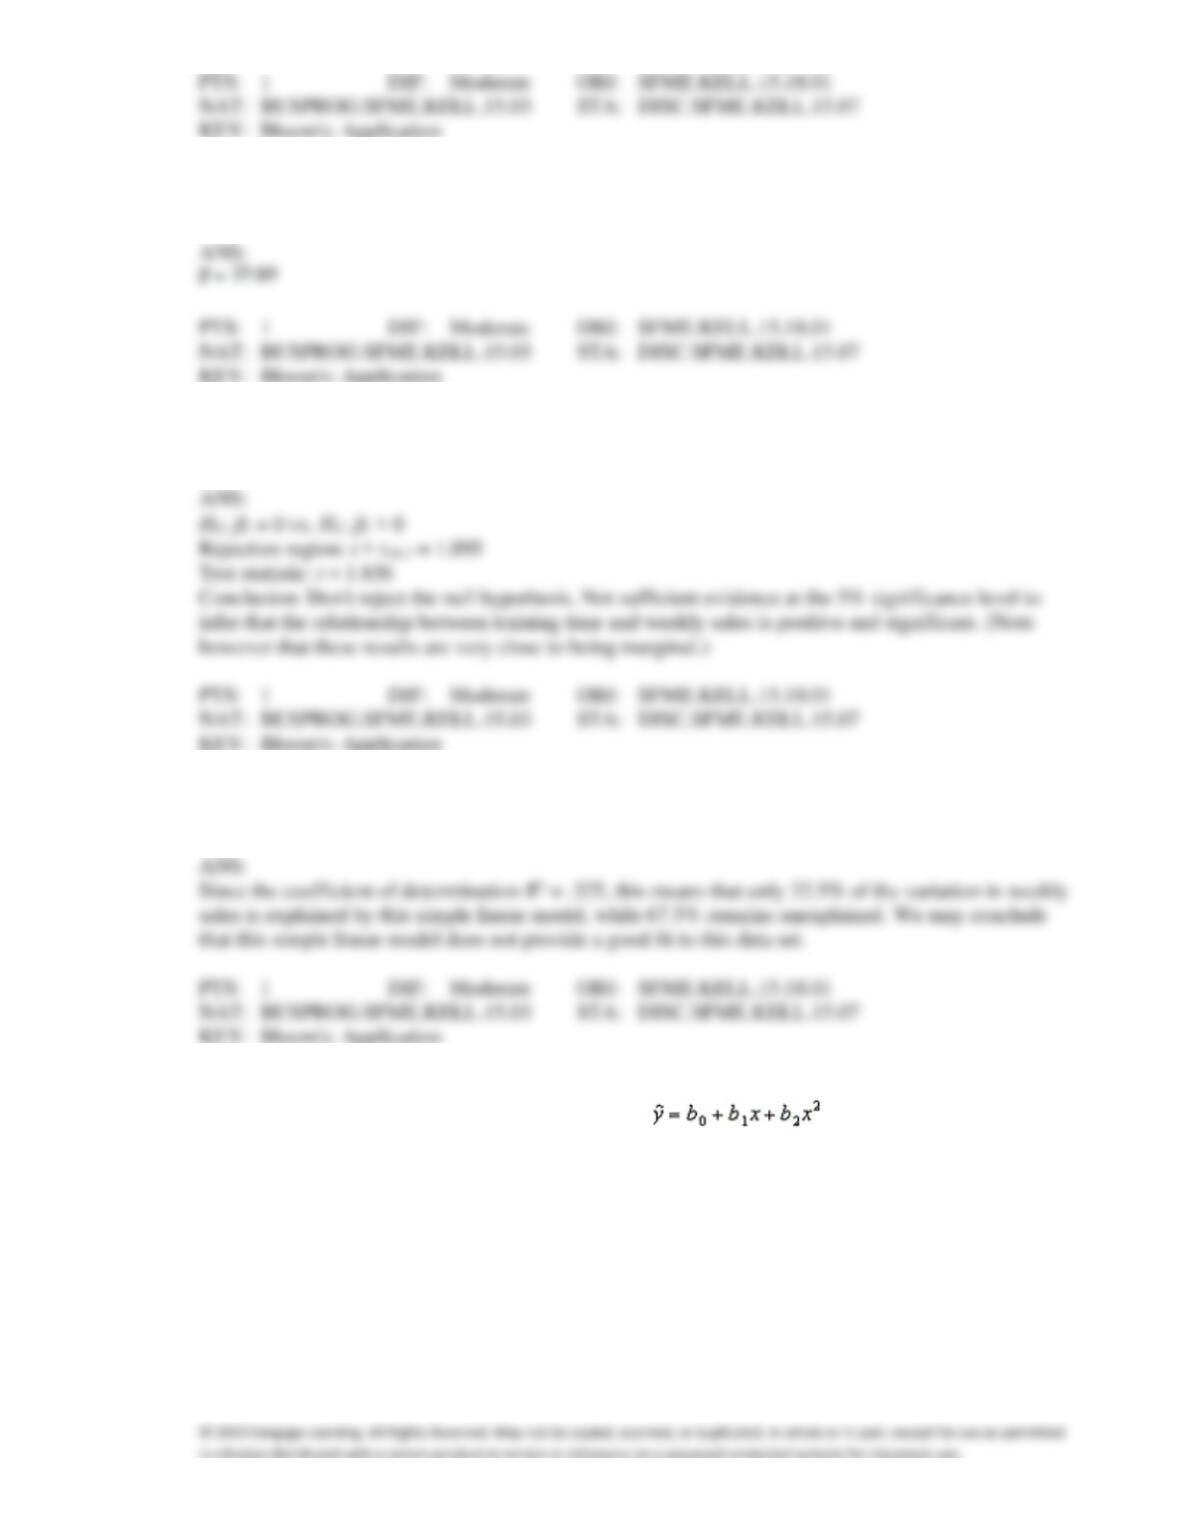
1. {Computer Training Narrative} Develop an estimated regression equation of the form .
2. {Computer Training Narrative} Estimate the value of y when x = 45 using the estimated linear
regression equation in the previous question.
3. {Computer Training Narrative} Determine if there is sufficient evidence at the 5% significance level
to infer that the relationship between x and y is positive and significant.
4. {Computer Training Narrative} Find the coefficient of determination of this simple linear model. What
does this statistic tell you about the model?
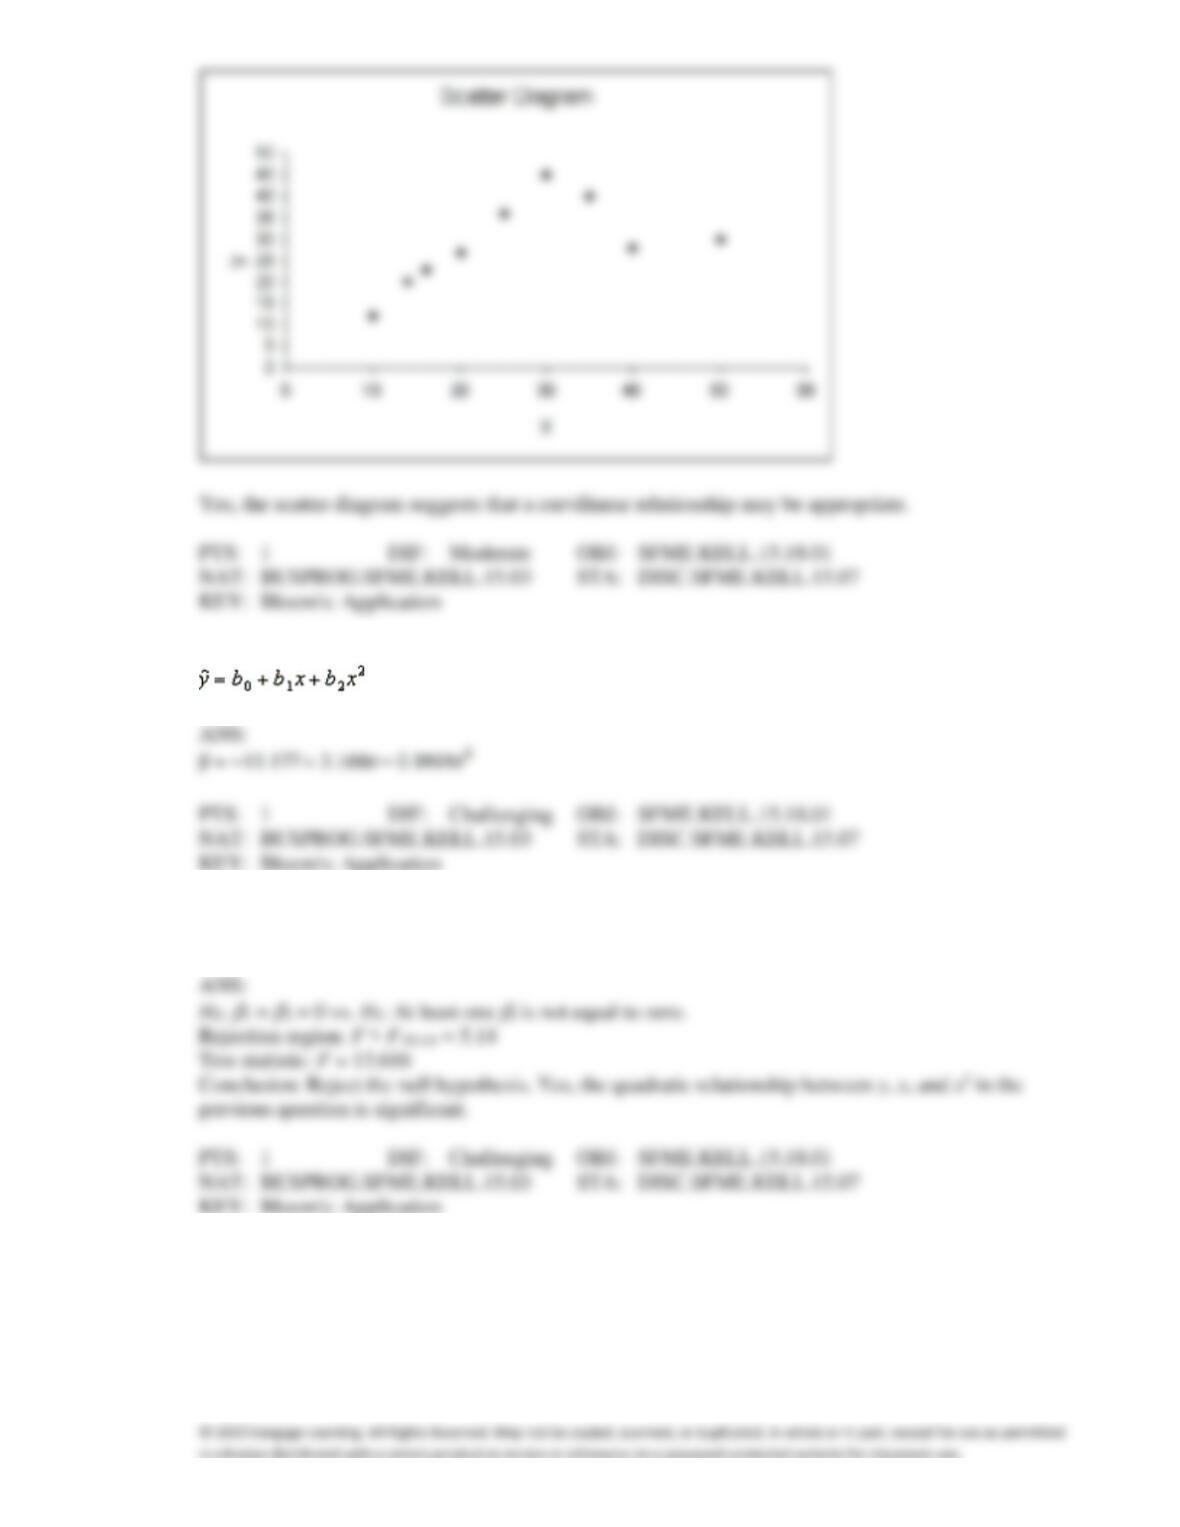
5. {Computer Training Narrative} Develop a scatter diagram for the data. Does the scatter diagram
suggest an estimated regression equation of the form ? Explain.
ANS:
6. {Computer Training Narrative} Develop an estimated regression equation of the form
.
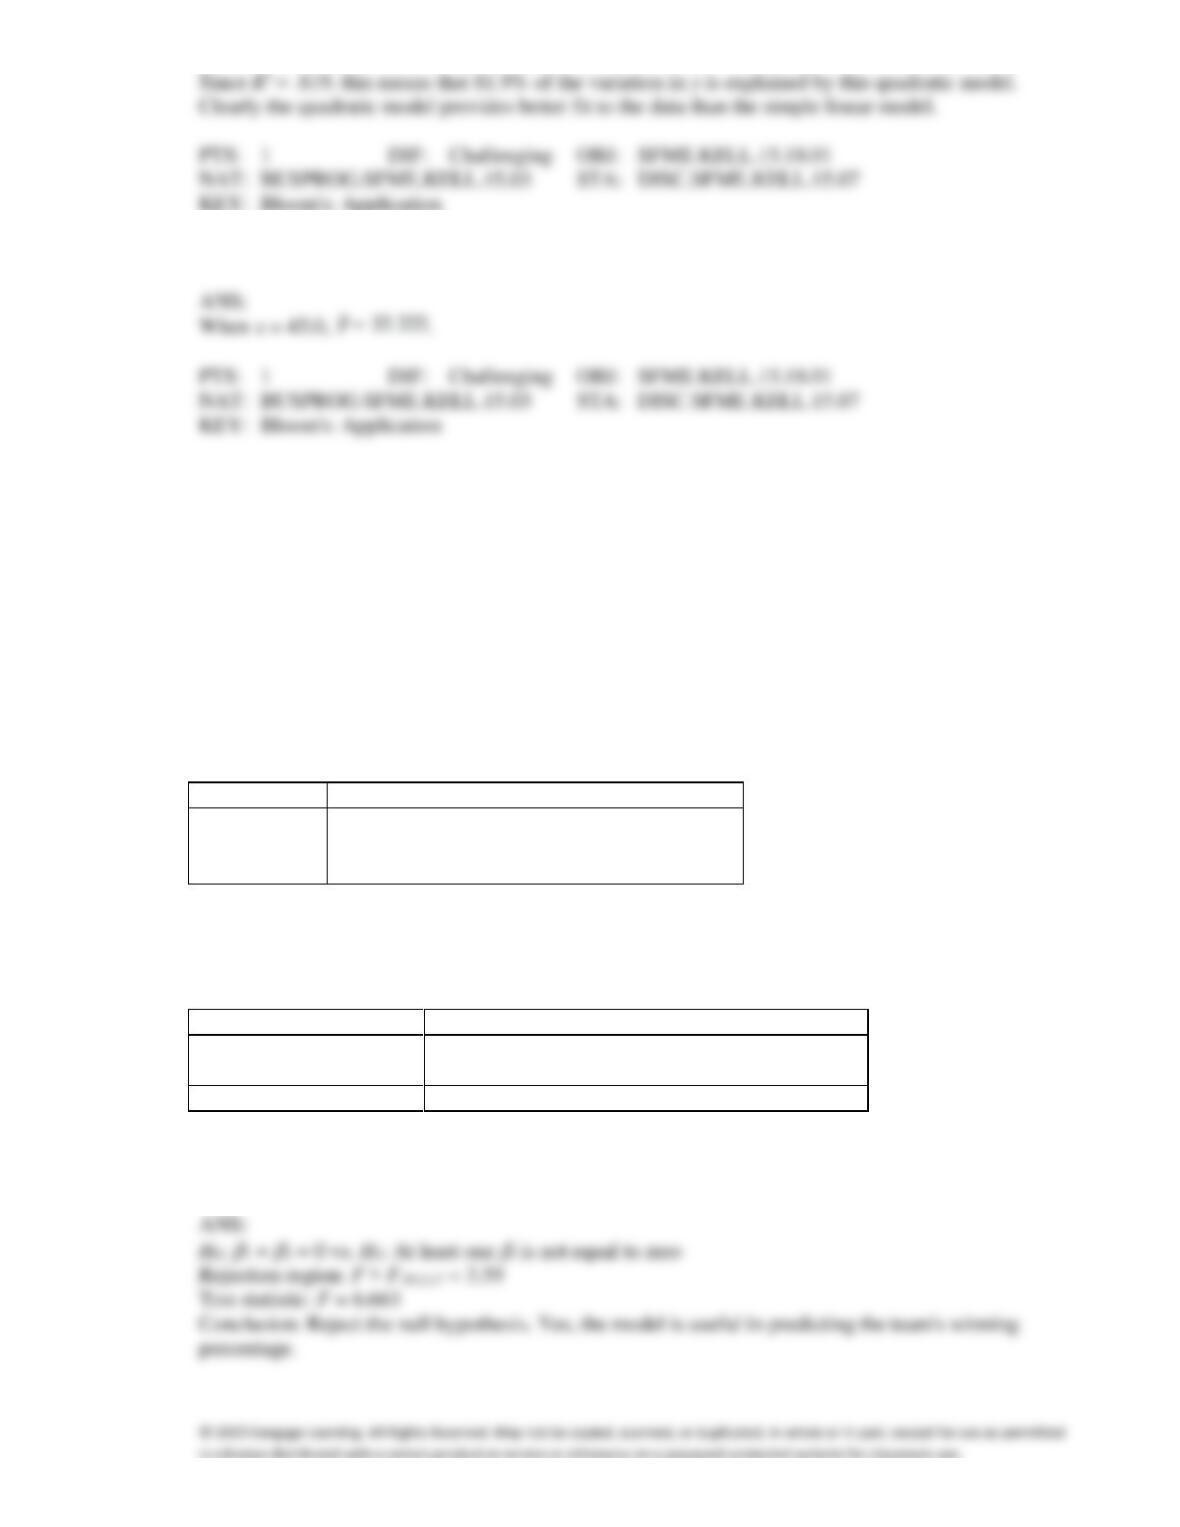
7. {Computer Training Narrative} Determine if there is sufficient evidence at the 5% significance level
to infer that the quadratic relationship between y, x, and x2 in the previous question is significant.
8. {Computer Training Narrative} Determine the coefficient of determination quadratic model. What
does this statistic tell you about this model?
ANS:
9. {Computer Training Narrative} Use the quadratic model to predict the value of y when x = 45.
Hockey Teams
An avid hockey fan was in the process of examining the factors that determine the success or failure of
hockey teams. He noticed that teams with many rookies and teams with many veterans seem to do
quite poorly. To further analyze his beliefs he took a random sample of 20 teams and proposed a
second-order model with one independent variable, average years of professional experience. The
selected model is y =
0 +
1x +
2x2 +
, where y = winning team’s percentage, and x = average years
of professional experience. The computer output is shown below.
THE REGRESSION EQUATION IS
y = 32.6 + 5.96x − .48x2
Predictor
Coef
StDev
T
Constant
32.6
19.3
1.689
x
5.96
2.41
2.473
x2
−.48
.22
−2.182
S = 16.1
R−Sq = 43.9%
ANALYSIS OF VARIANCE
Source of Variation
df
SS
MS
F
Regression
2
3452
1726
6.663
Error
17
4404
259.059
Total
19
7856
10. {Hockey Teams Narrative} Do these results allow us to conclude at the 5% significance level that the
model is useful in predicting the team’s winning percentage?
11. {Hockey Teams Narrative} Test to determine at the 10% significance level if the linear term should be
retained.
12. {Hockey Teams Narrative} Test to determine at the 10% significance level if the x2 term should be
retained.
13. {Hockey Teams Narrative} Predict the winning percentage for a hockey team with an average of 6
years of professional experience.
14. {Hockey Teams Narrative} What is the coefficient of determination? Explain what this statistic tells
you about the model.
Motorcycle Fatalities
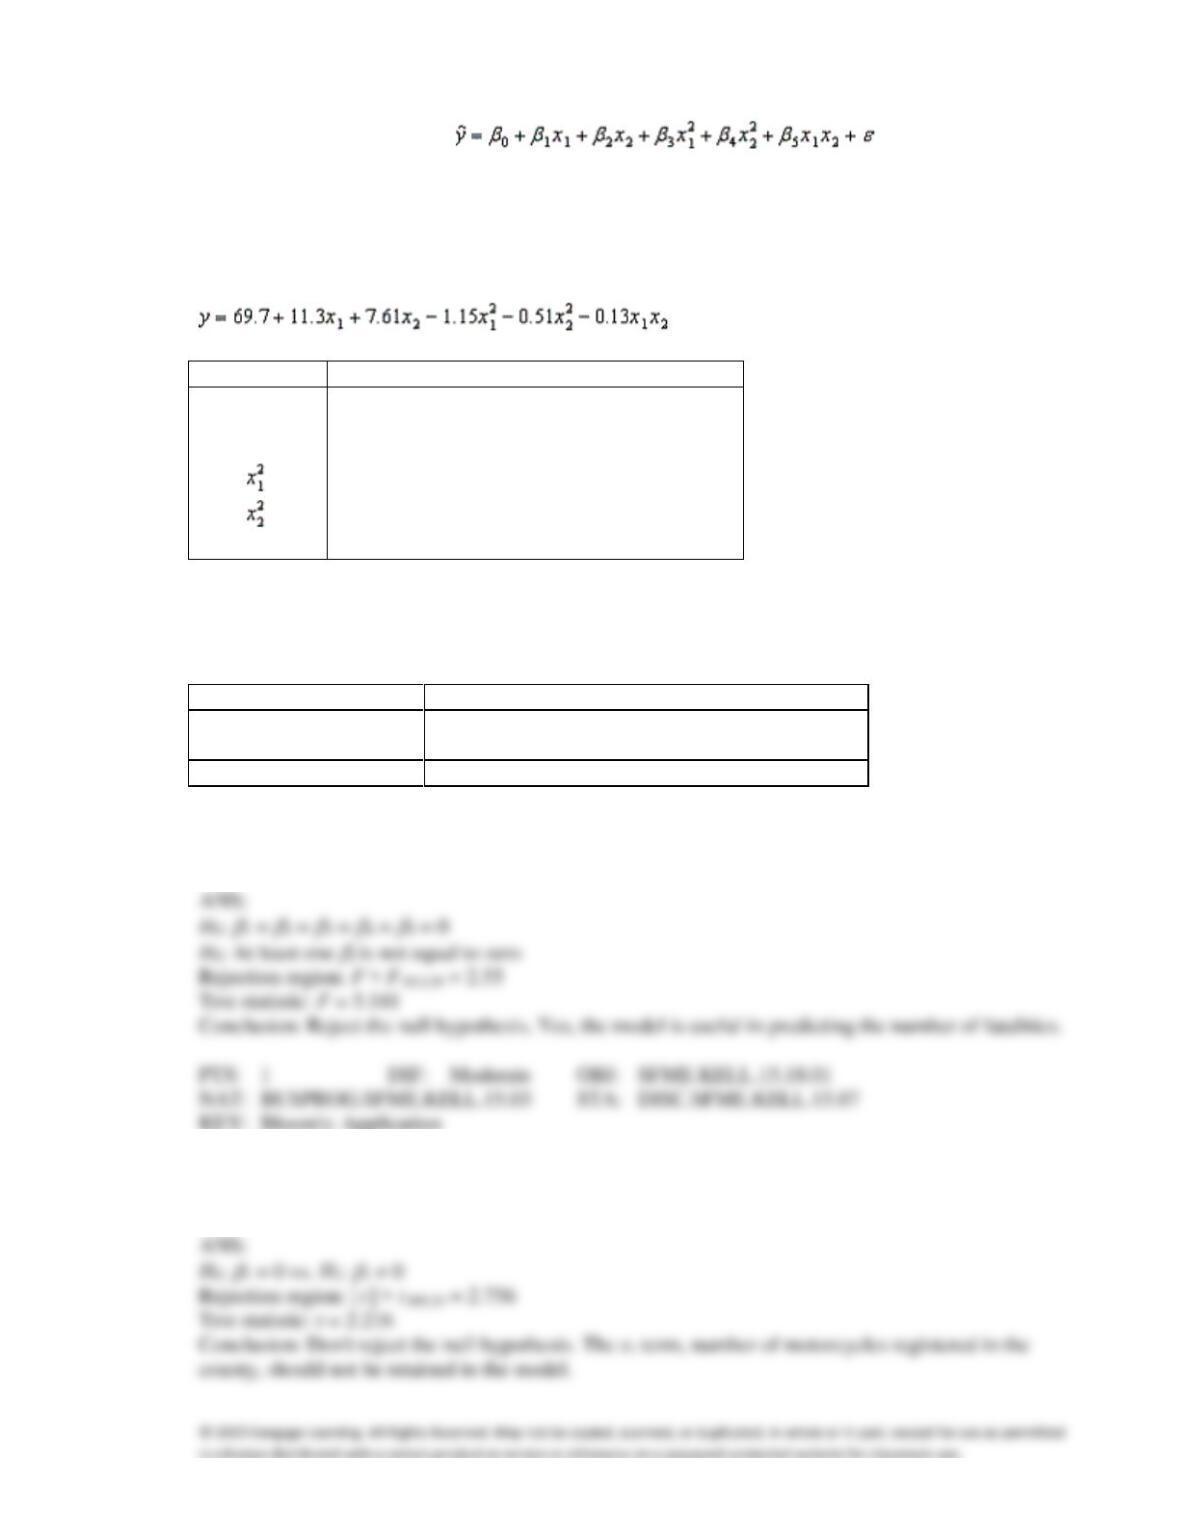
A traffic consultant has analyzed the factors that affect the number of motorcycle fatalities. She has
come to the conclusion that two important variables are the number of motorcycle and the number of
cars. She proposed the model (the second-order
model with interaction), where y = number of annual fatalities per county, x1 = number of motorcycles
registered in the county (in 10,000), and x2 = number of cars registered in the county (in 1000). The
computer output (based on a random sample of 35 counties) is shown below:
THE REGRESSION EQUATION IS
Predictor
Coef
StDev
T
Constant
69.7
41.3
1.688
x1
11.3
5.1
2.216
x2
7.61
2.55
2.984
−1.15
.64
−1.797
−.51
.20
−2.55
x1x2
−.13
.10
−1.30
S = 15.2
R−Sq = 47.2%
ANALYSIS OF VARIANCE
Source of Variation
df
SS
MS
F
Regression
5
5959
1191.800
5.181
Error
29
6671
230.034
Total
34
12630
15. {Motorcycle Fatalities Narrative} Is there enough evidence at the 5% significance level to conclude
that the model is useful in predicting the number of fatalities?
16. {Motorcycle Fatalities Narrative} Test at the 1% significance level to determine if the x1 term should
be retained in the model.
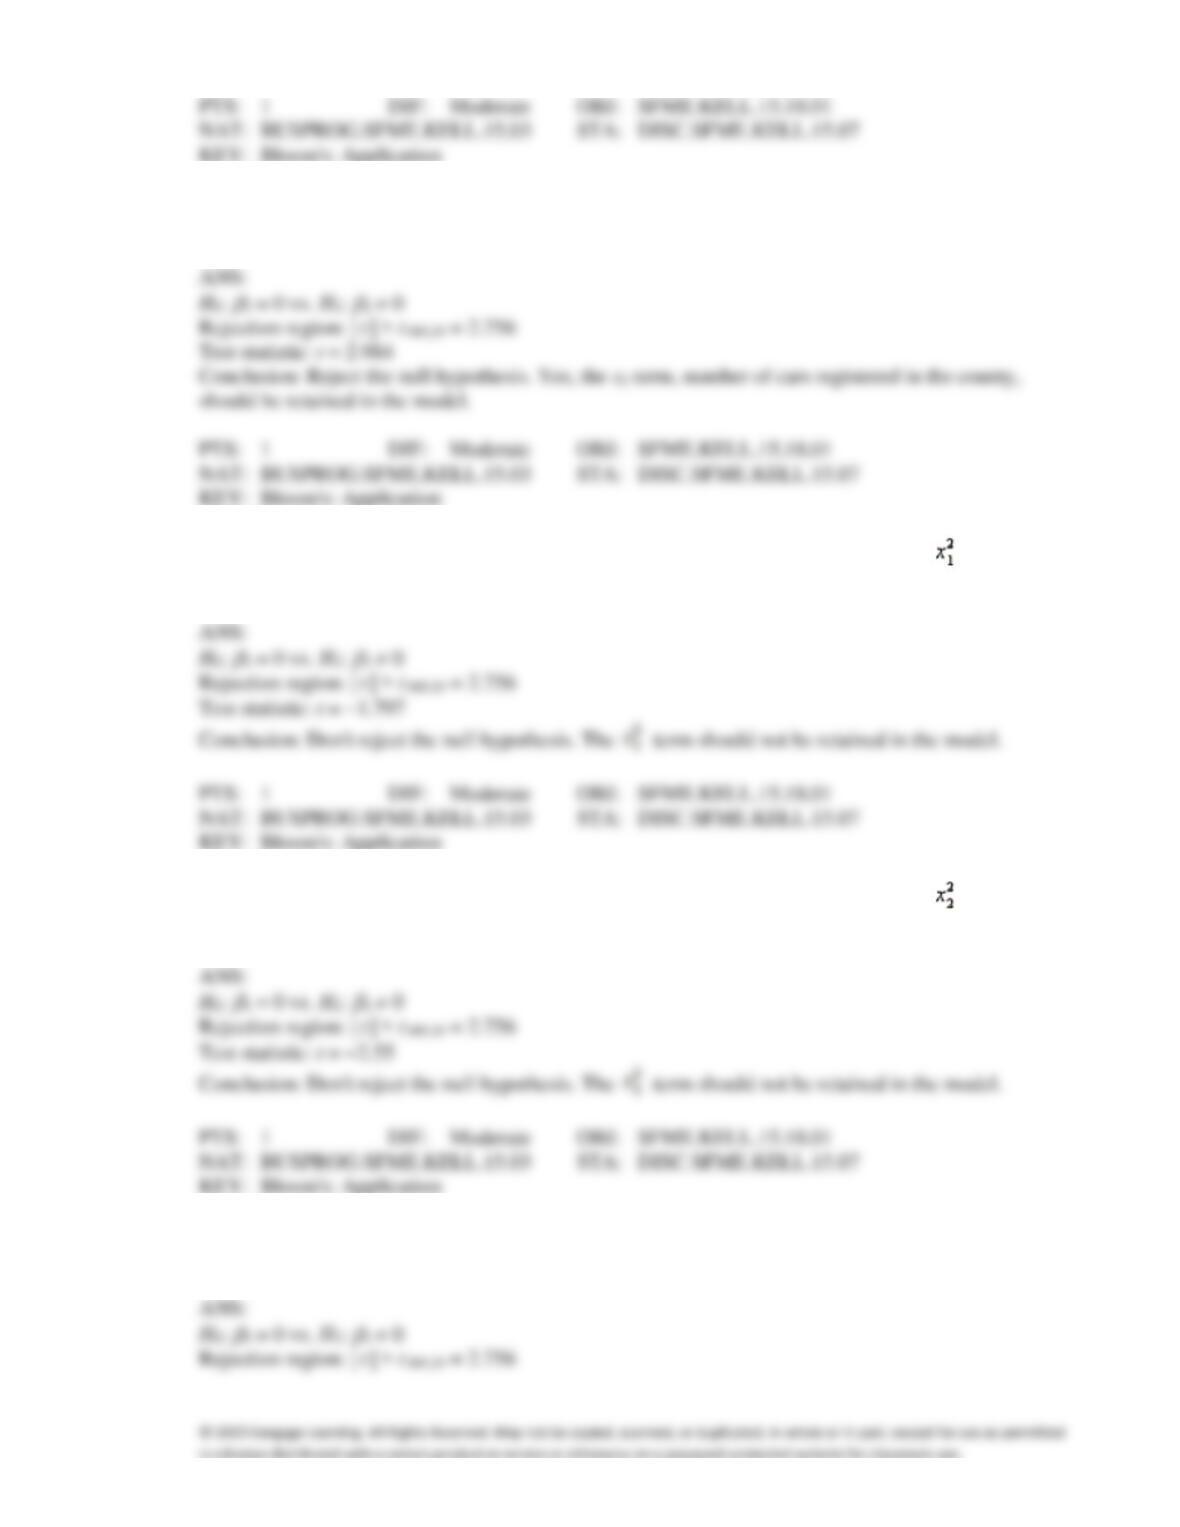
17. {Motorcycle Fatalities Narrative} Test at the 1% significance level to determine if the x2 term should
be retained in the model.
18. {Motorcycle Fatalities Narrative} Test at the 1% significance level to determine if the term should
be retained in the model.
19. {Motorcycle Fatalities Narrative} Test at the 1% significance level to determine if the term should
be retained in the model.
20. {Motorcycle Fatalities Narrative} Test at the 1% significance level to determine if the interaction term
should be retained in the model.
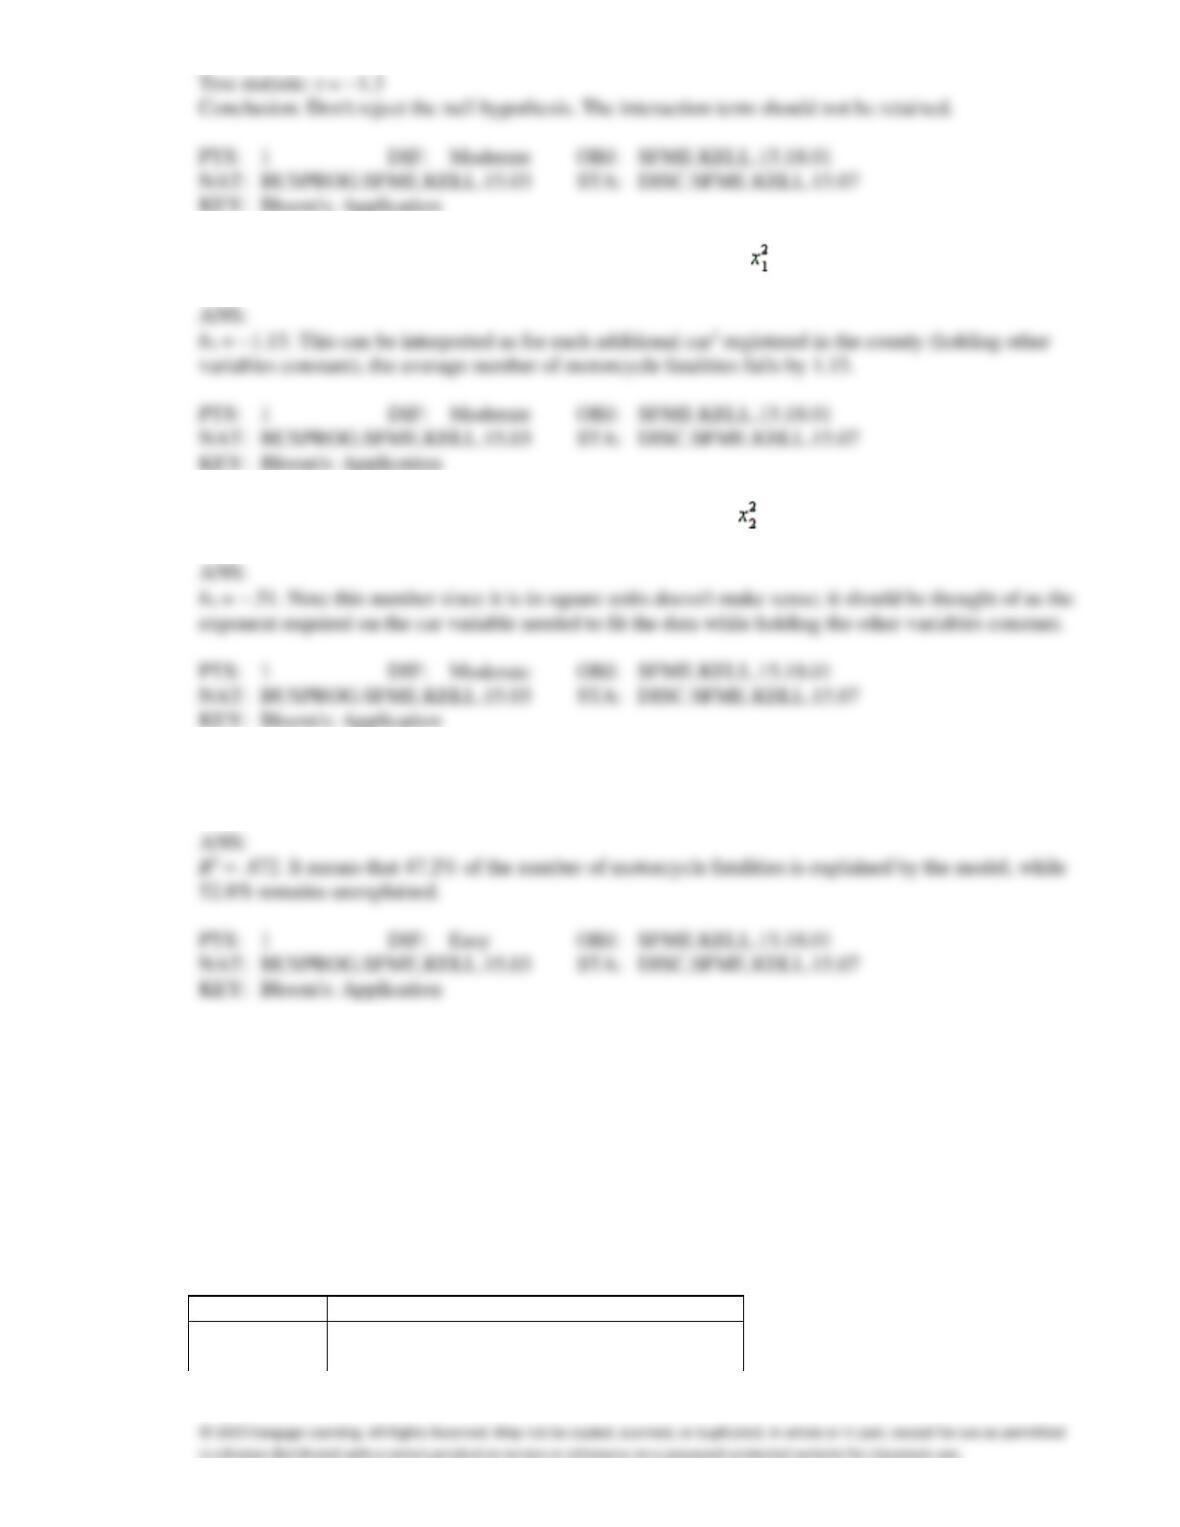
21. {Motorcycle Fatalities Narrative} What does the coefficient of tell you about the model?
22. {Motorcycle Fatalities Narrative} What does the coefficient of tell you about the model?
23. {Motorcycle Fatalities Narrative} What is the multiple coefficient of determination? What does this
statistic tell you about the model?
Silver Prices
An economist is in the process of developing a model to predict the price of silver. She believes that
the two most important variables are the price of a barrel of oil (x1) and the interest rate (x2). She
proposes the first-order model with interaction: y =
0 +
1x1 +
2x2 +
3x1x3 +
. A random sample of
20 daily observations was taken. The computer output is shown below.
THE REGRESSION EQUATION IS
y = 115.6 + 22.3x1 + 14.7x2 − 1.36x1x2
Predictor
Coef
StDev
T
Constant
115.6
78.1
1.480
x1
22.3
7.1
3.141
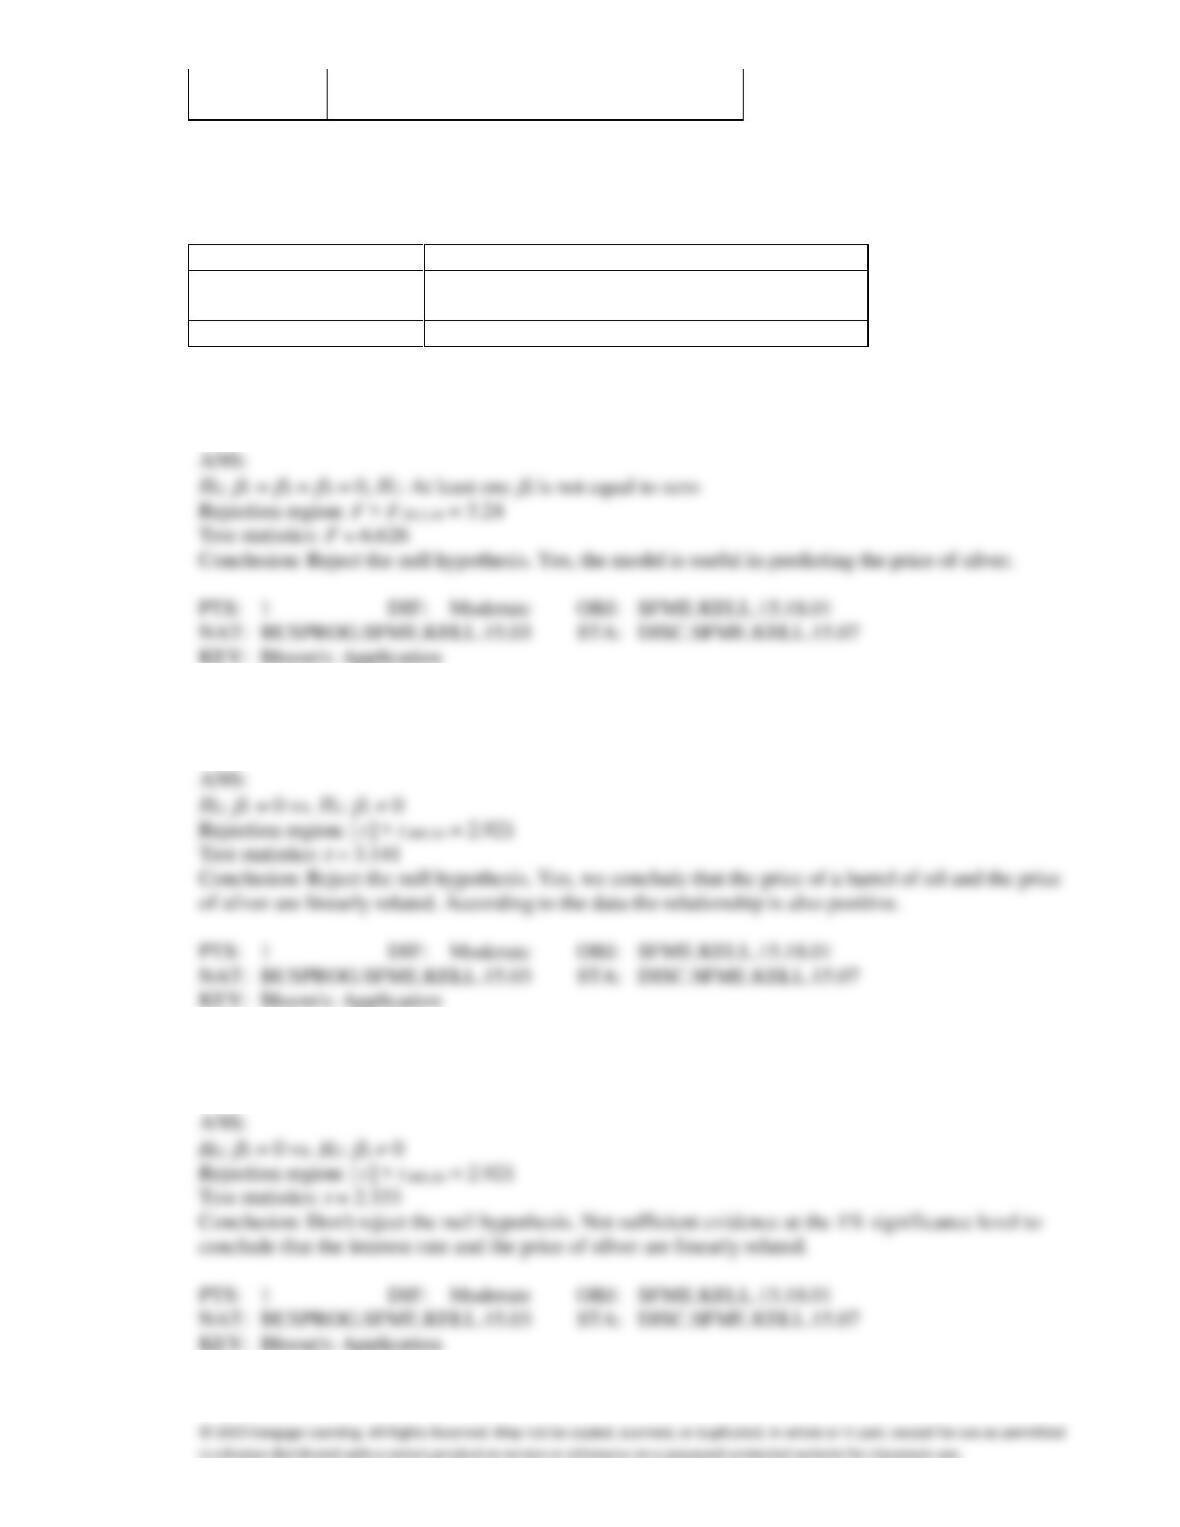
x2
14.7
6.3
2.333
x1x2
−1.36
.52
−2.615
S = 20.9
R−Sq = 55.4%
ANALYSIS OF VARIANCE
Source of Variation
df
SS
MS
F
Regression
3
8661
2887.0
6.626
Error
16
6971
435.7
Total
19
15632
24. {Silver Prices Narrative} Do these results allow us at the 5% significance level to conclude that the
model is useful in predicting the price of silver?
25. {Silver Prices Narrative} Is there sufficient evidence at the 1% significance level to conclude that the
price of a barrel of oil and the price of silver are linearly related?
26. {Silver Prices Narrative} Is there sufficient evidence at the 1% significance level to conclude that the
interest rate and the price of silver are linearly related?
27. {Silver Prices Narrative} Is there sufficient evidence at the 1% significance level to conclude that the
interaction term should be retained?
28. {Silver Prices Narrative} Interpret the coefficient b1.
29. {Silver Prices Narrative} Interpret the coefficient b2.
30. A first-order model was used in regression analysis involving 25 observations to study the relationship
between a dependent variable y and three independent variables x1, x2, and x3. The analysis showed that
the mean squares for regression is 160 and the sum of squares for error is 1050. In addition, the
following is a partial computer printout.
Predictor
Coef
StDev
Constant
25
4
x1
18
6
x2
−12
4.8
x3
6
5
a.
Develop the ANOVA table.
b.
Is there enough evidence at the 5% significance level to conclude that the model is useful
in predicting the value of y?
c.
Test at the 5% significance level to determine whether x1 is linearly related to y.
d.
Is there sufficient evidence at the 5% significance level to indicate that x2 is negatively
linearly related to y?
e.
Is there sufficient evidence at the 5% significance level to indicate that x3 is positively
linearly related to y?
31. In explaining the amount of money spent on gifts for a child’s birthday each year, the independent
variable, age of child, is best represented by a dummy variable.
32. An indicator variable (also called a dummy variable) is a variable that can assume either one of two
values (usually 0 and 1), where one value represents the existence of a certain condition, and the other
value indicates that the condition does not hold.
33. It is not possible to incorporate nominal variables into a regression model.