1
6
4
7
2
5
4
5
3
7
6
8
4
7
7
8
5
9
9
9
6
5
7
6
7
4
4
5
8
6
3
7
9
5
6
6
7
7
8
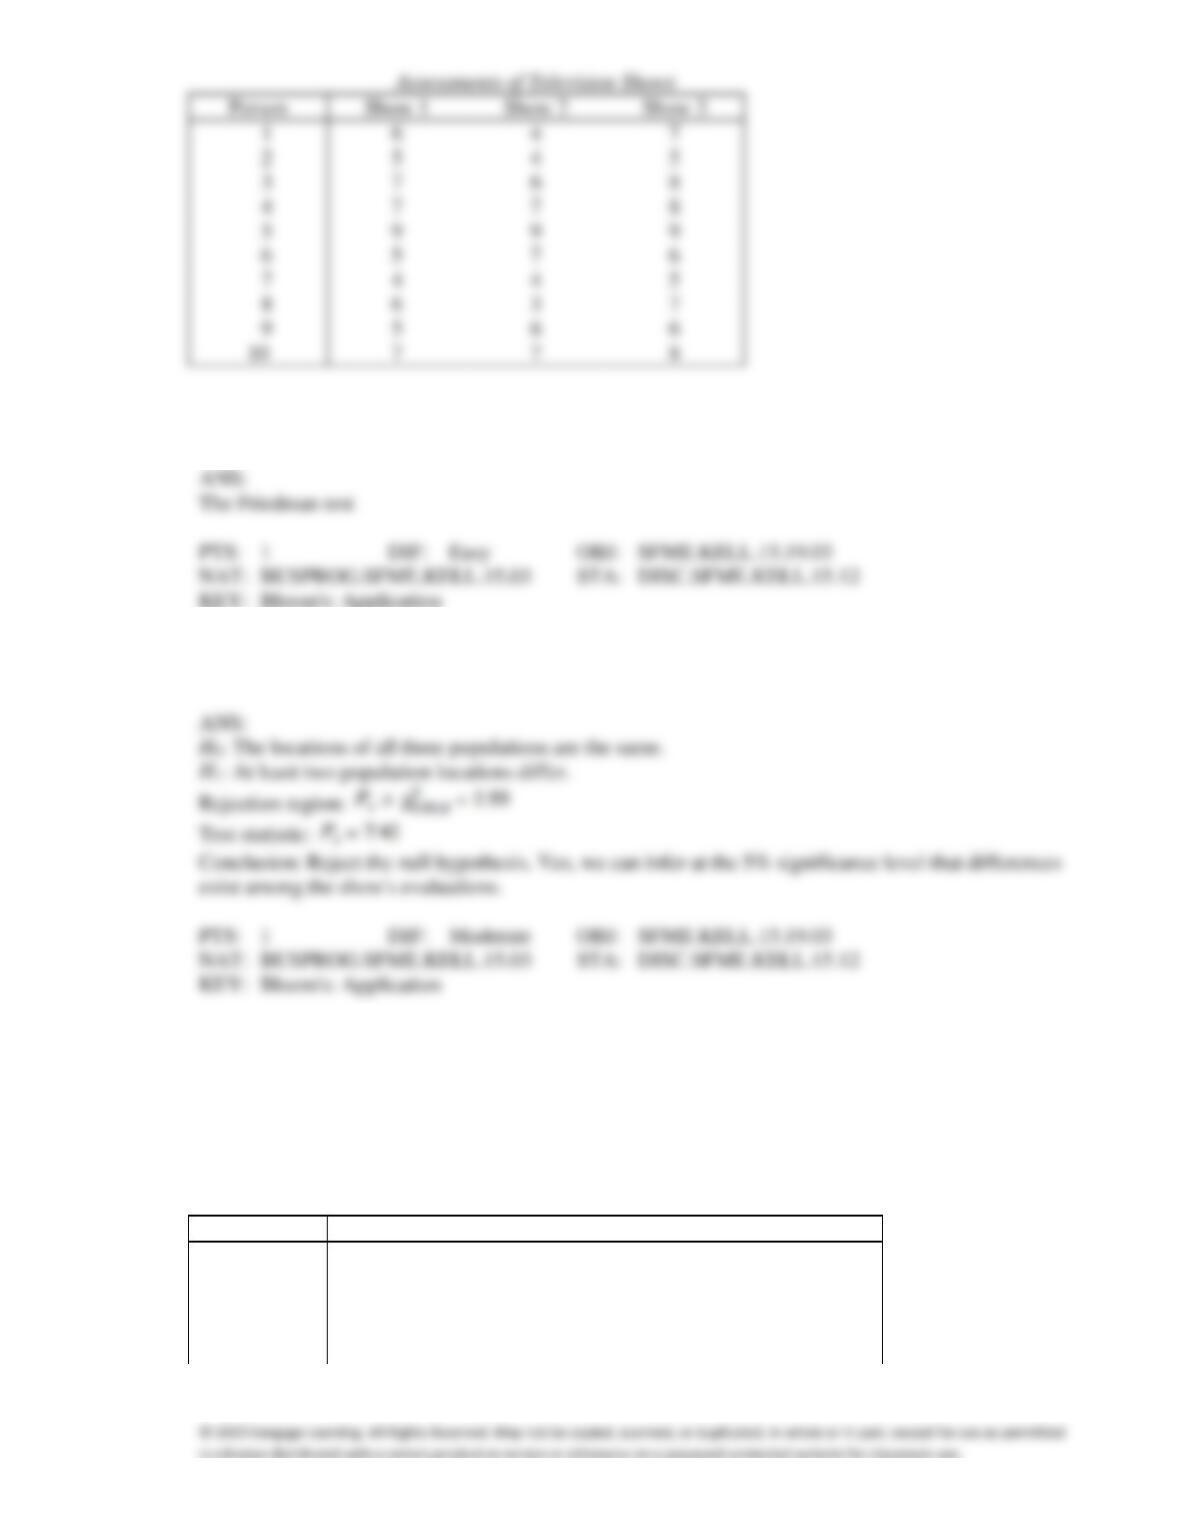
105. {Assessments of TV Shows Narrative} Which statistical technique is appropriate if the television
network executives want to compare the three comedy shows?
106. {Assessments of TV Shows Narrative} Can we infer at the 5% significance level that differences exist
among the show’s evaluations?
Frozen TV Dinner
The general manager of a frozen TV dinner maker must decide which one of four new dinners to
introduce to the market. He decides to perform an experiment to help make a decision. Each dinner is
sampled by ten people who then rate the product on a 7-point scale, where 1 = poor, and 7 = excellent.
The results are shown below.
Taste Ratings
Respondent
Dinner 1
Dinner 2
Dinner 3
Dinner 4
1
6
6
4
5
2
5
5
2
4
3
7
7
3
4
4
6
6
5
4
5
7
6
4
3
6
7
5
3
5
7
6
4
3
4
8
5
6
4
6
9
4
4
3
5
10
7
5
6
4
107. {Frozen TV Dinner Narrative} Which statistical technique can the general manager use to help him
make a decision?
108. {Frozen TV Dinner Narrative} Can the general manager infer at the 5% significance level that there
are differences in the taste ratings of the four dinners?
109. {Frozen TV Dinner Narrative} Using the appropriate statistical table, what statement can be made
about the p-value for this test?
Airlines Ranking
Ten business people who fly frequently from Las Vegas to Miami were asked to rank four airlines in
terms of the quality of service. The people assigned scores using a 5-point Likert scale where: 1 = bad,
2 = poor, 3 = average, 4 = good, and 5 = excellent. The results are shown below:
Airline
Person
A
B
C
D
1
1
3
5
2
2
5
4
2
1
3
2
5
3
2
4
4
2
4
1
5
3
3
1
5
6
4
4
5
3
7
3
4
1
4
8
2
5
2
1
9
5
3
4
2
10
5
5
4
3
110. {Airlines Ranking Narrative} Which test is appropriate if you want to compare the quality of service
of the four airlines?
111. {Airlines Ranking Narrative} Can we conclude at the 5% significance level that there are differences
in service quality among the four airlines?
112. {Airlines Ranking Narrative} Using the appropriate statistical table, what statement can be made about
the p-value for the test in the previous question? Explain how to use the p-value for testing the
hypotheses.
113. The Spearman correlation coefficient is calculated using the ranks of the data, rather than the values of
the data themselves.
114. If both variables have a normal distribution, you should use the Spearman rank correlation coefficient
to look for relationships, rather than the Pearson correlation coefficient.
115. The Spearman rank correlation coefficient is calculated by first ranking the data values, and then
calculating the Pearson correlation coefficient of the ranks.
116. To determine whether a relationship exists between two variables, the hypotheses to be tested are H0:
rs = 0 vs. H1: rs 0.
117. The population Spearman correlation coefficient is labeled
s, and the sample statistic used to estimate
its value is labeled rs.
118. To determine if a relationship exists between two variables, the hypotheses to be tested are H0: rs = 0
vs. H1: rs 0.
119. You can only conduct two-tail tests of the Spearman rank correlation coefficient.
120. When n > 30, rs has an approximate normal distribution even though the data does not.
121. If both variables are ordinal, the value of the Spearman rank correlation coefficient is equal to the
122. The rejection region for the test H0:
s = 0 vs. H1:
s 0 is based on the absolute value of rs.
123. If all the x values and all the y values are positive numbers, then
must be > 0.
124. The Spearman rank correlation coefficient allows us to measure and test to determine whether there is
evidence of a linear relationship between two variables if:
a.
one or both variables is (are) ordinal
b.
both variables are interval but the normality requirement for parametric tests is not
satisfied.
c.
both a and b.
d.
neither a nor b.
ANS:

C
125. The Spearman rank correlation coefficient is used to determine if a relationship exits between two
variables when:
a.
one of the variables is ordinal.
b.
both of the variables are ordinal.
c.
both variables are interval and the normality requirement is not satisfied.
d.
All of these choices are true.
126. When the sample size n is greater than 30, the Spearman rank correlation coefficient rs is
approximately normally distributed with:
a.
mean 0 and standard deviation 1.
b.
mean 1 and standard deviation .
c.
mean 0 and standard deviation .
d.
mean 1 and standard deviation .
127. Which of the following statements about the Spearman rank-correlation coefficient is true?
a.
It is equal to the Pearson correlation coefficient of the ranks of the data.
b.
The population Spearman correlation coefficient is labeled
s.
c.
Values near +1 point to an uphill relationship between the two variables.
d.
All of these choices are true.
128. Which of the following shows the calculation of the sample Spearman rank coefficient?
a.
sab − sasb
b.
sab / sasb
c.
sasb / sab
d.
None of these choices.
129. The Spearman rank-correlation coefficient can only take on values between:
a.
−1 and +1
b.
− and 0
c.
0 and +
d.
− and +1
130. When the relationship between two variables is very strong and decreasing in a linear way, the
Spearman rank-correlation coefficient will be close to:
a.
0
b.
−1
c.
d.
131. In testing H0:
s = 0 vs. H1:
s 0 when the sample size n > 30, the test statistic is approximately
normally distributed with mean 0 and standard deviation equal to:
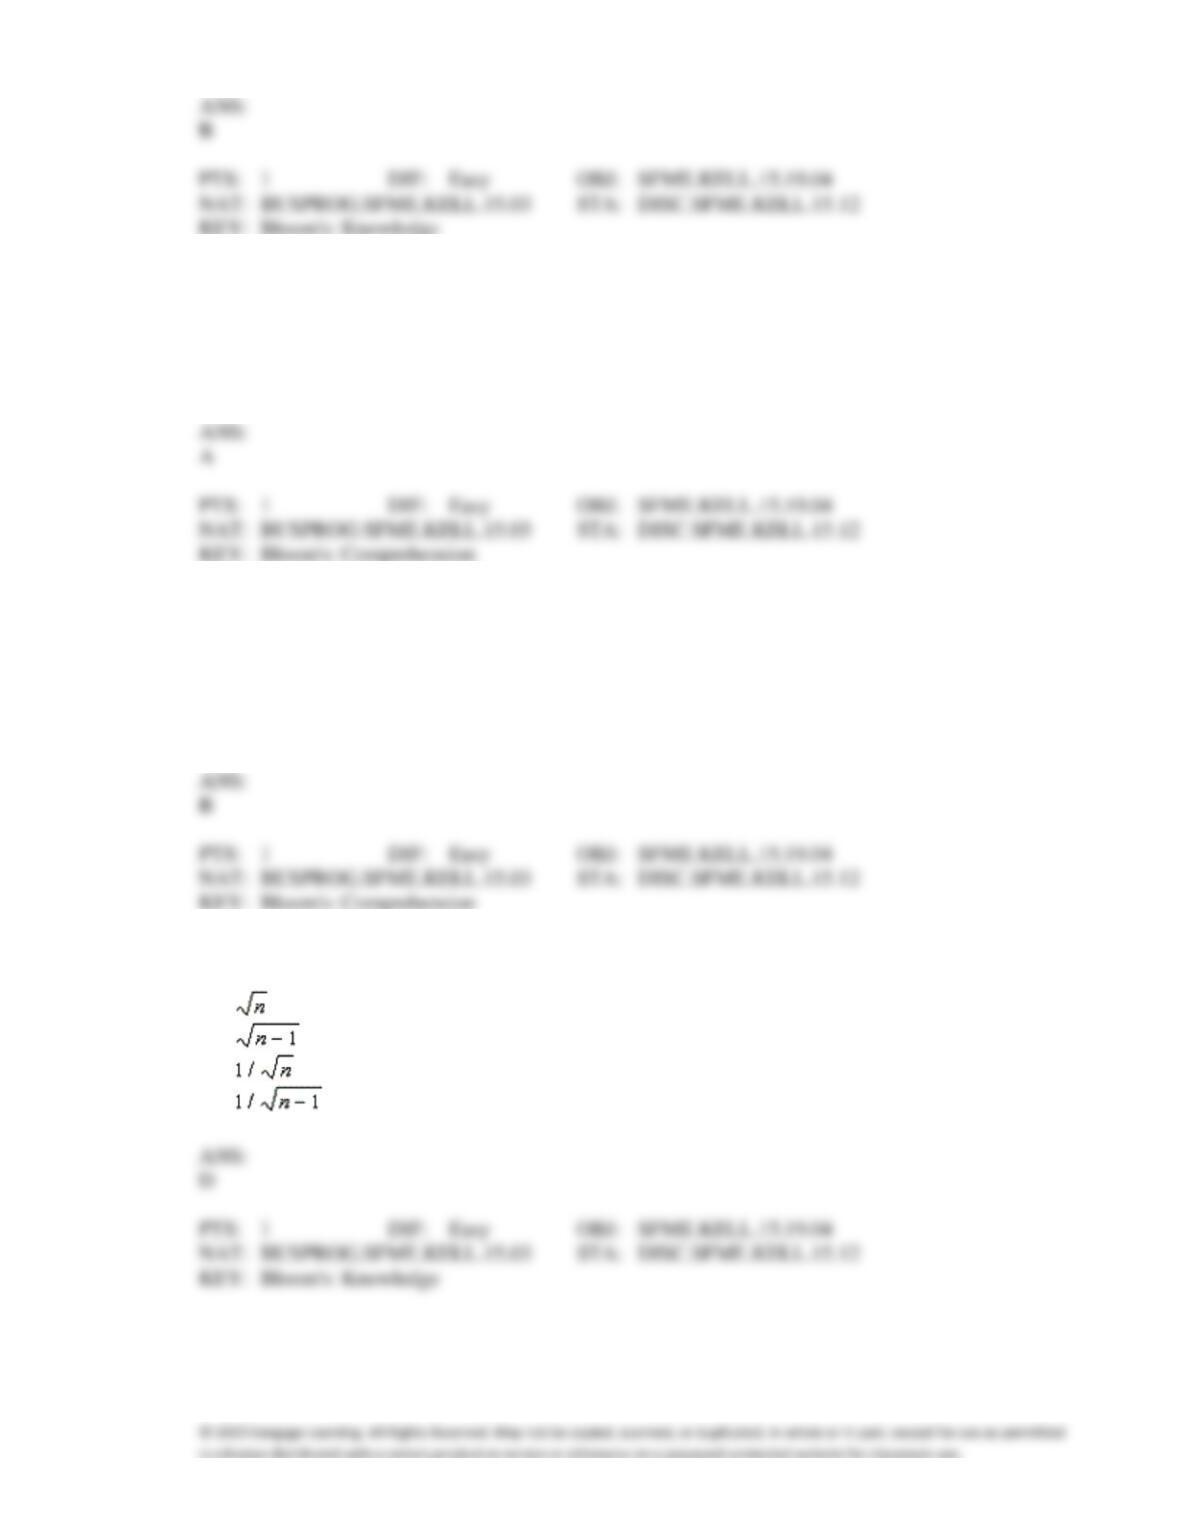
a.
b.
c.
d.
132. The population Spearman correlation coefficient is labeled ____________________ and the sample
statistic used to estimate its value is labeled ____________________.

133. The Spearman rank correlation coefficient is equal to the ____________________ correlation
coefficient of the ranks of the data.
ANS:
134. The ____________________ correlation coefficient is used to look for a linear relationship between x
and y when both variables are interval and have normal distributions.
ANS:
135. The ____________________ correlation coefficient is used to look for a relationship between x and y
when both variables are interval but do not have normal distributions.
136. The Spearman rank correlation coefficient is equal to Pearson’s correlation coefficient based on the
____________________ of the data.
ANS:
137. When n > 30 ____________________ has an approximate normal distribution.
ANS:

138. When n > 30, rs has an approximate normal distribution with mean ____________________.
139. The nonparametric counterpart to the Pearson correlation coefficient is the ____________________
correlation coefficient.
140. The general manager of a chain of Pet stores believes that experience is the most important factor in
determining the level of success of a salesperson. To examine this belief she records last month’s sales
(in $1,000s) and the years of experience of 10 randomly selected salespeople. These data are listed
below.
Salesperson
Years of Experience
Sales
1
0
7
2
2
9
3
10
20
4
3
15
5
8
18
6
5
14
7
12
20
8
7
17
9
20
30
10
15
25
Can we conclude at the 5% significance level that experience of the salesperson and sales are linearly
related? (Note we cannot assume either variable has a normal distribution.)

141. An ardent fan of television game shows has observed that, in general, the more educated the
contestant, the less money he or she wins. To test her belief she gathers data about the last eight
winners of her favorite game show. She records their winnings in dollars and the number of years of
education. The results are as follows.
Contestant
Years of Education
Winnings
1
11
750
2
15
400
3
12
600
4
16
350
5
11
800
6
16
300
7
13
650
8
14
400
Can she conclude at the 5% significance level that the more educated the contestant, the less the
money he or she wins in TV game shows? (The condition of normality is not met by these variables.)
142. A financier whose specialty is investing in movie productions has observed that, in general, movies
with “big-name” stars seem to generate more revenue than those movies whose stars are less well
known. To examine his belief he records the gross revenue and the payment (in $ millions) given to
the two highest-paid stars in the movie for ten recently released movies.
Movie
Cost of Two Highest
Gross revenue
Paid Stars
1
5.3
48
2
7.2
65
3
1.3
18
4
1.8
20
5
3.5
31
6
2.6
26
7
8.0
73
8
2.4
23
9
4.5
39
10
6.7
58

Assume that the conditions for the conducting tests of hypotheses for
and
1 (the two tests are
identical) are not met. Do the data allow us to infer at the 5% significance level that payment to the
two highest paid stars and gross revenue are linearly related?
143. A statistician investigating the relationship between the amount of precipitation (in inches) and the
number of automobile accidents gathered data for 10 randomly selected days. The results are shown
below. (We cannot assume these variables have normal distributions.)
Day
Precipitation
Number of
Accidents
1
0.05
5
2
0.12
6
3
0.05
2
4
0.08
4
5
0.10
8
6
0.35
14
7
0.15
7
8
0.30
13
9
0.10
7
10
0.20
10
Calculate the Spearman rank correlation coefficient, and test to determine at the 5% significance level
whether we can infer that a linear relationship exists between the number of accidents and the amount
of precipitation.