CHAPTER 14: ANALYSIS OF VARIANCE
TRUE/FALSE
1. The F-test used in one-way ANOVA is an extension of the t-test of
1
−
2.
2. We use the analysis of variance (ANOVA) technique to compare two or more population means.
3. The F-test in ANOVA tests whether or not the population variances are equal.
4. The sum of squares for treatments, SST, achieves its smallest value (zero) when all the sample means
are equal.
5. The analysis of variance (ANOVA) technique analyzes the variance of the data to determine whether
differences exist between the population means.
6. Conducting t-tests for each pair or population means is statistically equivalent to conducting one F-test
comparing all the population means.
7. The sum of squares for error is also known as the between-treatments variation.
8. In one-way ANOVA, the total variation SS(Total) is partitioned into two sources of variation: the sum
of squares for treatments (SST) and the sum of squares for error (SSE).
9. In ANOVA, a criterion by which the populations are classified is called a factor.
10. In one-way ANOVA, the test statistic is defined as the ratio of the mean square for error (MSE) and
the mean square for treatments (MST), namely, F = MSE / MST.
11. The F-statistic in a one-way ANOVA represents the variation within the treatments divided by the
variation between the treatments.
12. The distribution of the test statistic for analysis of variance is the F-distribution.
13. The sum of squares for treatments (SST) is the variation attributed to the differences between the
treatment means, while the sum of squares for error (SSE) measures the within-treatment variation.
14. If the numerator (MST) degrees of freedom is 3 and the denominator (MSE) degrees of freedom is 18,
the total number of observations must equal 21.
15. The sum of squares for error (SSE) measures the amount of variation that is explained by the ANOVA
model, while the sum of squares for treatments (SST) measures the amount of variation that remains
unexplained.
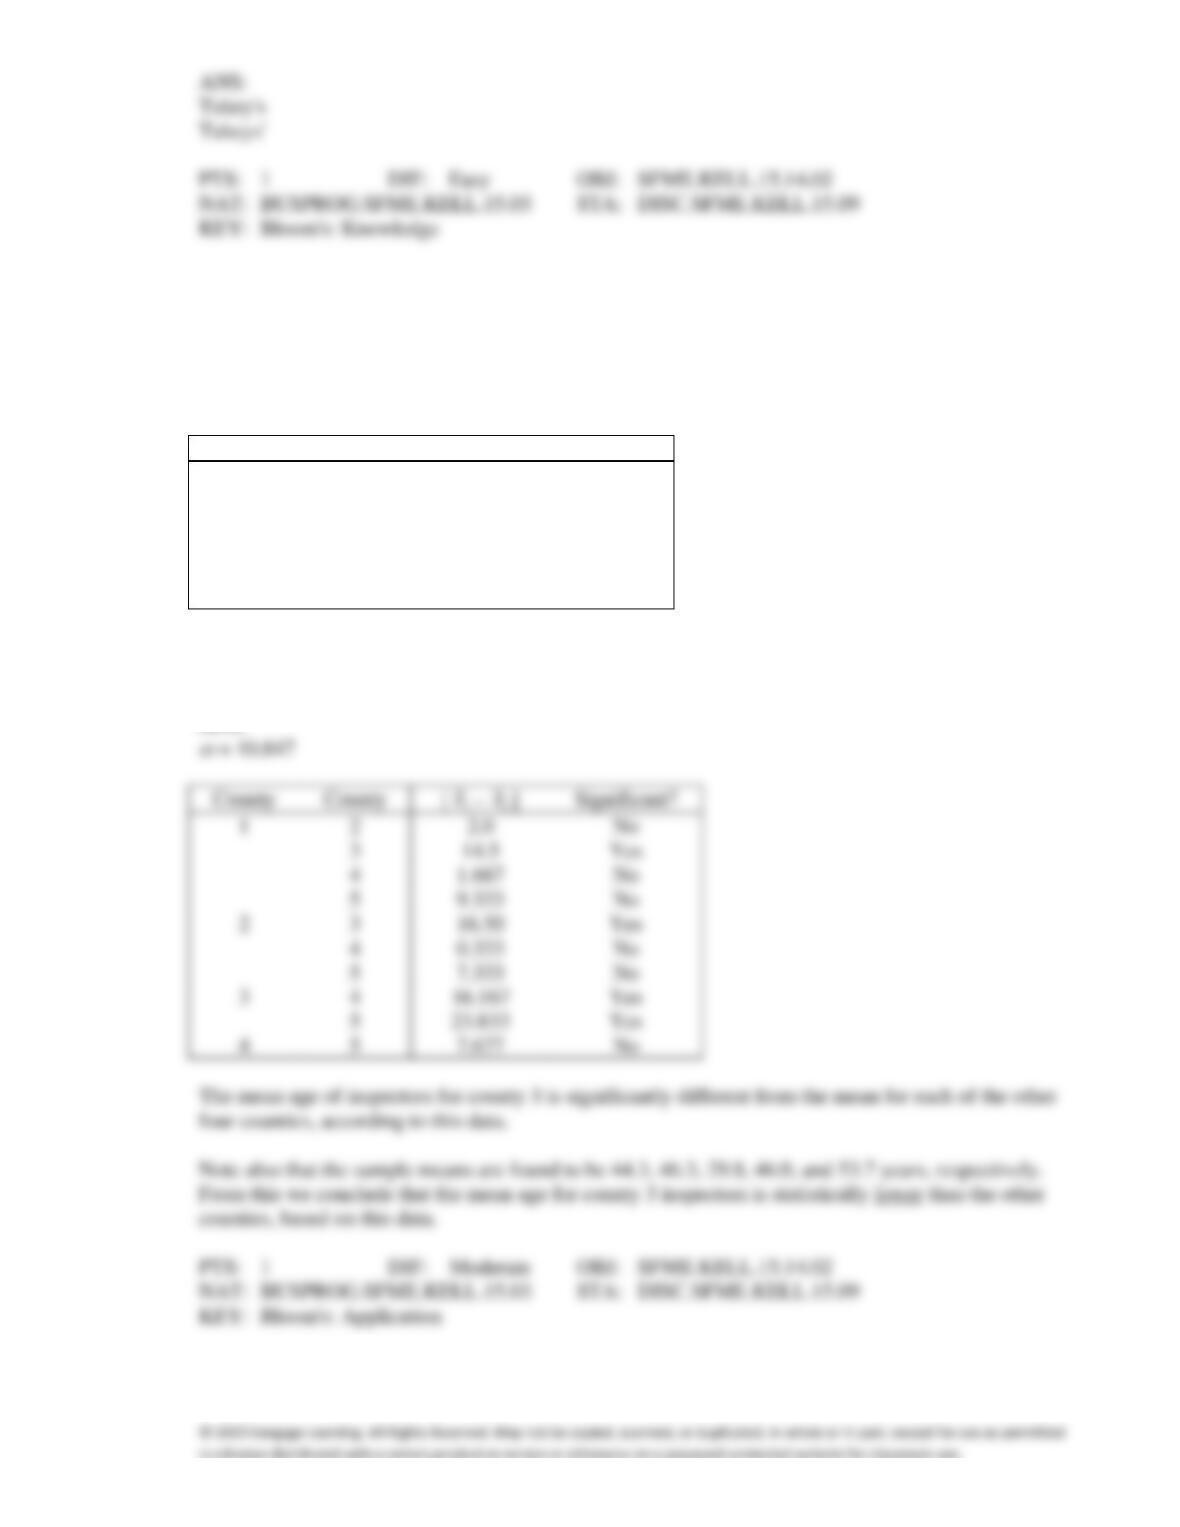
16. The analysis of variance (ANOVA) tests hypotheses about population variances and requires all the
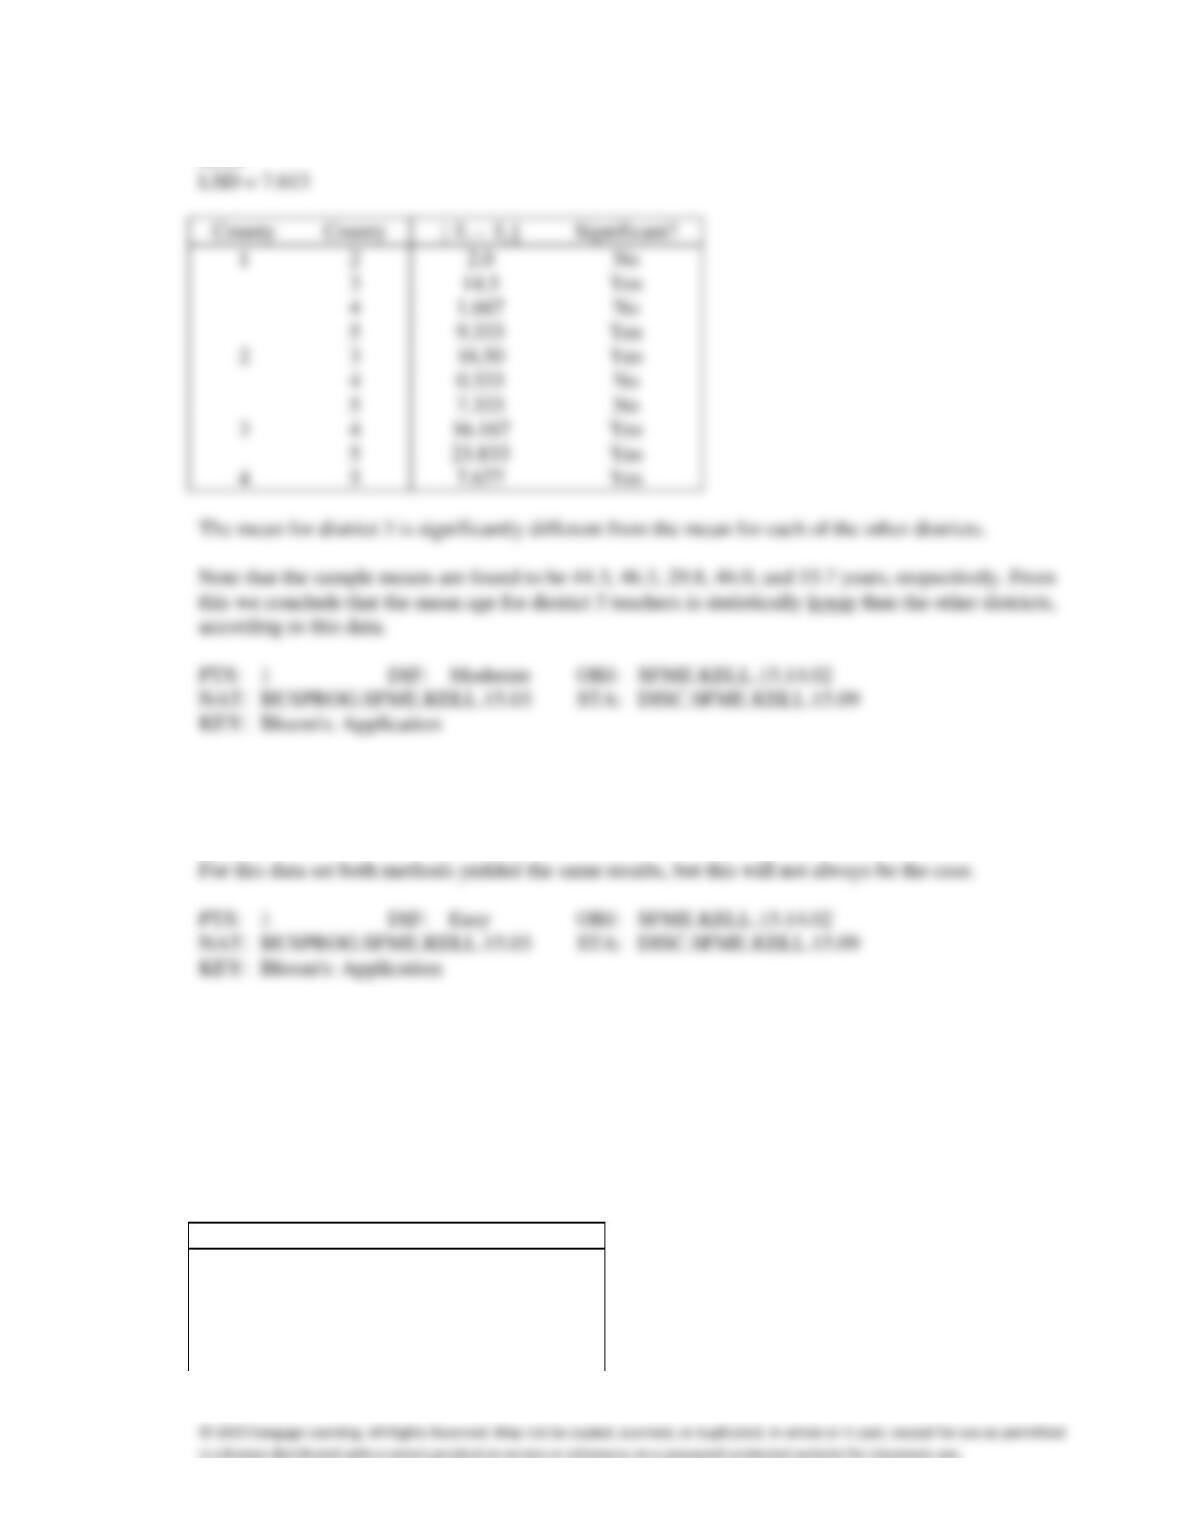
population means to be equal.
17. The F-test in ANOVA is an expansion of the t-test for two independent population means.
18. When the F-test is used for ANOVA, the rejection region is always in the right tail.
19. The within-treatments variation provides a measure of the amount of variation in the response
variables that is caused by the treatments.
20. We can use the F-test to determine whether
1 is greater than
2.
MULTIPLE CHOICE
1. The test statistic of the single-factor ANOVA equals:
a.
sum of squares for treatments / sum of squares for error.
b.
sum of squares for error / sum of squares for treatments.
c.
mean square for treatments / mean square for error.
d.
mean square for error / mean square for treatments.
2. In a single-factor analysis of variance, MST is the mean square for treatments and MSE is the mean
square for error. The null hypothesis of equal population means is rejected if:
a.
MST is much larger than MSE.
c.
MST is equal to MSE.
b.
MST is much smaller than MSE.
d.
None of these choices.
3. In one-way ANOVA, the amount of total variation that is unexplained is measured by the:
a.
sum of squares for treatments.
c.
total sum of squares.
b.
degrees of freedom.
d.
sum of squares for error.
4. In a one-way ANOVA, error variability is computed as the sum of the squared errors, SSE, for all
values of the response variable. This variability is the:
a.
the total variation.
c.
between-treatments variation.
b.
within-treatments variation.
d.
None of these choices.
5. Which of the following is not a required condition for one-way ANOVA?
a.
The sample sizes must be equal.
b.
The populations must all be normally distributed.
c.
The population variances must be equal.
d.
The samples for each treatment must be selected randomly and independently.
6. The analysis of variance is a procedure that allows statisticians to compare two or more population:
a.
proportions.
c.
variances.
b.
means.
d.
standard deviations.
7. The distribution of the test statistic for analysis of variance is the:
a.
normal distribution.
c.
F-distribution.
b.
Student t-distribution.
d.
None of these choices.
8. In the one-way ANOVA where there are k treatments and n observations, the degrees of freedom for
the F-statistic are equal to, respectively:
a.
n and k.
c.
n − k and k − 1.
b.
k and n.
d.
k − 1 and n − k.
9. In the one-way ANOVA where k is the number of treatments and n is the number of observations in all
samples, the degrees of freedom for treatments is given by:
a.
n − k
c.
n − 1
b.
k − 1
d.
n − k + 1
10. In ANOVA, the F-test is the ratio of two sample variances. In the one-way ANOVA (completely
randomized design), the variance used as a numerator of the ratio is:
a.
mean square for treatments.
c.
total sum of squares.
b.
mean square for error.
d.
None of these choices.
11. In a completely randomized design for ANOVA, the numerator and denominator degrees of freedom
are 4 and 25, respectively. The total number of observations must equal:
a.
24
c.
29
b.
25
d.
30
12. The number of degrees of freedom for the denominator in one-way ANOVA test involving 4
population means with 15 observations sampled from each population is:
a.
60
c.
56
b.
19
d.
45
13. The value of the test statistic in a completely randomized design for ANOVA is F = 6.29. The degrees
of freedom for the numerator and denominator are 5 and 10, respectively. Using an F table, the most
accurate statements to be made about the p-value is that it is:
a.
greater than 0.05
c.
between 0.010 and 0.025.
b.
between 0.001 and 0.010.
d.
between 0.025 and 0.050.
14. In one-way ANOVA, the term refers to the:
a.
weighted average of the sample means.
b.
sum of the sample means divided by the total number of observations.
c.
sum of the population means.
d.
sum of the sample means.
15. Which of the following is a required condition for ANOVA?
a.
The populations are normally distributed.
b.
The population variances are equal.
c.
The samples are independent.
d.
All of these choices are required conditions for ANOVA.
16. In the one-way ANOVA where k is the number of treatments and n is the number of observations in all
samples, the number of degrees of freedom for error is:
a.
k − 1
c.
n − k
b.
n − 1
d.
n − k + 1
17. One-way ANOVA is applied to independent samples taken from three normally distributed
populations with equal variances. Which of the following is the null hypothesis for this procedure?
a.
1 +
2 +
3 = 0
c.
1 =
2 =
3 = 0
b.
1 +
2 +
3 0
d.
1 =
2 =
3
18. How does conducting multiple t-tests compare to conducting a single F-test?
a.
Multiple t-tests increases the chance of a Type I error.
b.
Multiple t-tests decreases the chance of a Type I error.
c.
Multiple t-tests does not affect the chance of a Type I error.
d.
This comparison cannot be made without knowing the number of populations.
19. In one-way analysis of variance, between-treatments variation is measured by the:
a.
SSE
c.
SST
b.
SS(Total)
d.
standard deviation
20. One-way ANOVA is applied to independent samples taken from four normally distributed populations
with equal variances. If the null hypothesis is rejected, then we can infer that
a.
all population means are equal.
c.
at least two population means are equal.
b.
all population means differ.
d.
at least two population means differ.
21. Consider the following partial ANOVA table:
Source of Variation
SS
df
MS
F
Treatments
75
*
25
6.67
Error
60
*
3.75
Total
135
19
The numerator and denominator degrees of freedom for the F-test (identified by asterisks) are
a.
4 and 15
c.
15 and 4
b.
3 and 16
d.
16 and 3
22. Consider the following ANOVA table:
Source of Variation
SS
df
MS
F
Treatments
4
2
2.0
0.80
Error
30
12
2.5
Total
34
14
The number of treatments is
a.
13
c.
3
b.
5
d.
12
23. In one-way analysis of variance, within-treatments variation is measured by:
a.
sum of squares for error.
c.
total sum of squares.
b.
sum of squares for treatments.
d.
standard deviation.
24. Consider the following ANOVA table:
Source of Variation
SS
df
MS
F
Treatments
128
4
32
2.963
Error
270
25
10.8
Total
398
29
The total number of observations is:
a.
25
c.
30
b.
29
d.
32
25. In one-way analysis of variance, if all the sample means are equal, then the:
a.
total sum of squares is zero.
b.
sum of squares for treatments is zero.
c.
sum of squares for error is zero.
d.
sum of squares for error equals sum of squares for treatments.
26. Which of the following components in an ANOVA table is not additive?
a.
Sum of squares
c.
Mean squares
b.
Degrees of freedom
d.
All of these choices are additive.
27. In which case can an F-test be used to compare two population means?
a.
For one tail tests only.
c.
For either one or two tail tests.
b.
For two tail tests only.
d.
None of these choices.
28. The F-test statistic in a one-way ANOVA is equal to:
a.
MST/MSE
c.
MSE/MST
b.
SST/SSE
d.
SSE/SST
29. The numerator and denominator degrees of freedom for the F-test in a one-way ANOVA are,
respectively,
a.
(n − k) and (k − 1)
c.
(k − n) and (n − 1)
b.
(k − 1) and (n − k)
d.
(n − 1) and (k − n)
30. Which of the following statements is true?
a.
F = t2
b.
The F-test can be used instead of a two tail t-test when you compare two population
means.
c.
Doing three t-tests is statistically equivalent to doing one F-test when you compare three
population means.
d.
All of these choices are true.
COMPLETION
1. The ANOVA procedure tests to determine whether differences exist between two or more population
____________________.
2. The null hypothesis of ANOVA is that all the population means are ____________________.
3. The alternative hypothesis of ANOVA is that ____________________ population means are different.
4. In ANOVA the populations are classified according to one or more criterion, called
____________________.
5. SST measures the variation ____________________ treatments.
6. SSE measures the variation ____________________ treatments.
7. The F-test statistic in ANOVA is equal to MS____________________ divided by
MS____________________ and H0 is rejected for ____________________ values of F.
8. If SST explains a significant portion of the total variation, we conclude that the population means
____________________ (do/do not) differ.
9. The F-test in ANOVA requires that the random variable be ____________________ distributed with
equal ____________________.
10. If we square the t–statistic for two means, the result is the ____________________-statistic.
SHORT ANSWER
TV News Viewing Habits
A statistician employed by a television rating service wanted to determine if there were differences in
television viewing habits among three different cities in New York. She took a random sample of five
adults in each of the cities and asked each to report the number of hours spent watching television in
the previous week. The results are shown below. (Assume normal distributions with equal variances.)
Hours Spent Watching News on Television
Albany
Syracuse
Utica
25
28
23
31
33
18
18
35
21
23
29
17
27
36
15
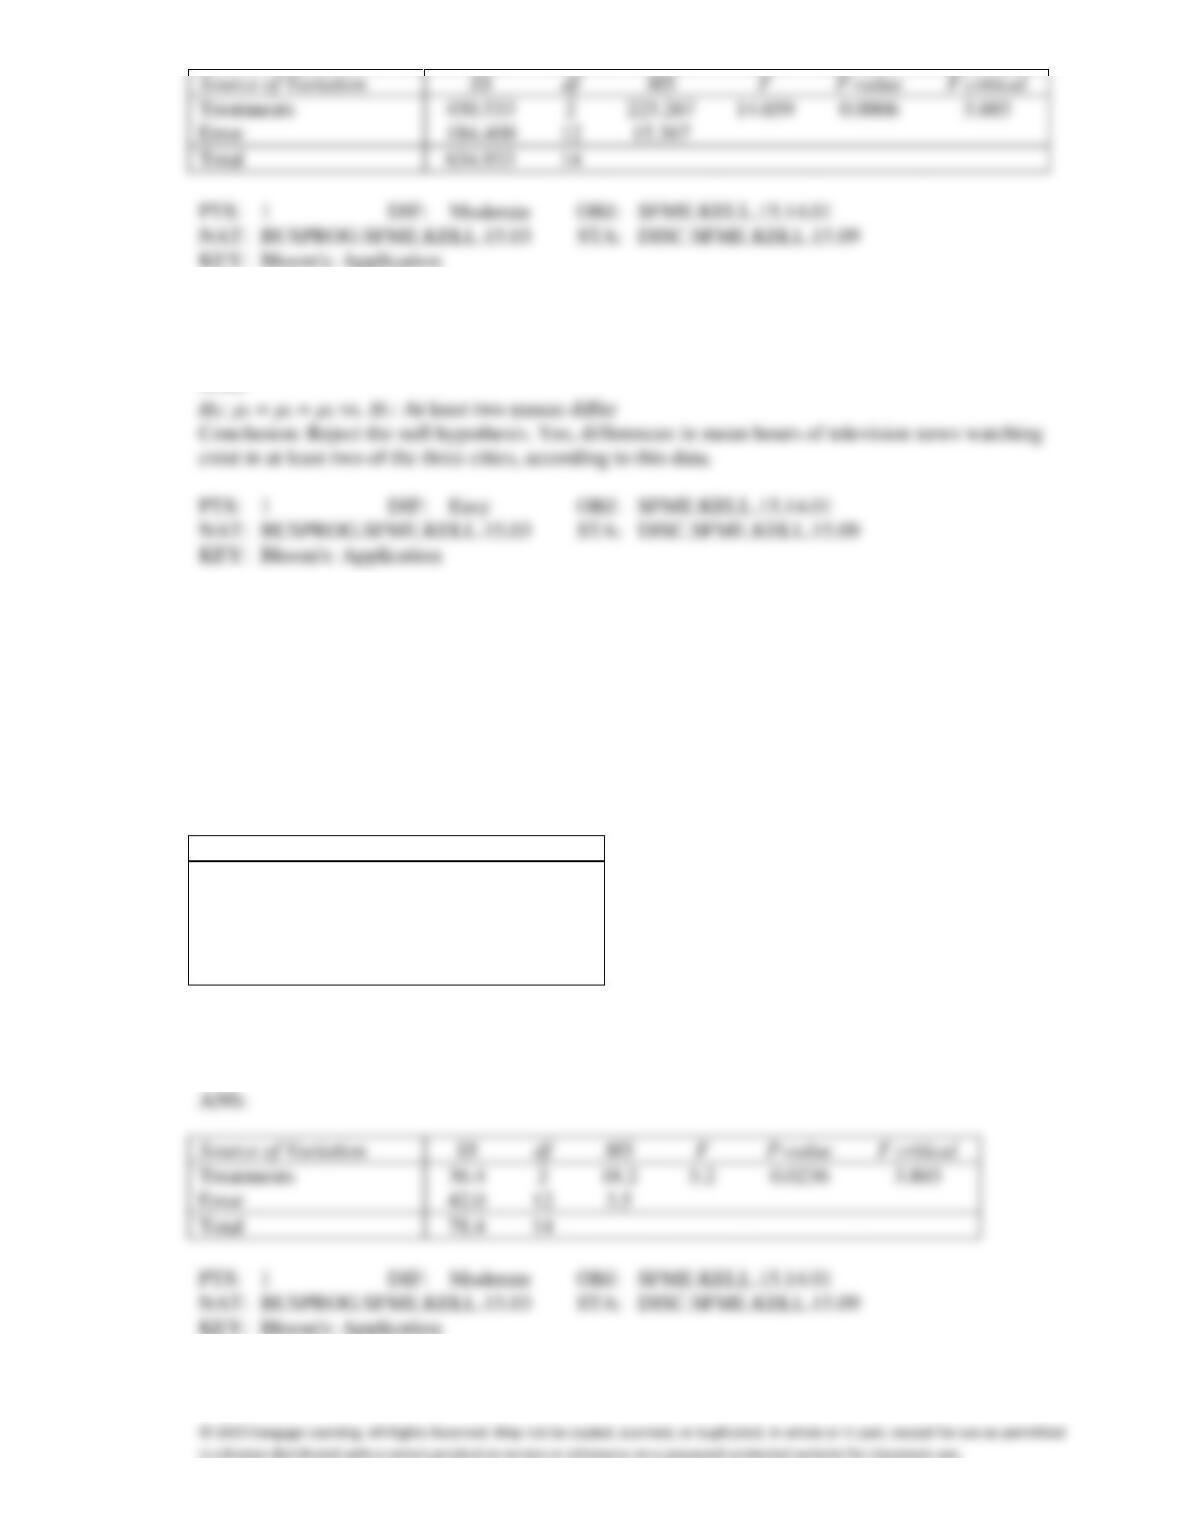
1. {TV News Viewing Habits Narrative} Set up the ANOVA Table. Use
= 0.05 to determine the
critical value.
ANS:
2. {TV News Viewing Habits Narrative} Can she infer at the 5% significance level that differences in
hours of television watching exist among the three cities?
ANS:
Arthritis Pain Formulas
A pharmaceutical manufacturer has been researching new medications formulas to provide quicker
relief of arthritis pain. Their laboratories have produced three different medications and they want to
determine if the different medications produce different responses. Fifteen people who complained of
arthritis pains were recruited for an experiment; five were randomly assigned to each medication. Each
person was asked to take the medicine and report the length of time until some relief was felt
(minutes). The results are shown below. (Assume normal distributions with equal variances.)
Time in Minutes Until Relief Is Felt (min)
Medication 1
Medication 2
Medication 3
4
2
6
8
5
7
6
3
7
9
7
8
8
1
6
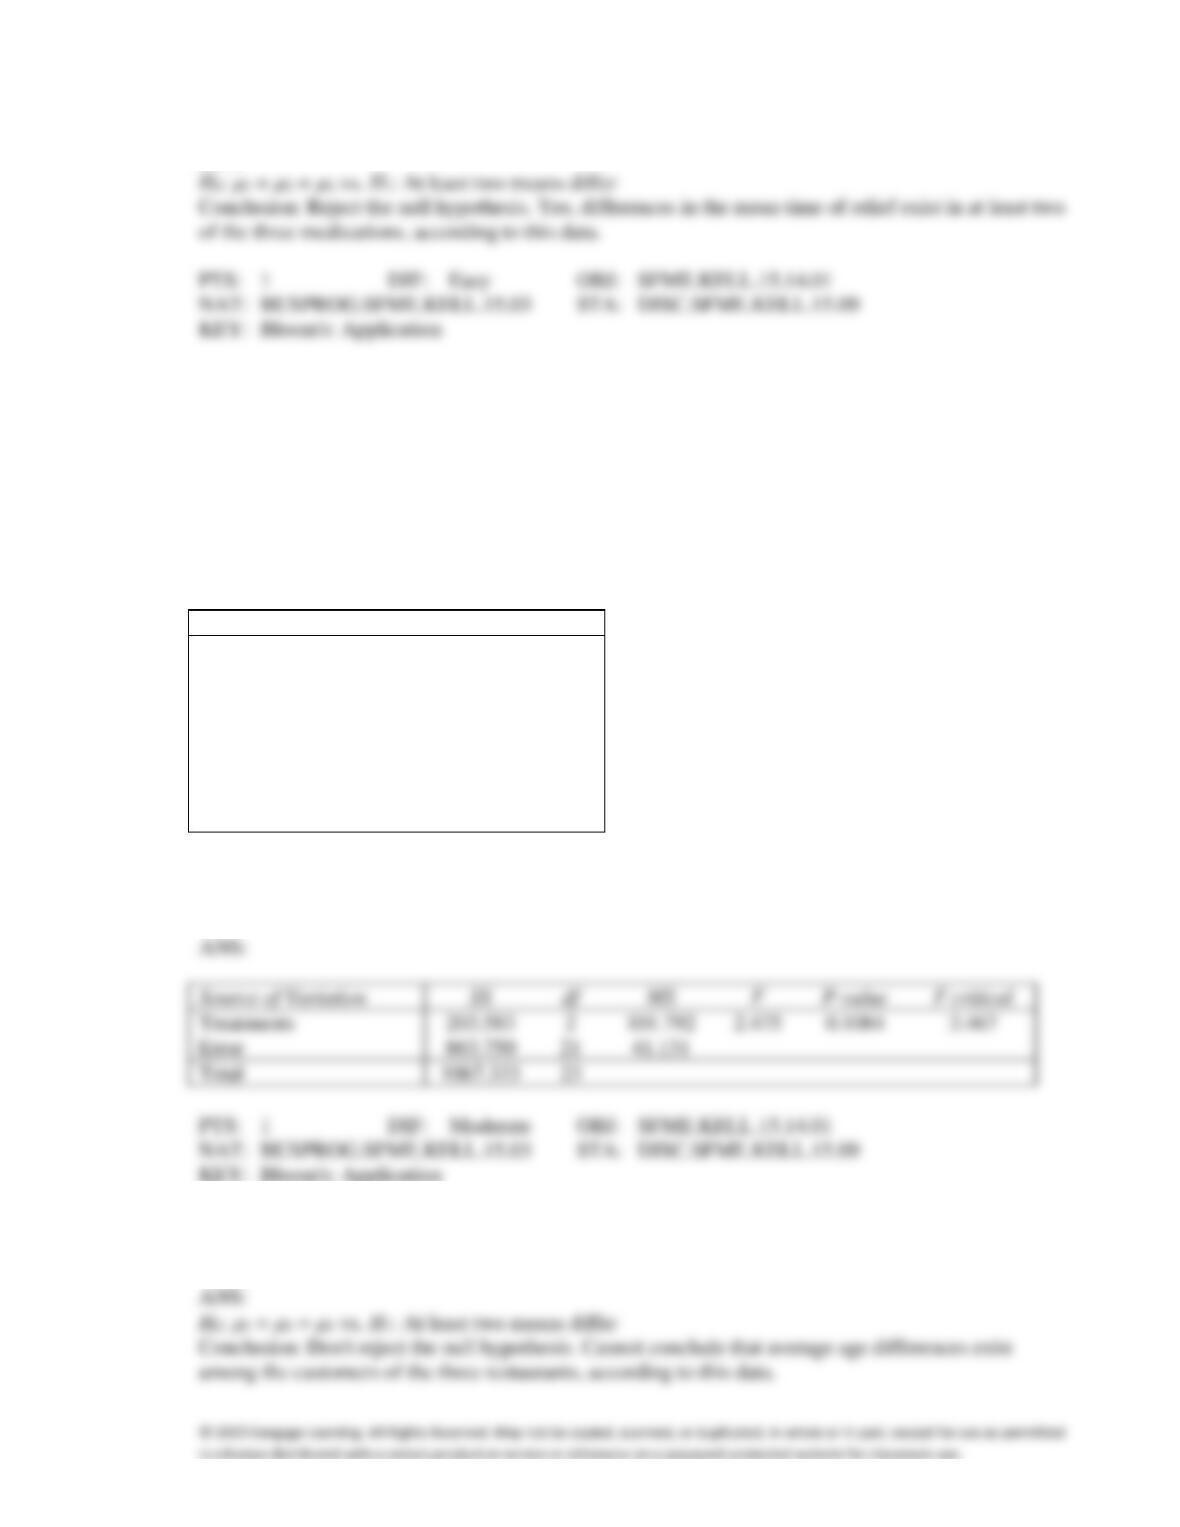
3. {Arthritis Pain Formulas Narrative} Set up the ANOVA Table. Use
= 0.05 to determine the critical
value.
4. {Arthritis Pain Formulas Narrative} Do these data provide sufficient evidence to indicate that
differences in the average time of relief exist among the three medications? Use
= 0.05.
ANS:
Sub Sandwich Customers
The marketing manager of a Sub Shop chain is in the process of examining some of the demographic
characteristics of her customers. In particular, she would like to investigate the belief that the ages of
the customers of Sub Shops, hamburger emporiums, and fast-food chicken restaurants are different.
The ages of eight randomly selected customers of each of the restaurants are recorded and listed
below. From previous analyses we know that the ages are normally distributed with equal variances
for each group.
Customers’ Ages
Subs
Hamburger
Chicken
23
26
25
19
20
28
25
18
36
17
35
23
36
33
39
25
25
27
28
19
38
31
17
31
5. {Sub Sandwich Customers Narrative} Set up the ANOVA Table. Use
= 0.05 to determine the
critical value.
863.750
6. {Sub Sandwich Customers Narrative} Do these data provide enough evidence at the 5% significance
level to infer that there are differences in ages among the customers of the three restaurants?
GMAT Scores
A recent college graduate is in the process of deciding which one of three graduate schools he should
apply to. He decides to judge the quality of the schools on the basis of the Graduate Management
Admission Test (GMAT) scores of those who are accepted into the school. A random sample of six
students in each school produced the following GMAT scores. Assume that the data are normally
distributed with equal variances for each school.
GMAT Scores
School 1
School 2
School 3
650
105
590
620
550
510
630
700
520
580
630
500
710
600
490
690
650
530
7. {GMAT Scores Narrative} Set up the ANOVA Table. Use
= 0.05 to determine the critical value.
Treatments
Error
Total
8. {GMAT Scores Narrative} Can he infer at the 10% significance level that the GMAT scores differ
among the three schools?
9. In a completely randomized design, 15 experimental units were assigned to each of four treatments.
Fill in the blanks (identified by asterisks) in the partial ANOVA table shown below.
Source of Variation
SS
df
MS
F
Treatments
*
*
240
*
Error
*
*
*
Total
2512
*
Source of Variation
SS
df
MS
F
Treatments
3
Error
1792
56
32
Total
2512
59
10. In a completely randomized design, 12 experimental units were assigned to the first treatment, 15 units
to the second treatment, and 18 units to the third treatment. A partial ANOVA table is shown below:
Source of Variation
SS
df
MS
F
Treatments
*
*
*
9
Error
*
*
35
Total
*
*
a.
Fill in the blanks (identified by asterisks) in the above ANOVA table.
b.
Test at the 5% significance level to determine if differences exist among the three
treatment means.
a.
Source of Variation
SS
F
Treatments
2
9
Error
1470
42
35
Total
Rejection region: F > F0.05,2,42 3.23
Test statistics: F = 9.0
Conclusion: Reject the null hypothesis. Yes, differences in means exist in at least two of
the three treatment means, according to this data.
Gold Funds
An investor studied the percentage rates of return of three different gold funds. Random samples of
percentage rates of return for four periods were taken from each fund. The results appear in the table
below:
Gold Funds Percentage Rates
Fund 1
Fund 2
Fund 3
12
4
9
15
8
3
13
6
5
14
5
7
17
4
4
11. {Gold Funds Narrative} Set up the ANOVA Table. Use
= 0.05 to determine the critical value.
12. {Gold Funds Narrative} Test at the 5% significance level to determine whether the mean percentage
rates for the three funds differ.
13. The Bonferroni adjustment to Fisher’s Least Significant Difference (LSD) multiple comparison method
is made by dividing the specified experimentwise Type I error rate by the number of pairs of
population means.
14. The Bonferroni adjustment decreases the experimentwise Type I error rate, but it increases the
probability of a Type II error.
15. Multiple comparison methods are used to determine whether or not any differences occur amongst a
group of population means.
16. Fisher’s least significant difference method (LSD) substitutes the pooled variance estimator from the
equal variances t–test with the MSE from ANOVA.
17. Tukey’s multiple comparison method is more powerful than Fisher’s LSD Method at finding
differences in pairwise population means.
18. Tukey’s multiple comparison method is based on the Studentized range statistic.
19. In Fisher’s least significant difference (LSD) multiple comparison method, the LSD value will be the
same for all pairs of means if:
a.
all sample sizes are the same.
b.
all sample means are the same.
c.
all population means are the same.
d.
None of these choices.
20. Fisher’s least significant difference (LSD) multiple comparison method is flawed because
a.
it will increase
; the probability of committing a Type II error
b.
it will increase
; the probability of committing a Type I error
c.
it will increase both
and
, the probabilities of committing Type I and Type II errors,
respectively.
d.
None of these choices.
21. Which of the following statements about multiple comparison methods is false?
a.
They are to be use once the F-test in ANOVA has been rejected.
b.
They are used to determine which particular population means differ.
c.
There are many different multiple comparison methods but all yield the same conclusions.
d.
All of these choices are true.
22. Which of the following is true of Tukey’s Multiple Comparison Method?
a.
It is based on the studentized range statistic to obtain the critical value needed to construct
individual confidence intervals.
b.
It theoretically requires that all sample sizes be equal, or at least similar.
c.
It is more powerful than the LSD method.
d.
All of these choices are true.
23. When is the Tukey multiple comparison method used?
a.
To test for normality.
b.
To test for differences in pairwise means.
c.
To test for equality of a group of population means.
d.
To test equal variances.
24. The techniques used to detect which population means differ are called multiple
____________________ methods.
25. Multiple comparison methods are used after it is found that H0 from ANOVA has been
____________________.
26. The ____________________ adjustment used with the LSD method decreases the experimentwise
Type I error rate.
27. Tukey’s multiple comparison method is ____________________ (more/less) powerful than Fisher’s
LSD method.
28. ____________________ multiple comparison method is based on the Studentized range statistic.
29. If you plan to compare all possible combinations of pairs of population means, the multiple
comparison method to use is ____________________ method.
Health Inspectors’ Ages
In order to examine the differences in ages of health inspectors among five counties, a Health
Department statistician took random samples of six inspectors’ ages in each county. The data are listed
below. An F-test using ANOVA showed that average age differs for at least two counties.
Ages of Inspectors among Five School Districts
1
2
3
4
5
41
39
36
45
53
53
48
28
37
55
28
41
29
46
49
45
51
33
48
56
40
49
27
51
48
59
50
26
49
61
30. {Health Inspectors’ Ages Narrative} Use Tukey’s multiple comparison method to determine which
means differ.
ANS:
31. {Health Inspectors’ Ages Narrative} Use Fisher’s LSD procedure with
= .05 to determine which
population means differ.
ANS:
32. {Health Inspectors’ Ages Narrative} Did Tukey’s method and Fisher’s LSD method in the previous two
questions yield the same results? Will this always be the case?
ANS:
LSAT Scores
A recent college graduate is in the process of deciding which one of three Law schools he should apply
to. He decides to judge the quality of the schools on the basis of the Law School Admission Test
(LSAT) scores of those who are accepted into the school. A random sample of six students in each
school produced the following LSAT scores. An F-test using ANOVA concluded that average LSAT
scores differ for at least two of the schools.
LSAT Scores
School 1
School 2
School 3
650
510
590
620
550
510
630
700
520
580
630
500
710
600
490