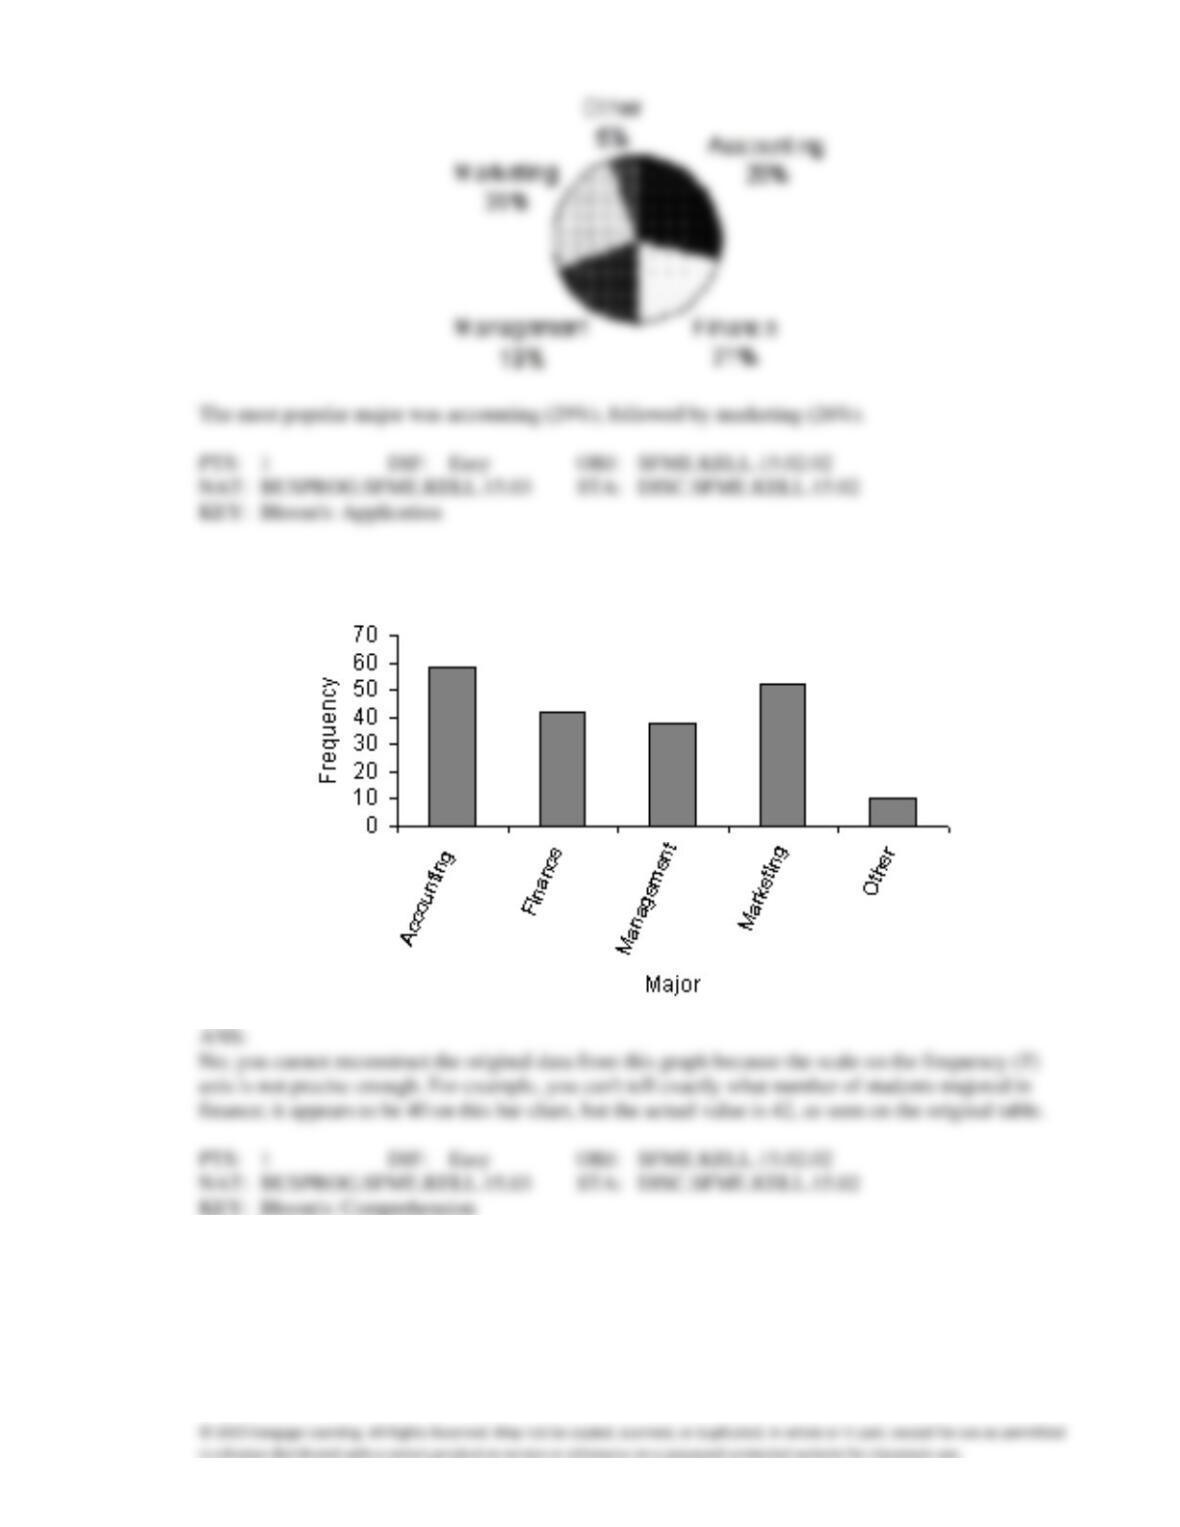
36. {Business School Graduates Narrative} If you were only given the frequency bar chart below, would
you able to reconstruct the original observations in the data set?
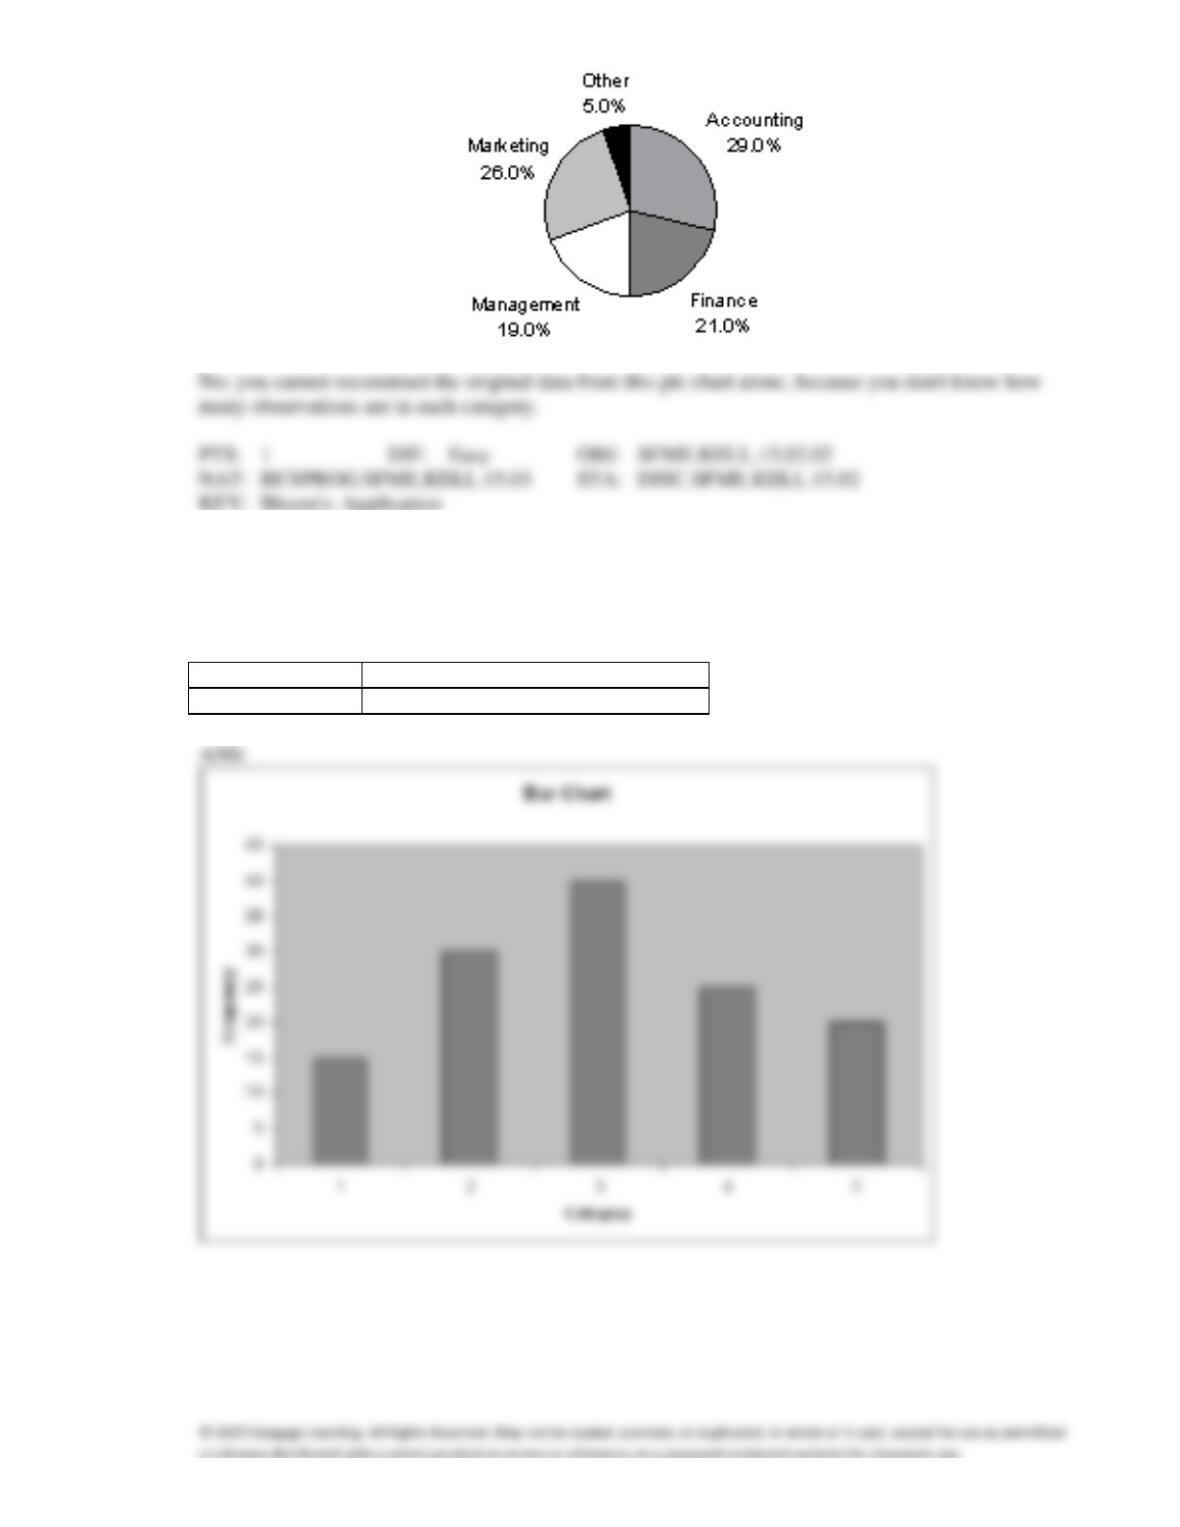
37. {Business School Graduates Narrative} Draw a pie chart of this data. Are you able to reconstruct the
original data from this pie chart alone?
ANS:
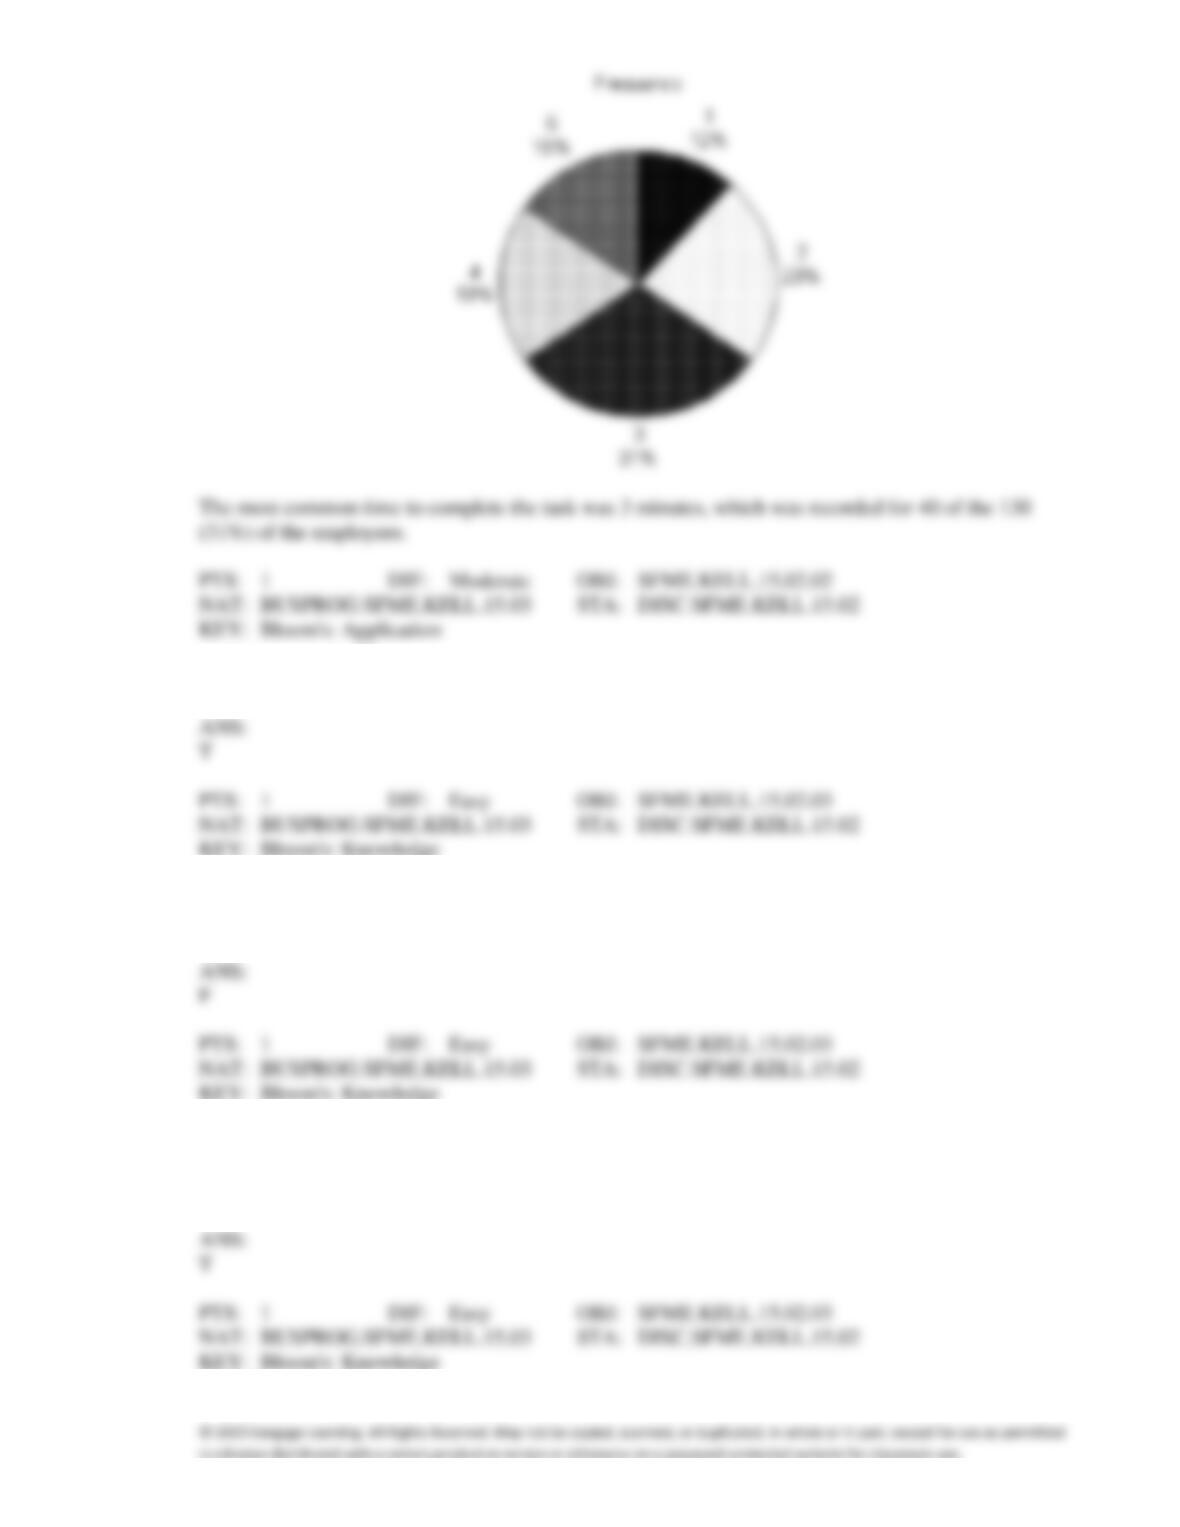
38. Suppose you measure the number of minutes it takes an employee to complete a task, where the
maximum allowed time is 5 minutes, and each time is rounded to the nearest minute. Data from 130
employees is summarized below. Construct a frequency bar chart and a pie chart from this data. How
long did it take most employees to complete the task?
Time (minutes)
1
2
3
4
5
Frequency
15
30
40
25
20
39. A cross-classification table summarizes data from two nominal variables.
40. To describe the relationship between two nominal variables you make a scatter diagram and look for a
correlation.
41. If two nominal variables are unrelated, then the patterns exhibited in their corresponding bar charts
should be approximately the same. If some relationship exists, then some bar charts will differ from
others.
42. A cross-classification table is the same thing as two frequency distribution tables, one for each
variable.
43. If the relative frequencies in the rows of a cross-classification table are similar, then the two variables
shown in the table are not related.
44. If two nominal variables are unrelated, then the patterns exhibited in their corresponding pie charts
should be approximately the same. If some relationship exists, then some pie charts will differ from
others.
45. The percentage of observations in each combination of the cross-classification table must be equal in
order to show two nominal variables are not related.
46. In the following cross-classification table, gender and car ownership are related.
Own a car
Don’t own a car
Females
60
30
Males
80
40
47. In the following cross-classification table, gender and fantasy baseball participation are related.
Participate in Fantasy
Don’t participate in
Football
Fantasy Football
Males
75
25
Females
45
55
48. A college professor classifies his students according to their grade point average (GPA) and their
gender. The resulting cross-classification table is shown below.
GPA
Gender
Under 2.0
2.0 − 3.0
Over 3.0
Male
10
30
15
Female
15
25
35
If you made a pie chart for male GPAs and a pie chart for female GPAs, those pie charts would look
the same.
49. When studying the responses to two nominal questions, we should develop a
a.
cross-classification table.
b.
frequency distribution table.
c.
cumulative percentage distribution table.
d.
scatter diagram.
50. Which of the following techniques can be used to explore relationships between two nominal
variables?
a.
Comparing the relative frequencies within a cross-classification table.
b.
Comparing pie charts, one for each column (or row).
c.
Comparing bar charts, one for each column (or row).
d.
All of these choices are true.
51. A statistics professor classifies his students according to their grade point average (GPA) and their
gender. The resulting cross-classification table is shown below.
GPA
Gender
Under 2.5
2.5 − 3.5
Over 3.5
Male
5
25
10
Female
10
20
30
Which of the following describes the relationship between GPA and gender shown by this table?
a.
A higher percentage of females have GPAs over 3.5, compared to males.
b.
A lower percentage of females have GPAs over 3.5, compared to males.
c.
Females and males each have the same percentage of GPAs over 3.5.
d.
You cannot compare male and female GPAs because the total number in each group is not
the same.
52. In the following cross-classification table, how are gender and house ownership related?
Own a house
Don’t own a house
Females
60
30
Males
80
40
a.
The percentage of house owners is higher for males than for females.
b.
The percentage of house owners is higher for females than for males.
c.
The percentage of house owners is the same for females and males.
d.
You cannot compare percentages for males and females since the total frequencies are not
equal.
53. Two hundred males and two hundred females were asked whether or not college baseball should have
a playoff system (yes/no/undecided). Pie charts of the responses for males vs. females are shown
below. Which of the following describes the relationship between gender and opinion?
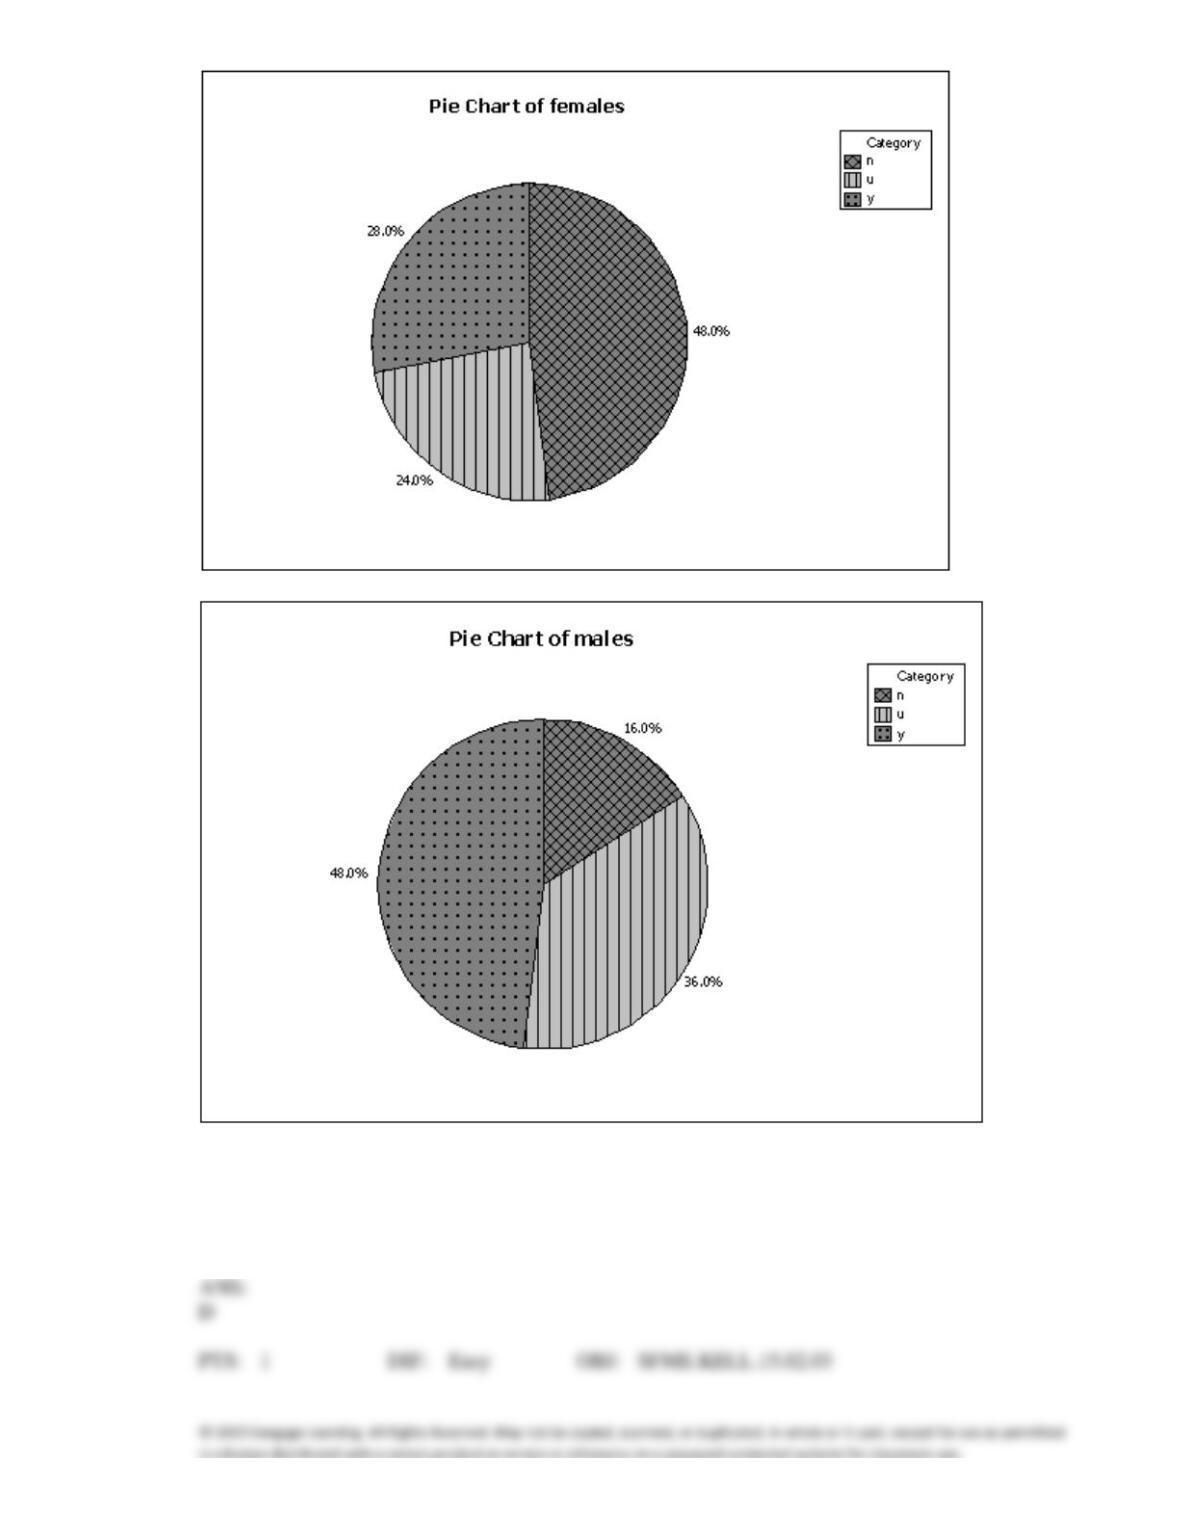
a.
A higher percentage of males want a playoff system compared to females.
b.
More males than females are undecided on this issue.
c.
Gender and opinion on a playoff system are related.
d.
All of these choices are true.
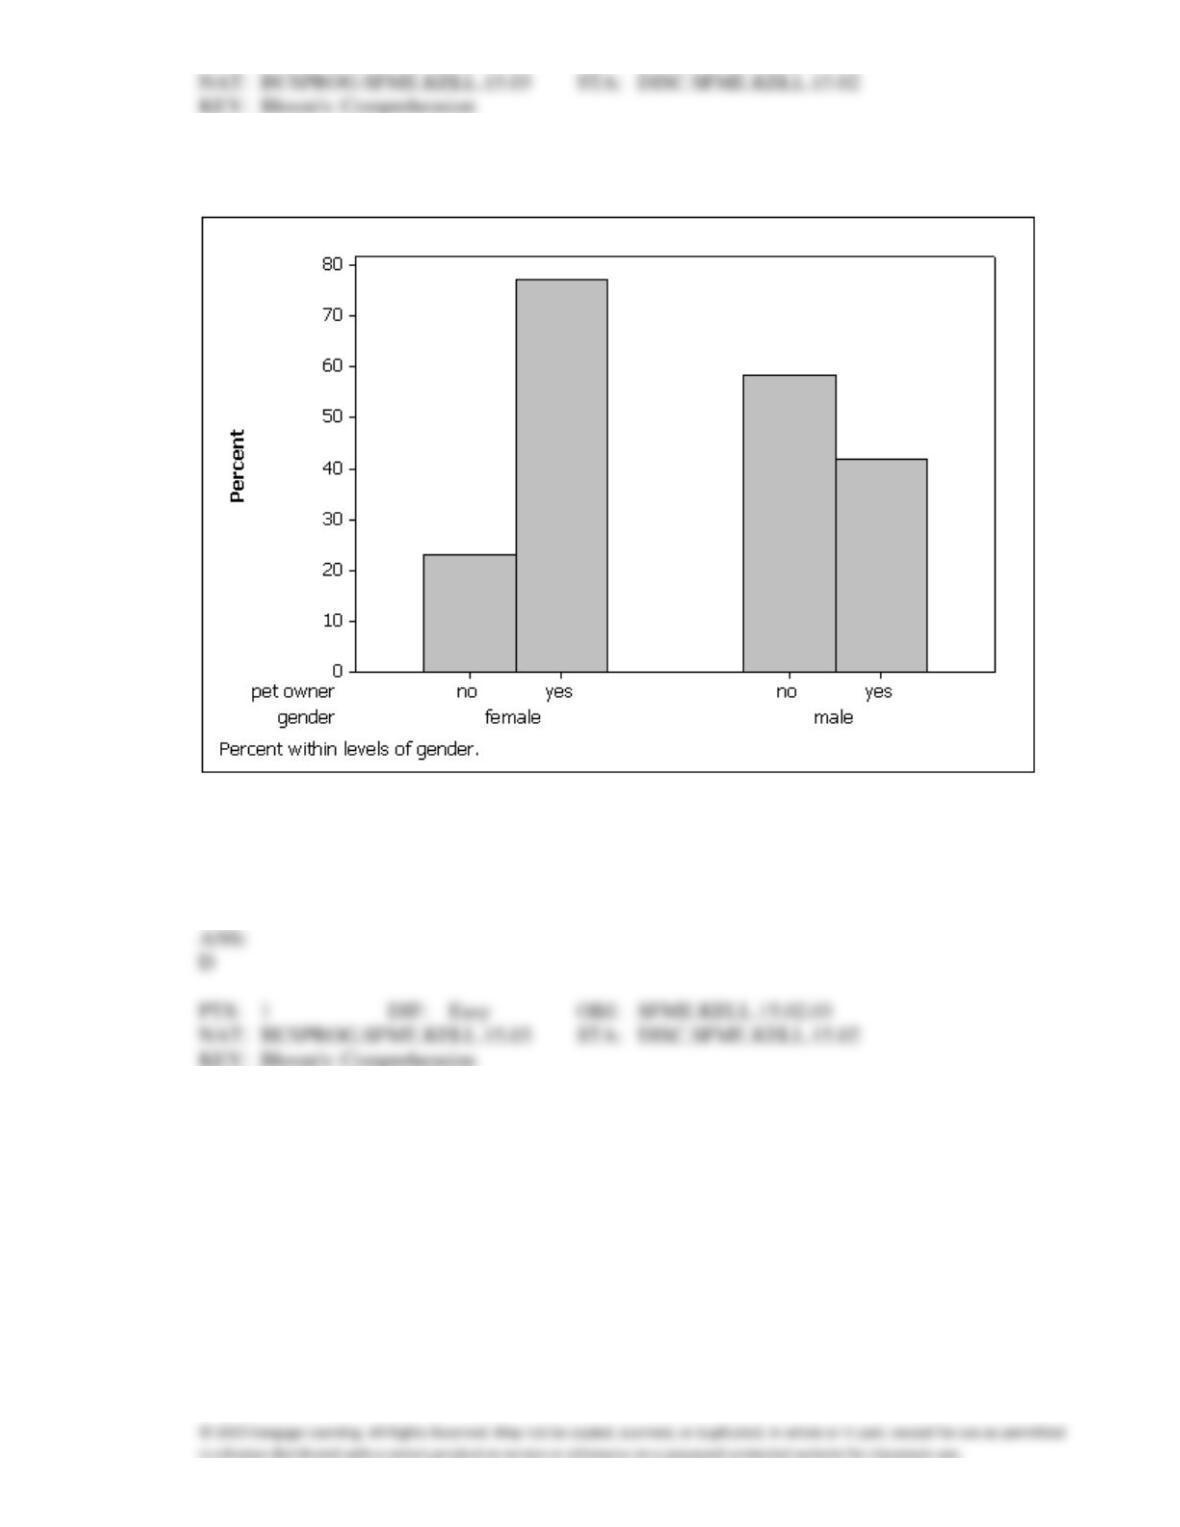
54. A survey of 100 adults was conducted to see if gender is related to pet ownership. The results are
summarized in the bar chart below. Which of the following statements describes the relationship?
a.
Pet ownership and gender are not related.
b.
More males own pets than don’t own pets.
c.
Fewer females own pets than don’t own pets.
d.
None of these choices.
55. The bar charts below summarize data collected on 100 adults regarding gender and pet ownership.
Which of the following statements is (are) true based on this chart?
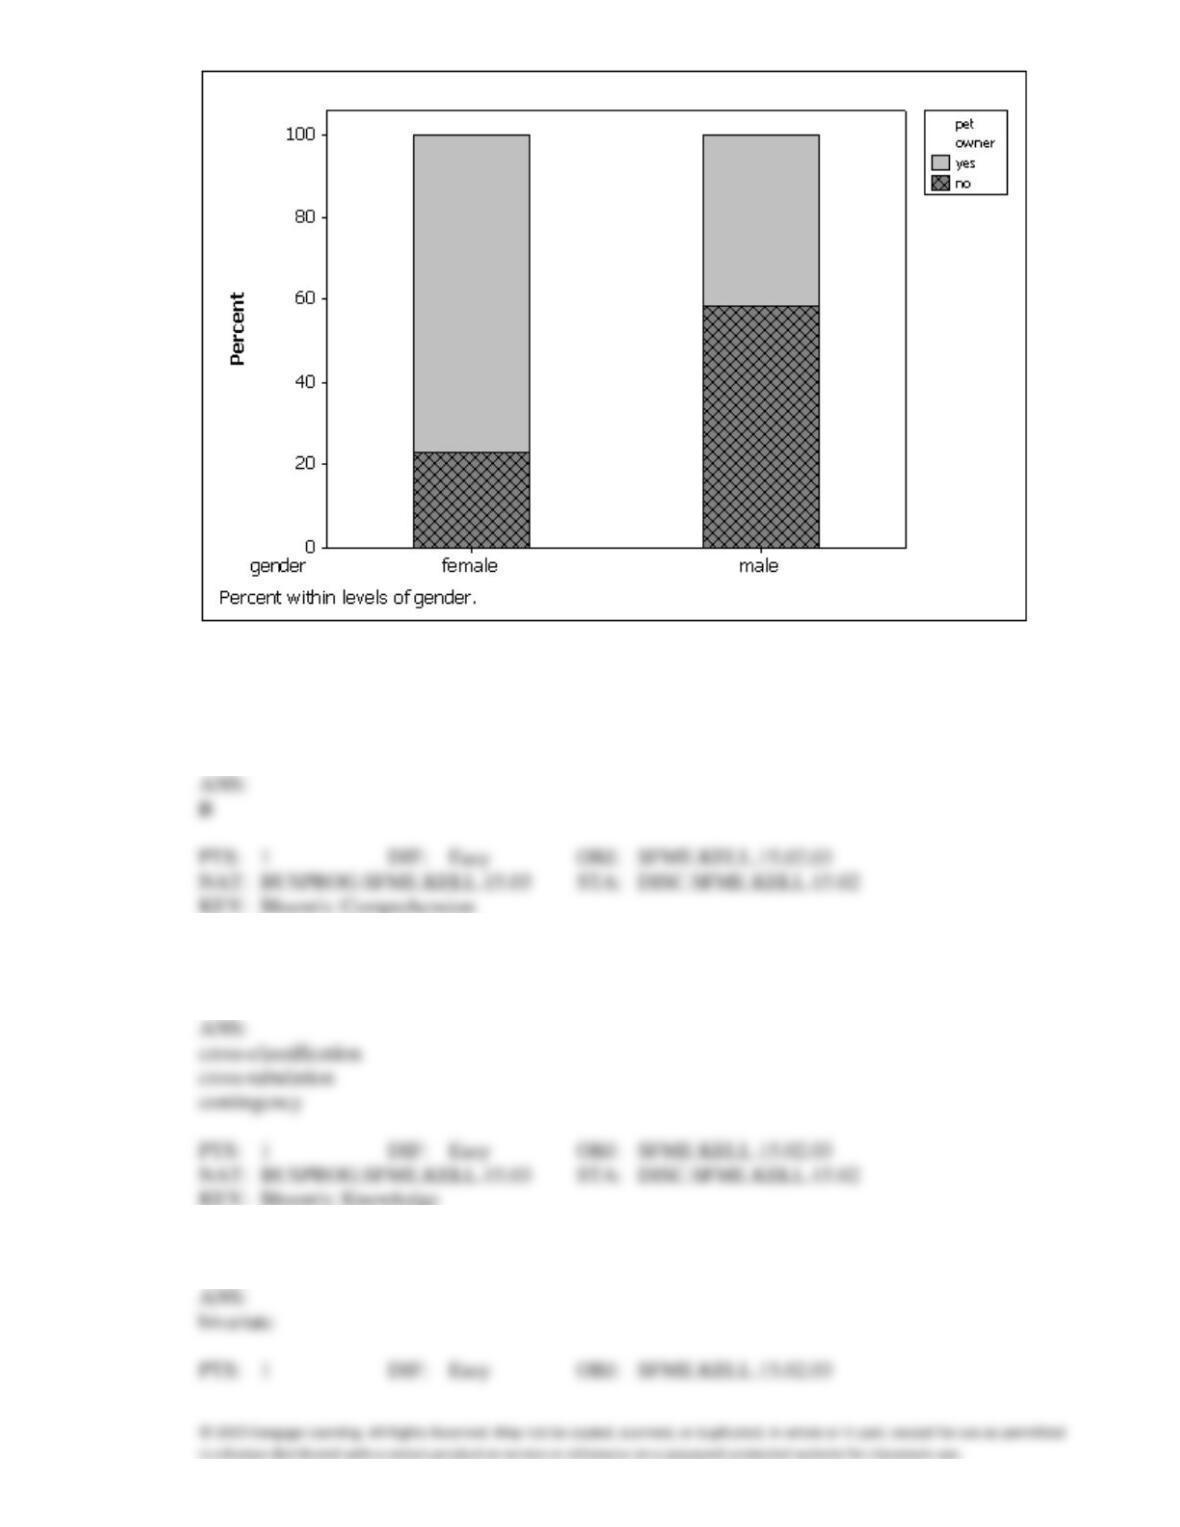
a.
Gender and pet ownership are related; a higher percentage of males own pets than females.
b.
Gender and pet ownership are related; a higher percentage of females own pets than males.
c.
Gender and pet ownership are related; males and females own the same percentage of pets.
d.
Gender and pet ownership are not related.
56. To evaluate two nominal variables at the same time, a(n) ____________________ table should be
created from the data.
57. Data that contains information on two variables is called ____________________ data.
58. A cross-classification table is used to describe the relationship between two ____________________
variables.
59. Data that contains information on a single variable is called ____________________ data.
60. You can graph the relationship between two nominal variables using two ____________________ or
two ____________________.
61. If two pie charts made from the rows of a cross-classification table look the same, then the two
nominal variables ____________________ (are/are not) related.
62. If two bar charts made from the rows of a cross-classification table look the same, then the two
nominal variables ____________________ (are/are not) related.
All-Nighters
A sample of 400 students at a certain university was taken after the midterm; 200 students reported
staying up all night before the midterm and the other 200 students did not. Researchers recorded
whether each student did well or poorly on the midterm. The following table contains the results.
Did Well on Did Poorly on
Midterm Midterm
Stayed up all night 60 140
Did not stay up all night 120 80
63. {All-Nighter Narrative} Of those who stayed up all night before the midterm, what percentage did
well on the midterm?
64. {All-Nighters Narrative} Of those who did well on the midterm, what percentage stayed up all night
before the midterm?
65. {All-Nighters Narrative} Briefly explain (using percentages) whether staying up all night before this
midterm is related to a student doing poorly.
66. {All-Nighters Narrative} There is a relationship between whether or not a student stayed up all night
before the midterm, and how well they did on the midterm. Describe this relationship using
percentages.
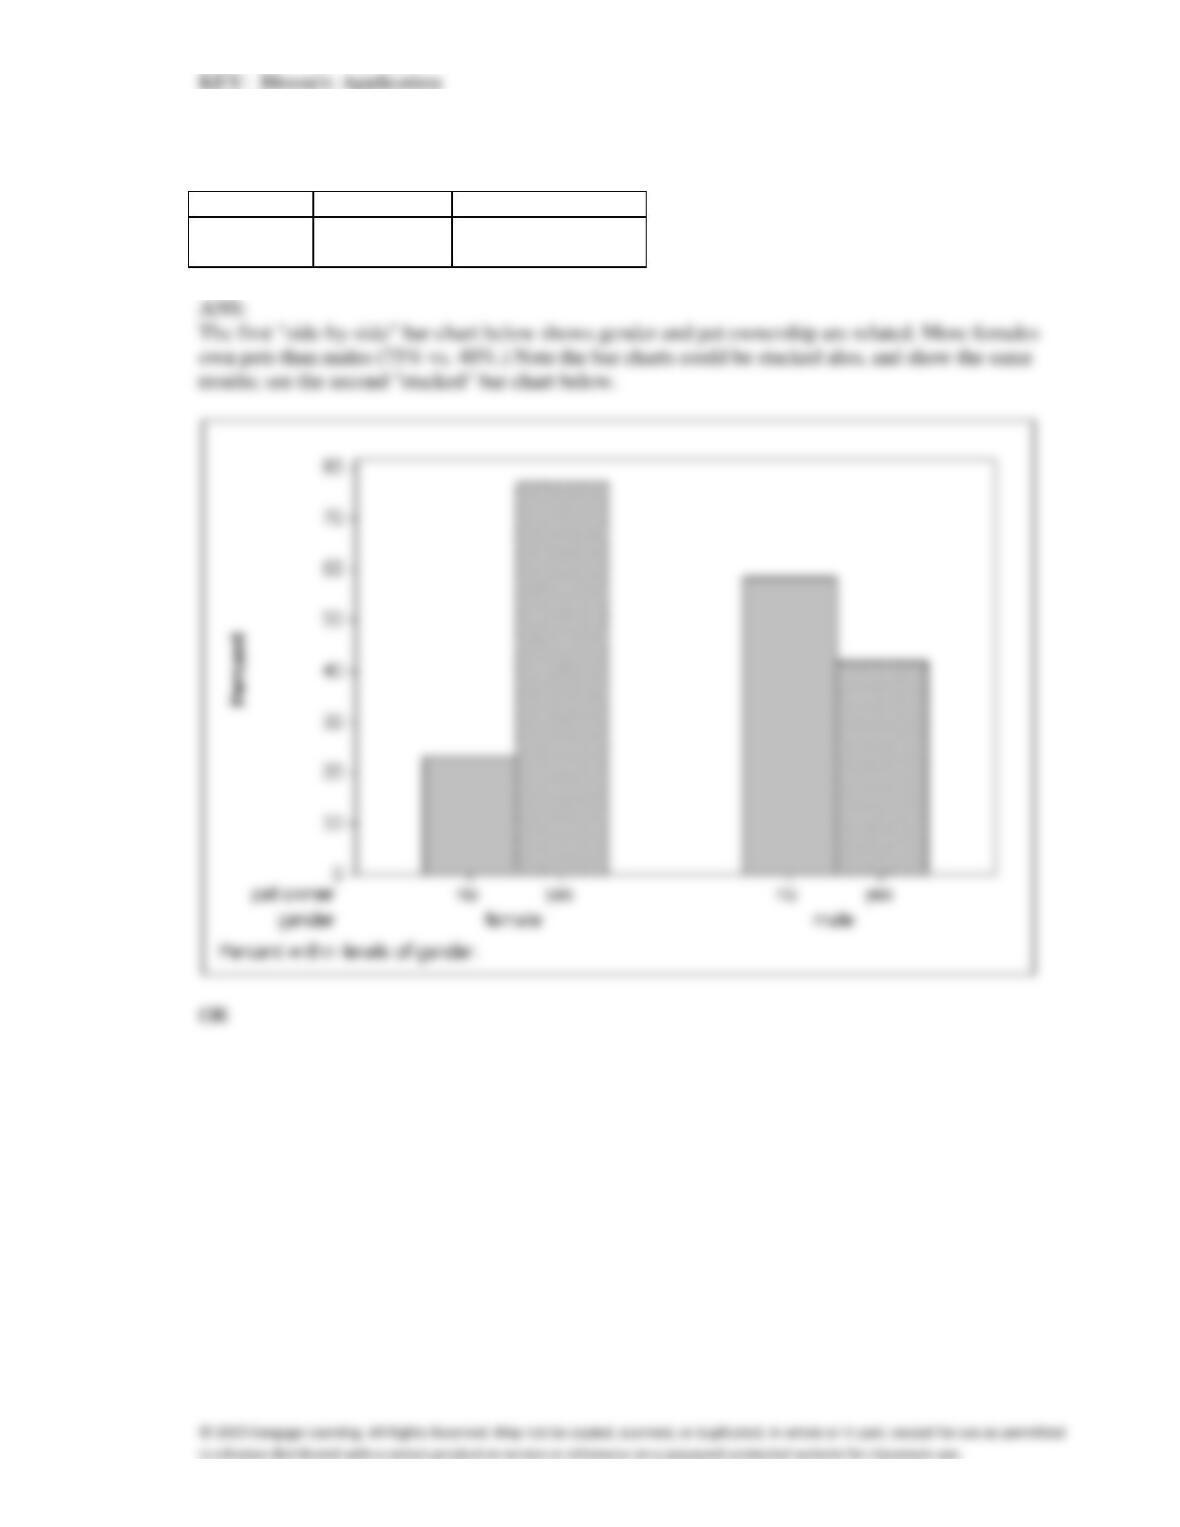
67. Using the following cross-classification table, draw two bar charts that compare pet ownership for
males vs. females. Are gender and pet ownership related?
Own a pet
Don’t own a pet
Females
75
25
Males
40
60
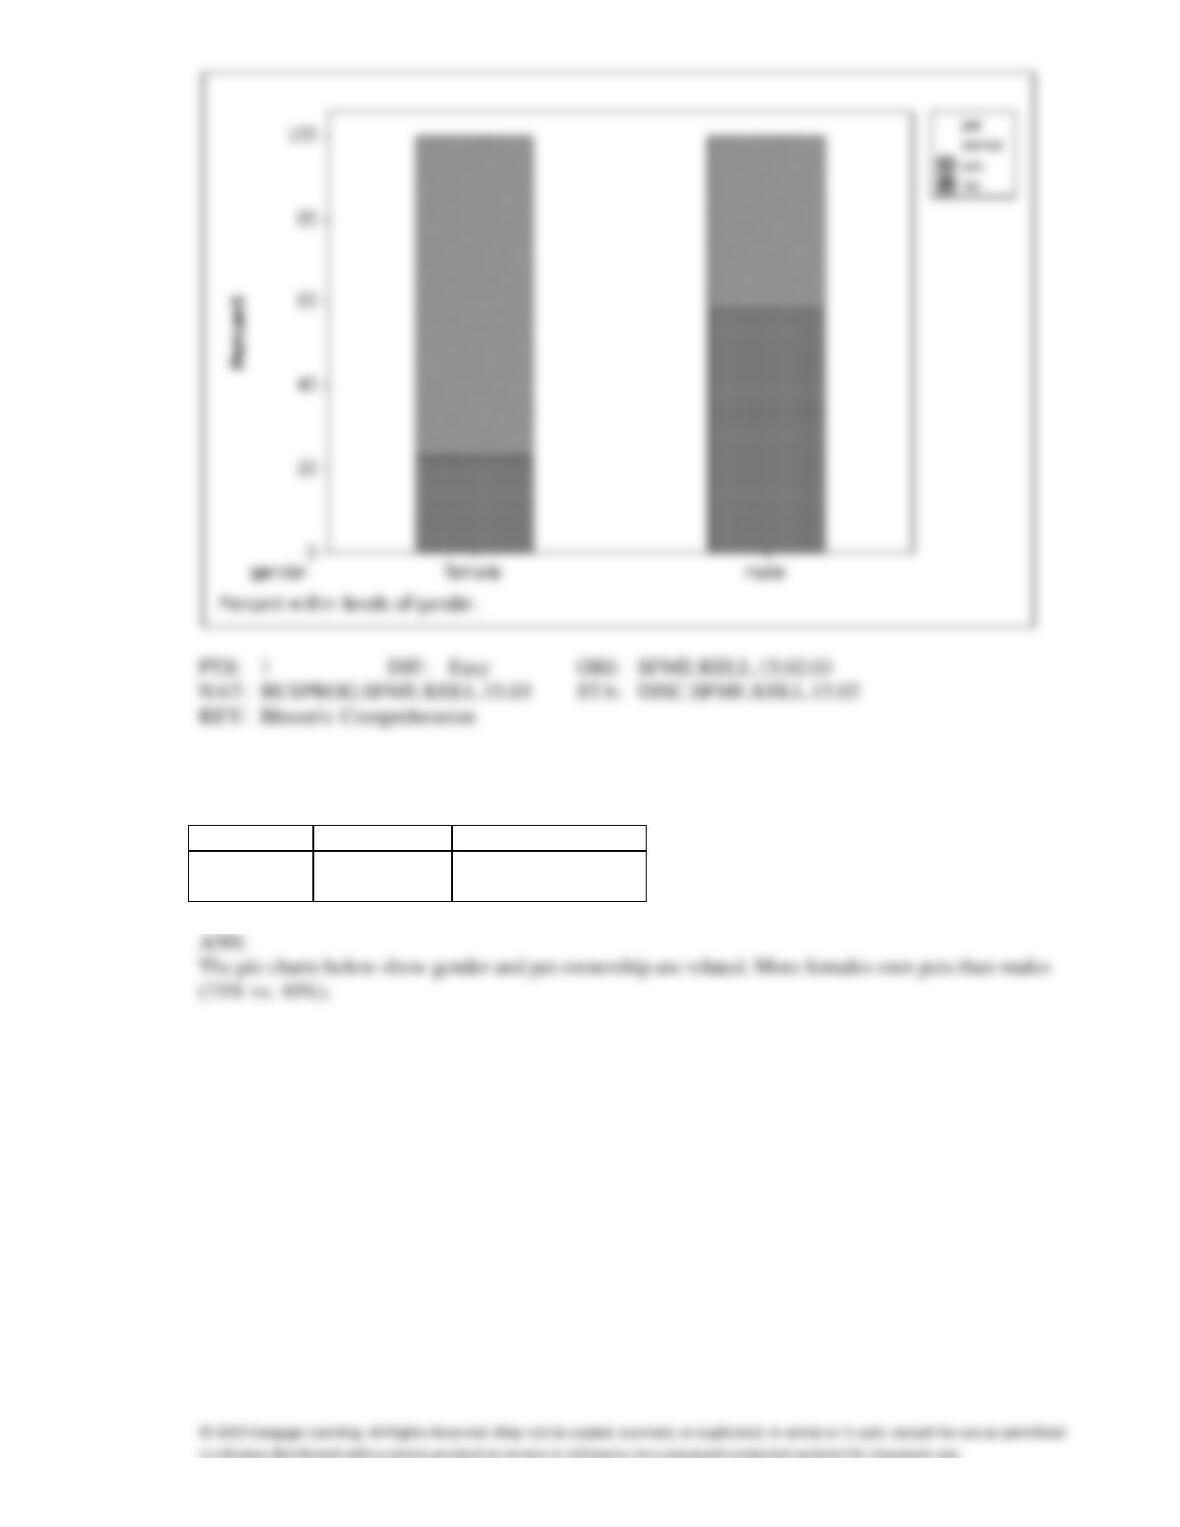
68. Using the following cross-classification table, draw two pie charts that compare pet ownership for
males vs. females. Are gender and pet ownership related?
Own a pet
Don’t own a pet
Females
75
25
Males
40
60