Appendix 15
A15.1 Chi-squared goodness-of-fit test
:H0
50.p1=
,
20.p2=
,
15.p3=
10.p4=
05.p5=
:H1
At least one
i
p
is not equal to its specified value.
−
=
i
2
ii
2
e
)ef(
1
2
C D E
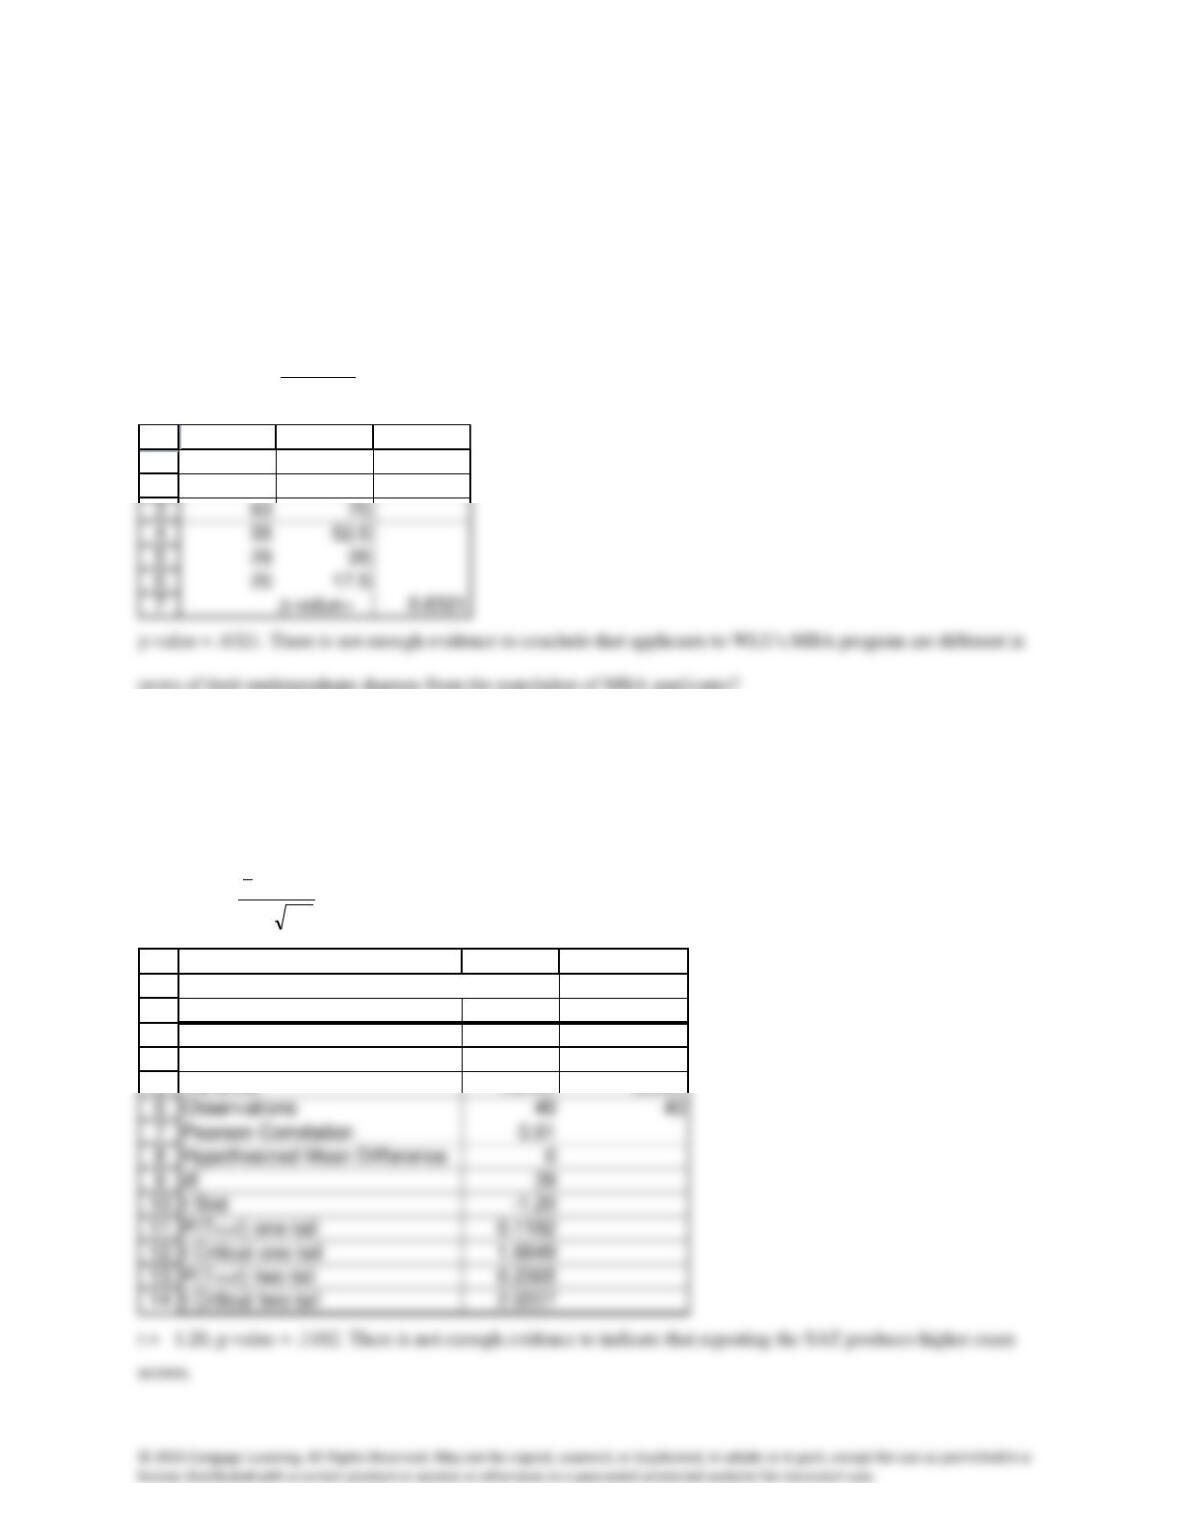
Actual Expected
183 175
terms of their undergraduate degrees from the population of MBA applicants?
A15.2 t-test of
D
D0 :H
= 0
D1 :H
< 0
DD
DD
n/s
x
t−
=
1
2
3
4
5
A B C
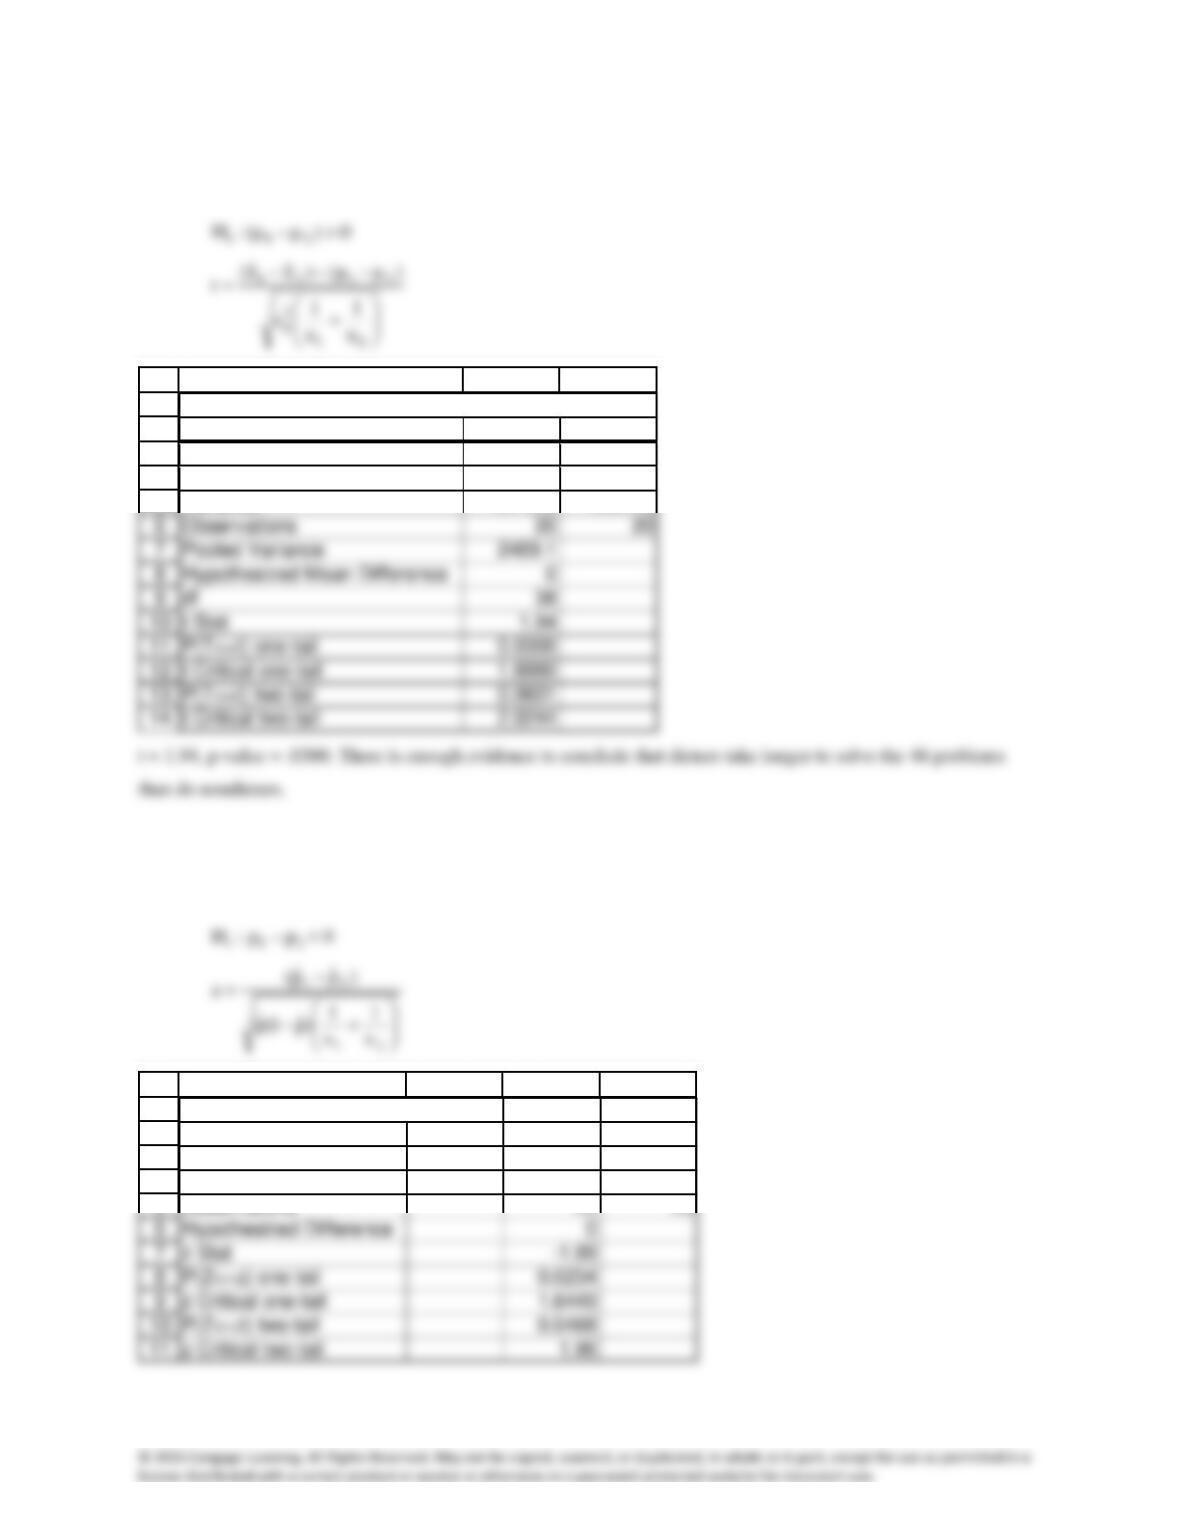
t-Test: Paired Two Sample for Means
First Sat Second SAT
Mean 1175 1190
Variance 28422 35392
A15.3 Time to solve the 48 problems: Equal-variances t-test of
21 −
0)(:H 210 =−
1
2
3
4
5
A B C
t-Test: Two-Sample Assuming Equal Variances
Diet Not
Mean 581.95 551.5
Variance 2716.6 2221.5
Successfully repeat string of five letters: z-test of
21 pp −
(case 1)
:H0
21 pp −
= 0
21 pp −
1
2
3
4
5
A B C D
z-Test: Two Proportions
Diet Not
Sample Proportions 0.50 0.80
Observations 20 20
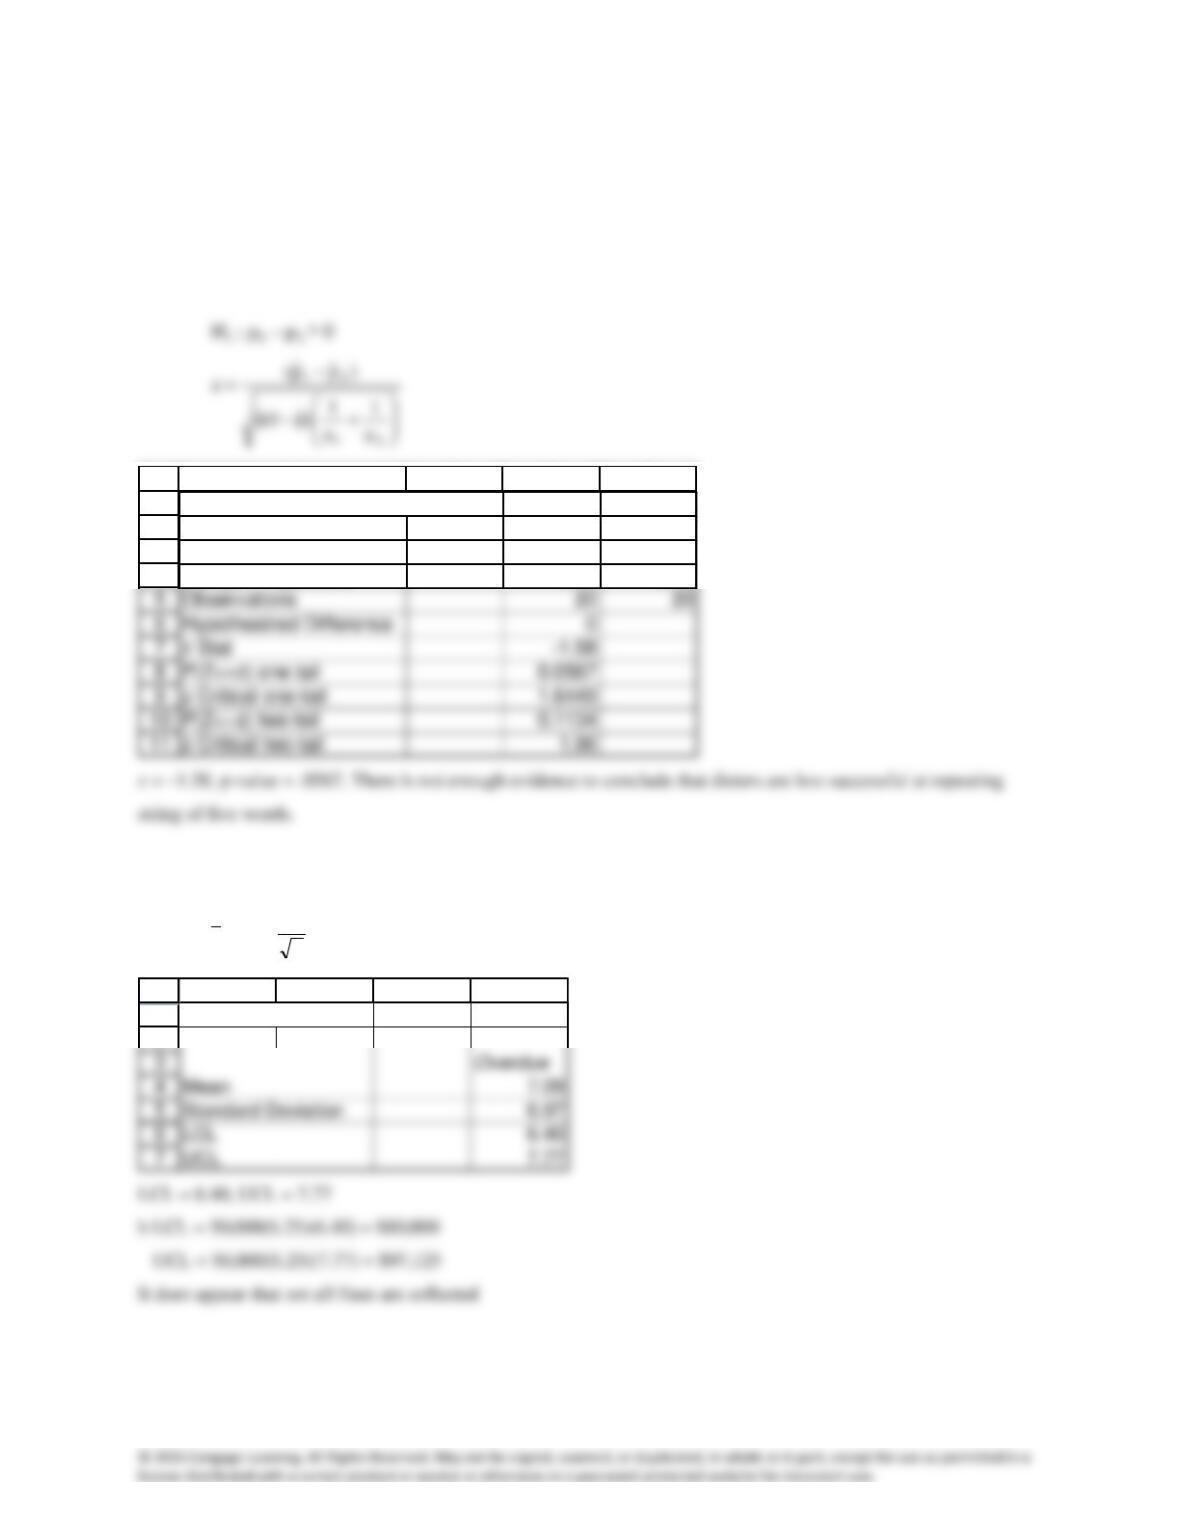
z = –1.99, p-value = .0234. There is enough evidence to conclude that dieters are less successful at repeating string
of five letters.
Successfully repeat string of five words: z-test of
21 pp −
(case 1)
:H0
21 pp −
= 0
21 pp −
1
2
3
4
A B C D
z-Test: Two Proportions
Diet Not
Sample Proportions 0.35 0.60
A15.4 a t-estimator of
n
s
tx 2/
1
2
A B C D
t-Estimate: Mean
A15.5 One-way analysis of variance
:H0
321 ==
:H1
At least two means differ
10
11
A B C D E F G
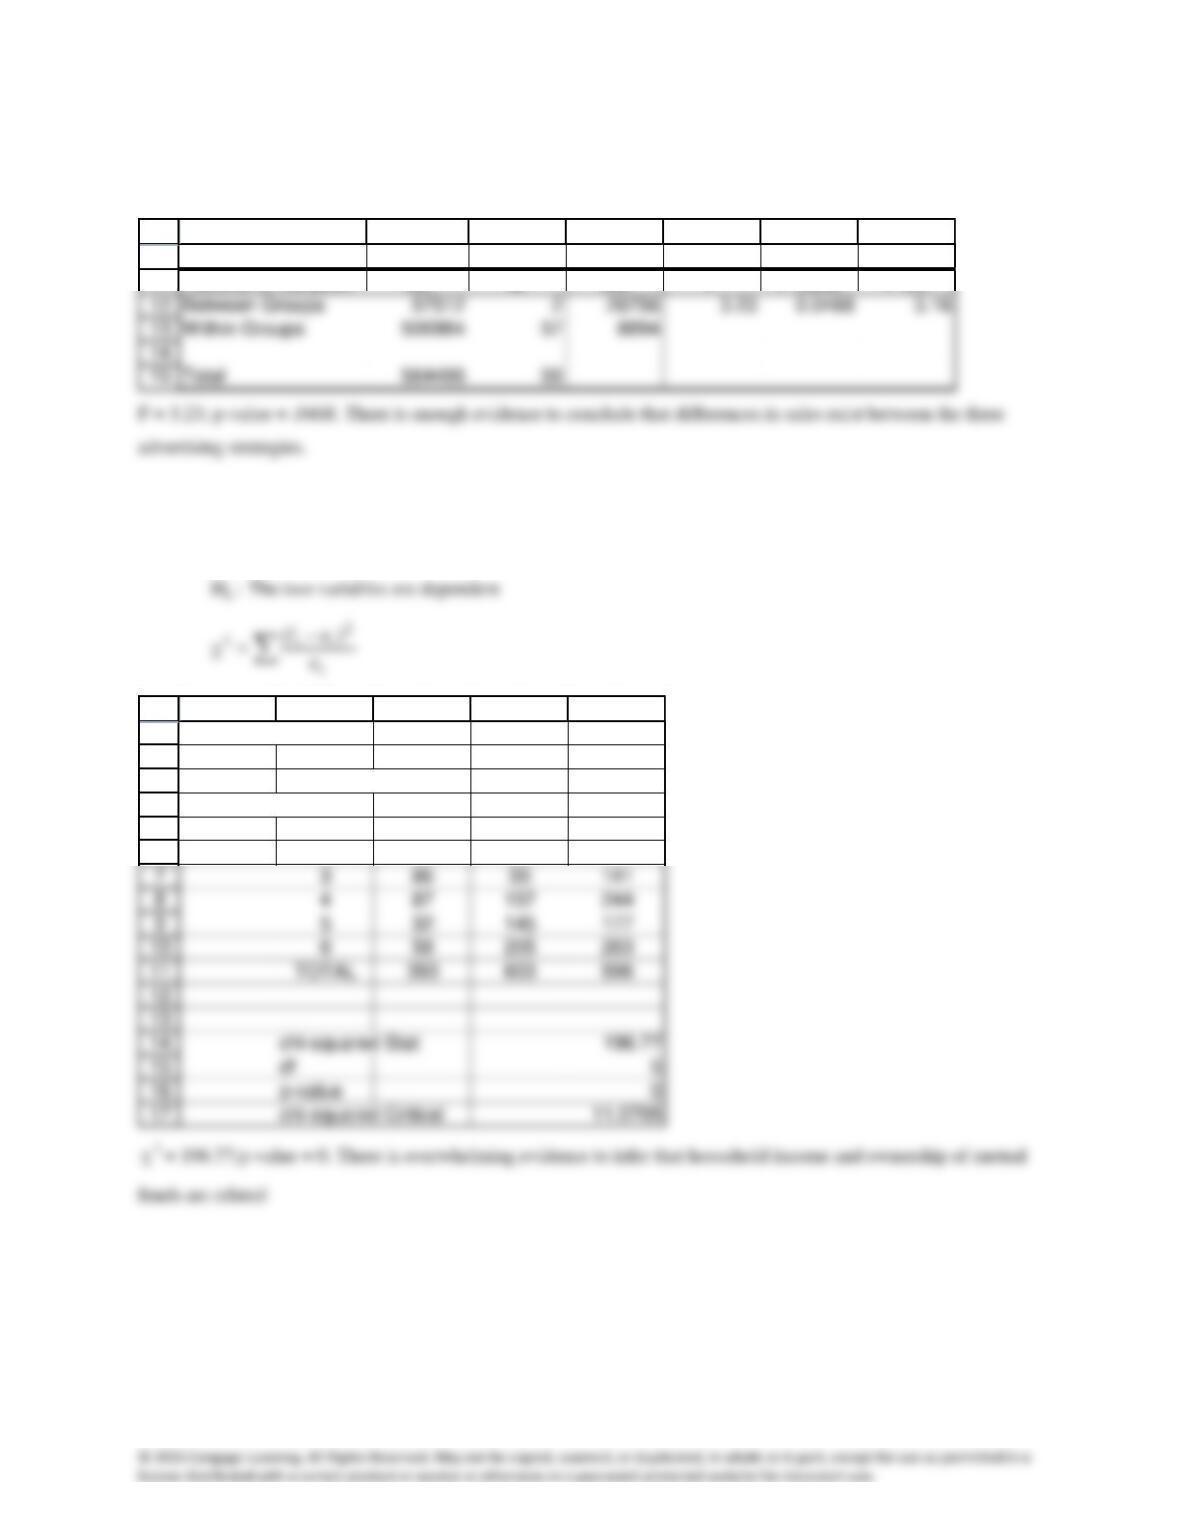
ANOVA
Source of Variation SS df MS F P-value F crit
A15.6 Chi-squared test of a contingency table
:H0
:H1
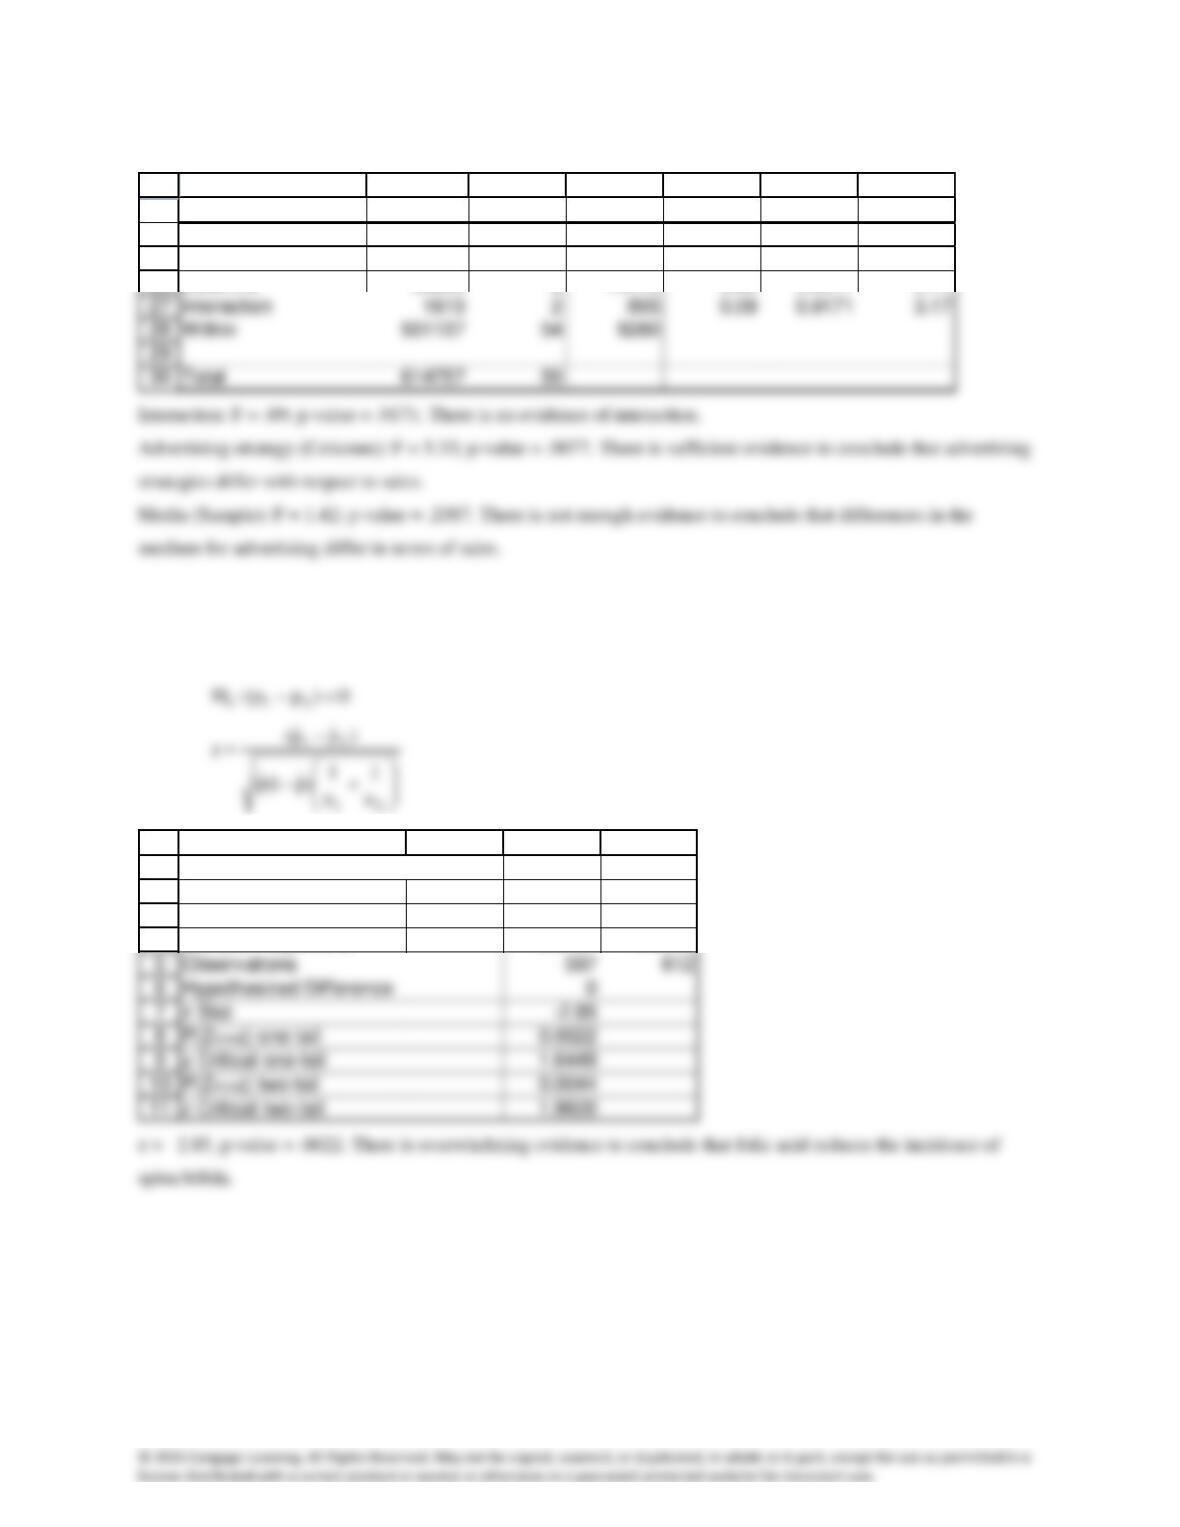
The two variables (income category and mutual fund ownership) are independent
1
2
3
4
5
6
A B C D E
Contingency Table
Income category
Mutual fund 1 2 TOTAL
171 13 84
259 28 87
A15.7 Two-factor analysis of variance
23
24
25
26
A B C D E F G
ANOVA
Source of Variation SS df MS F P-value F crit
Sample 13172 113172 1.42 0.2387 4.02
Columns 98839 249419 5.33 0.0077 3.17
A15.8 z-test of
21 pp −
(case 1) Code 3 results were omitted.
0)pp(:H 210 =−
1
2
3
4
A B C D
z-Test: Two Proportions
Folic acid Placebo
Sample Proportions 0.0101 0.0343
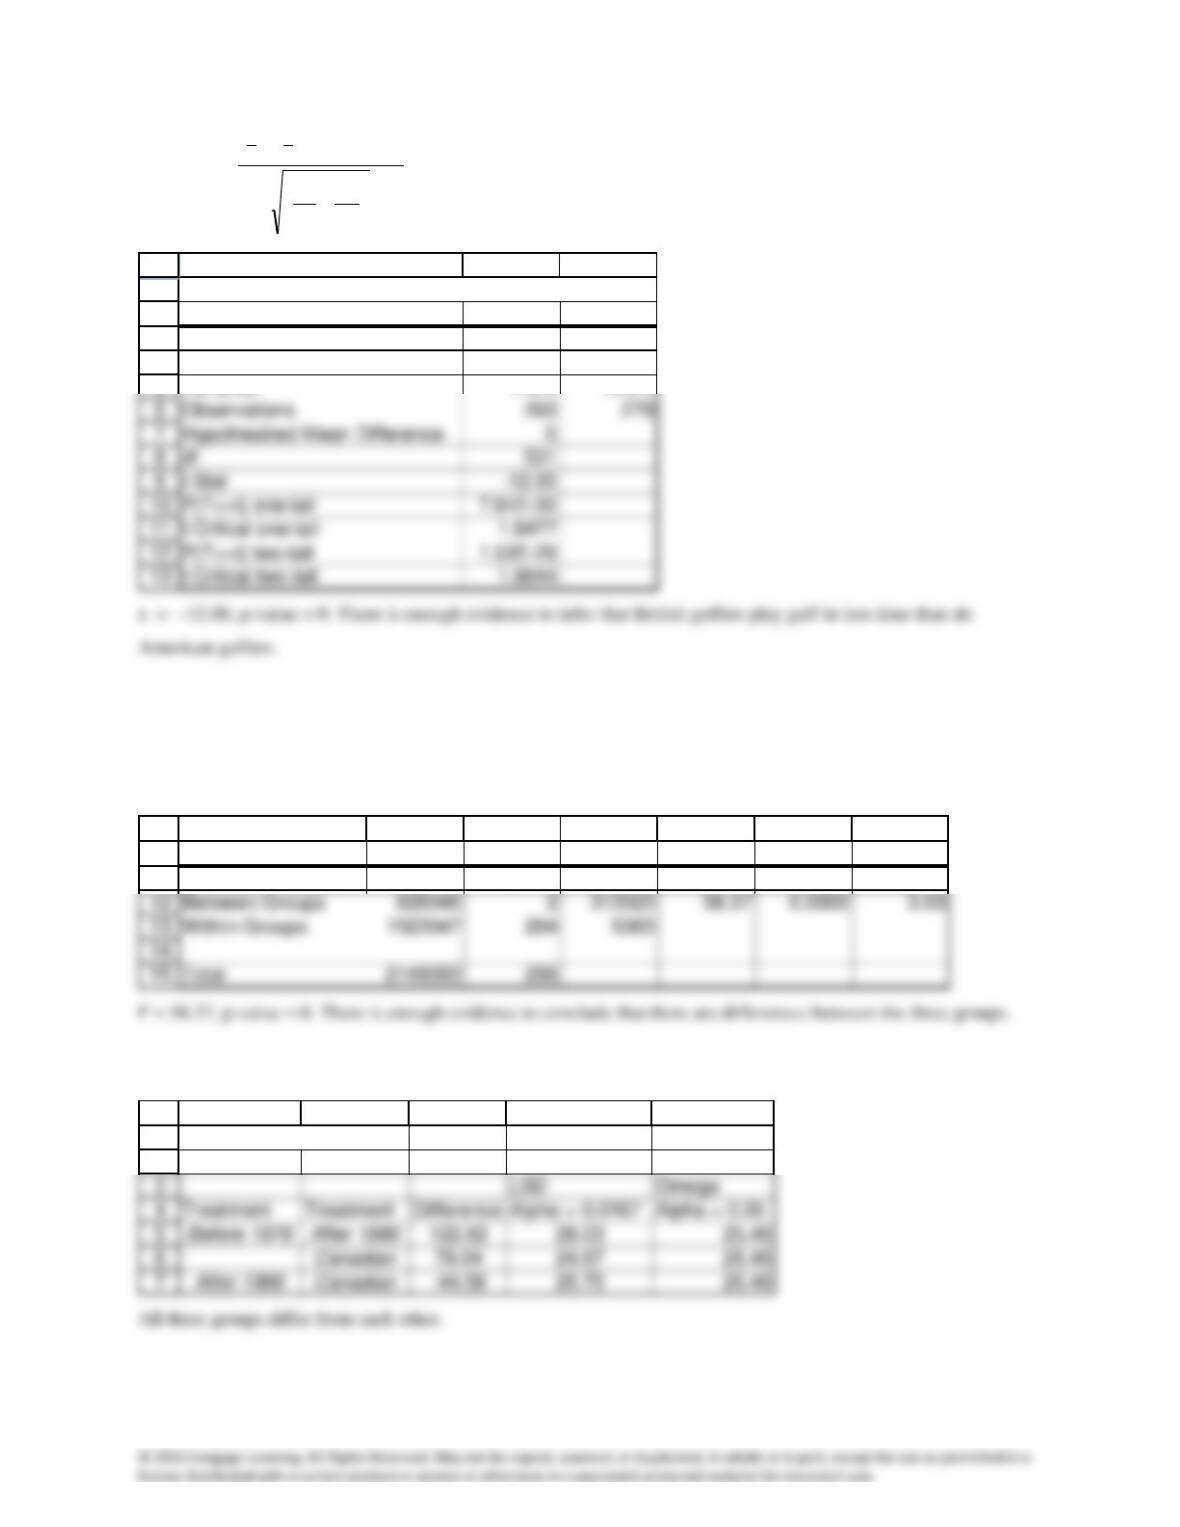
A15.9 Unequal-variances t-test of
21 −
)(:H 210 −
= 0
)(:H 211 −
< 0
+
−−−
=
2
2
2
1
2
1
2121
n
s
n
s
)()xx(
t
=
1
2
3
4
5
A B C
t-Test: Two-Sample Assuming Unequal Variances
British American
Mean 238.0 252.0
Variance 149.9 220.2
A15.10 one-way analysis of variance
:H0
321 ==
:H1
At least two means differ
10
15
11
A B C D E F G
ANOVA
Source of Variation SS df MS F P-value F crit
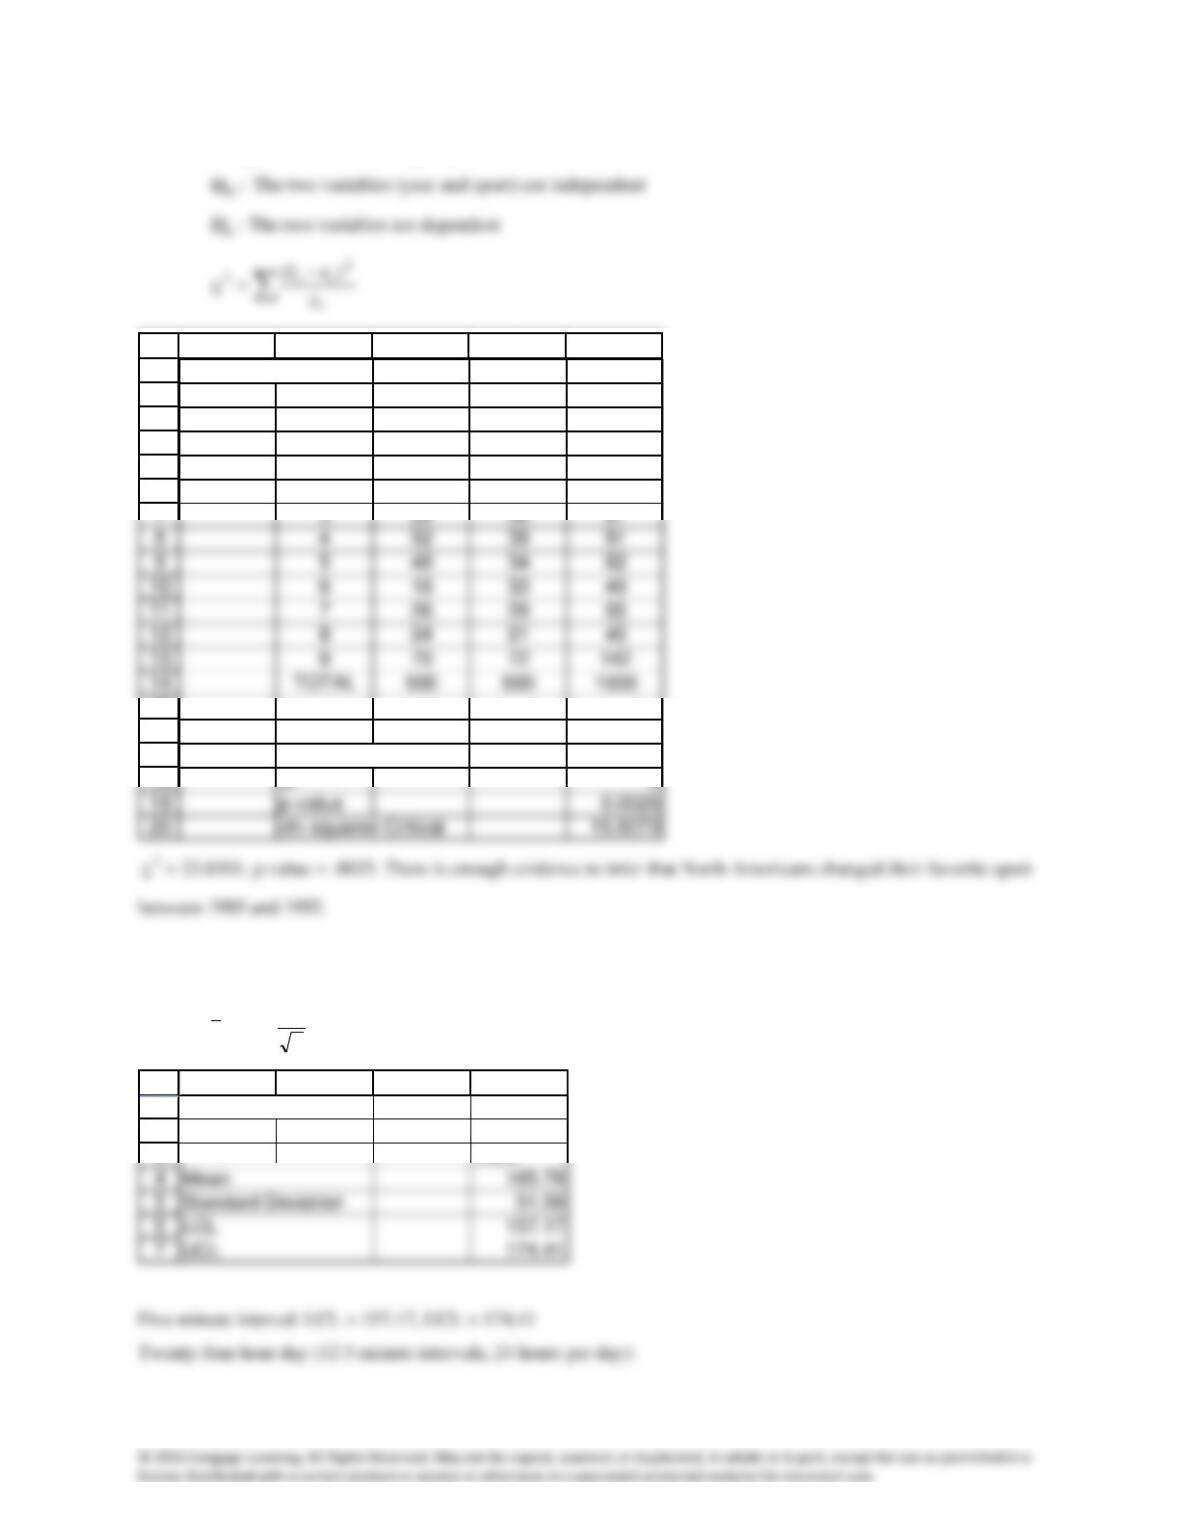
Multiple Comparisons
1
2
A B C D E
Multiple Comparisons
A15.11 Chi-squared test of a contingency table
1
2
3
4
5
6
15
16
17
18
A B C D E
Contingency Table
Sport
Year 1 2 TOTAL
1116 122 238
2119 92 211
chi-squared Stat 23.8101
df 8
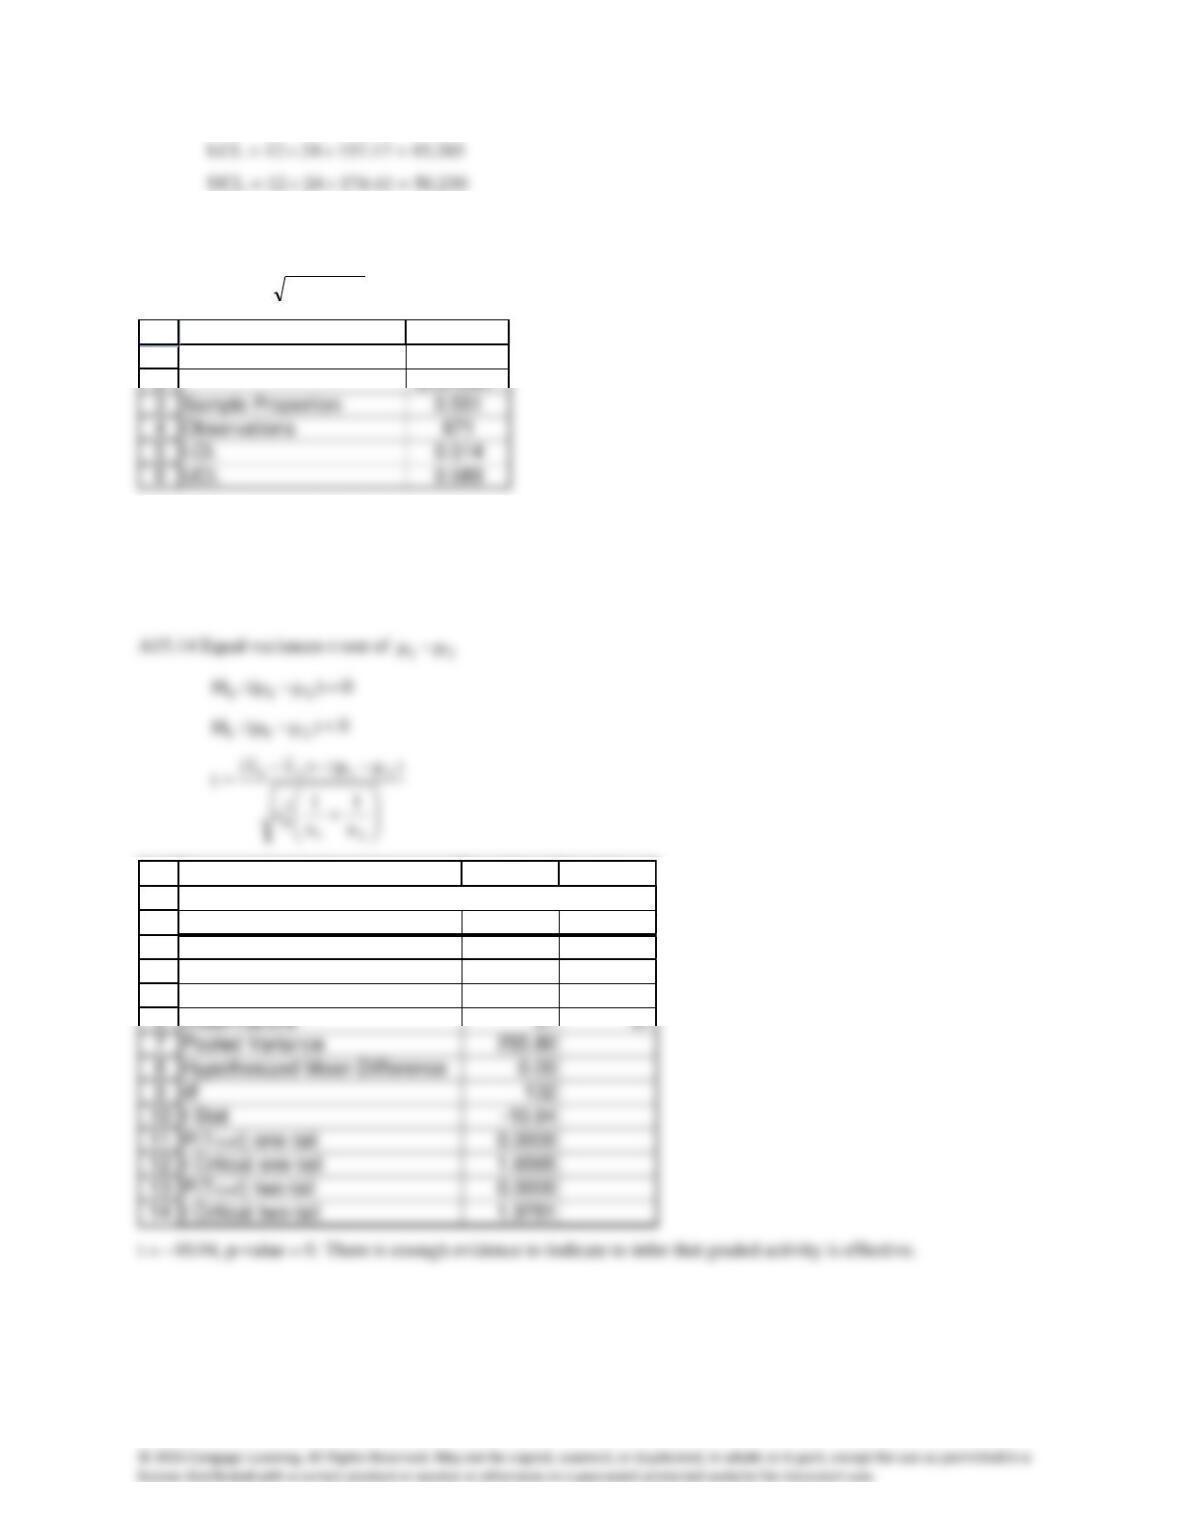
A15.12 t-estimator of
n
s
tx 2/
1
2
3
A B C D
t-Estimate: Mean
Cars
A15.13 z-estimator of p
n/)p
ˆ
1(p
ˆ
zp
ˆ2/ −
1
2
A B
z-Estimate: Proportion
Exercise?
Total number of adults who exercise:
LCL = 205.9 million (.514) = 105.8 million
UCL = 205.9 million (.589) = 121.3 million
1
2
3
4
5
A B C
t-Test: Two-Sample Assuming Equal Variances
Activity Usual
Mean 57.06 87.28
Variance 296.18 215.42
A15.15 Chi-squared test of a contingency table
:H0
The two variables (group and improvement) are independent
:H1
The two variables are dependent
−
=
i
2
ii
2
e
)ef(
1
2
3
A B C D E
Contingency Table
Group
A15.16 z-estimator of p
n/)p
ˆ
1(p
ˆ
zp
ˆ2/ −
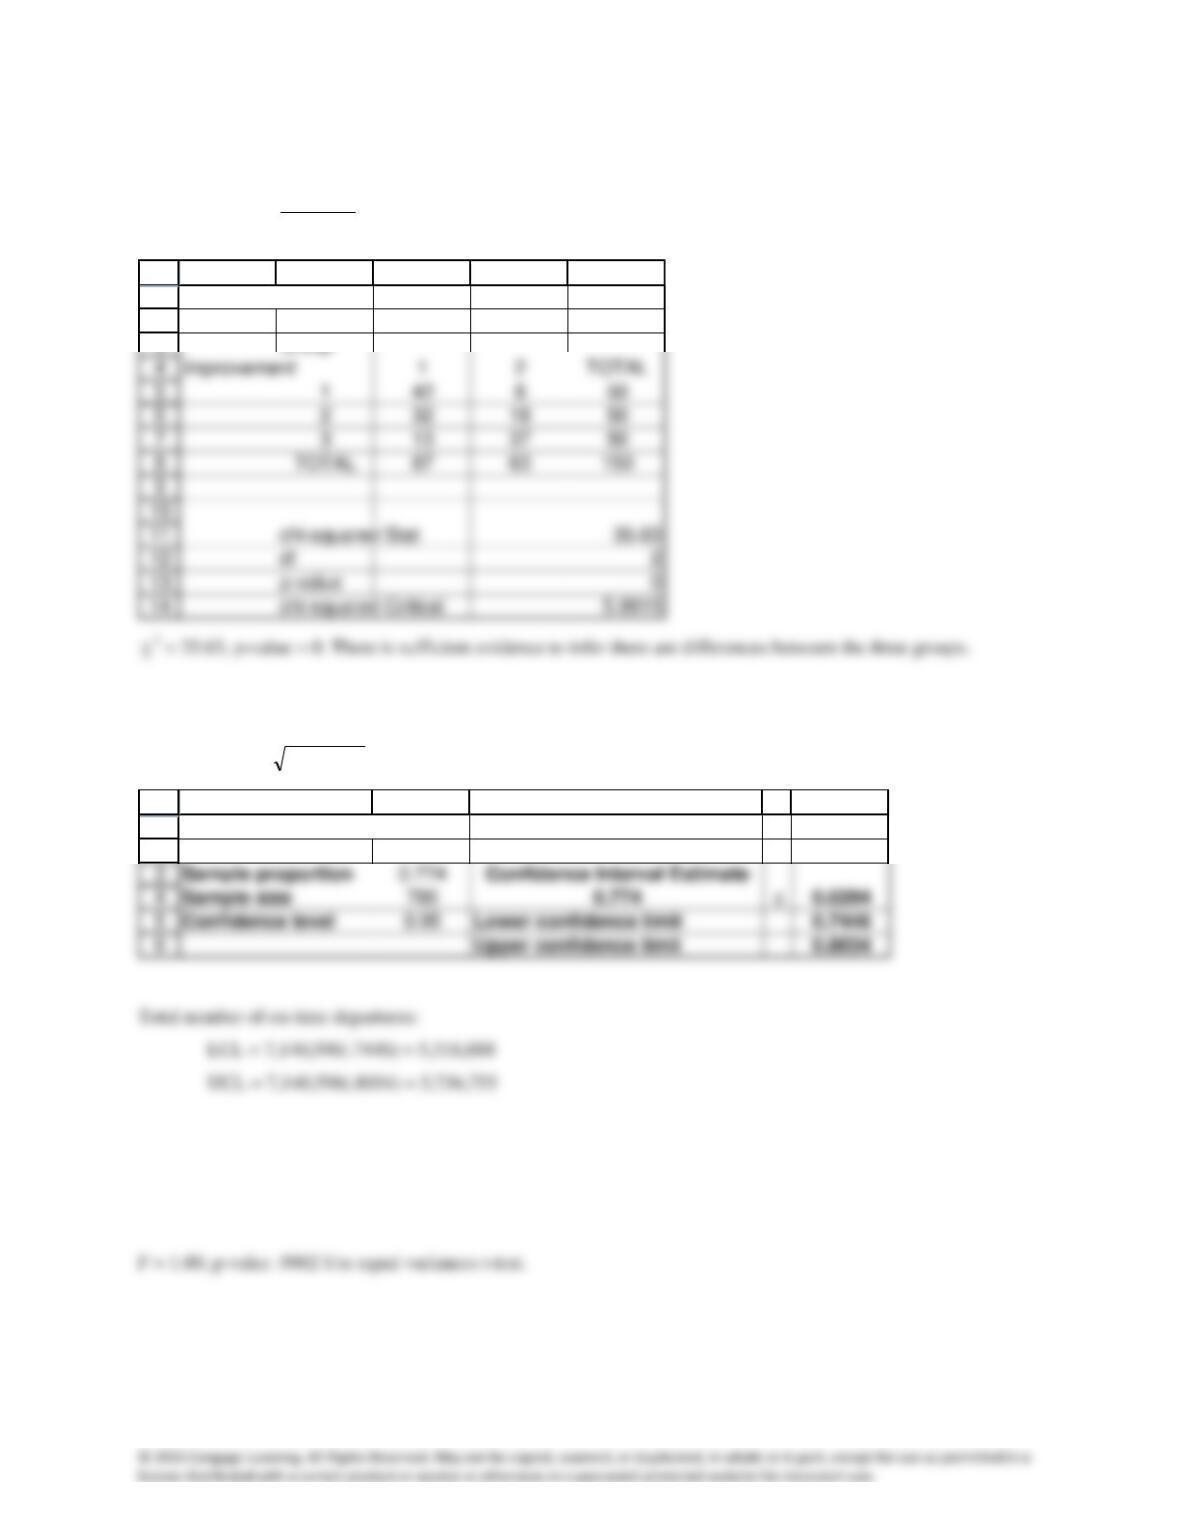
Sample proportion 0.774 Confidence Interval Estimate
Sample size 780 0.774 ±0.0294
Confidence level 0.95 Lower confidence limit 0.7446
1
2
A B C D E
z-Estimate of a Proportion
A15.17
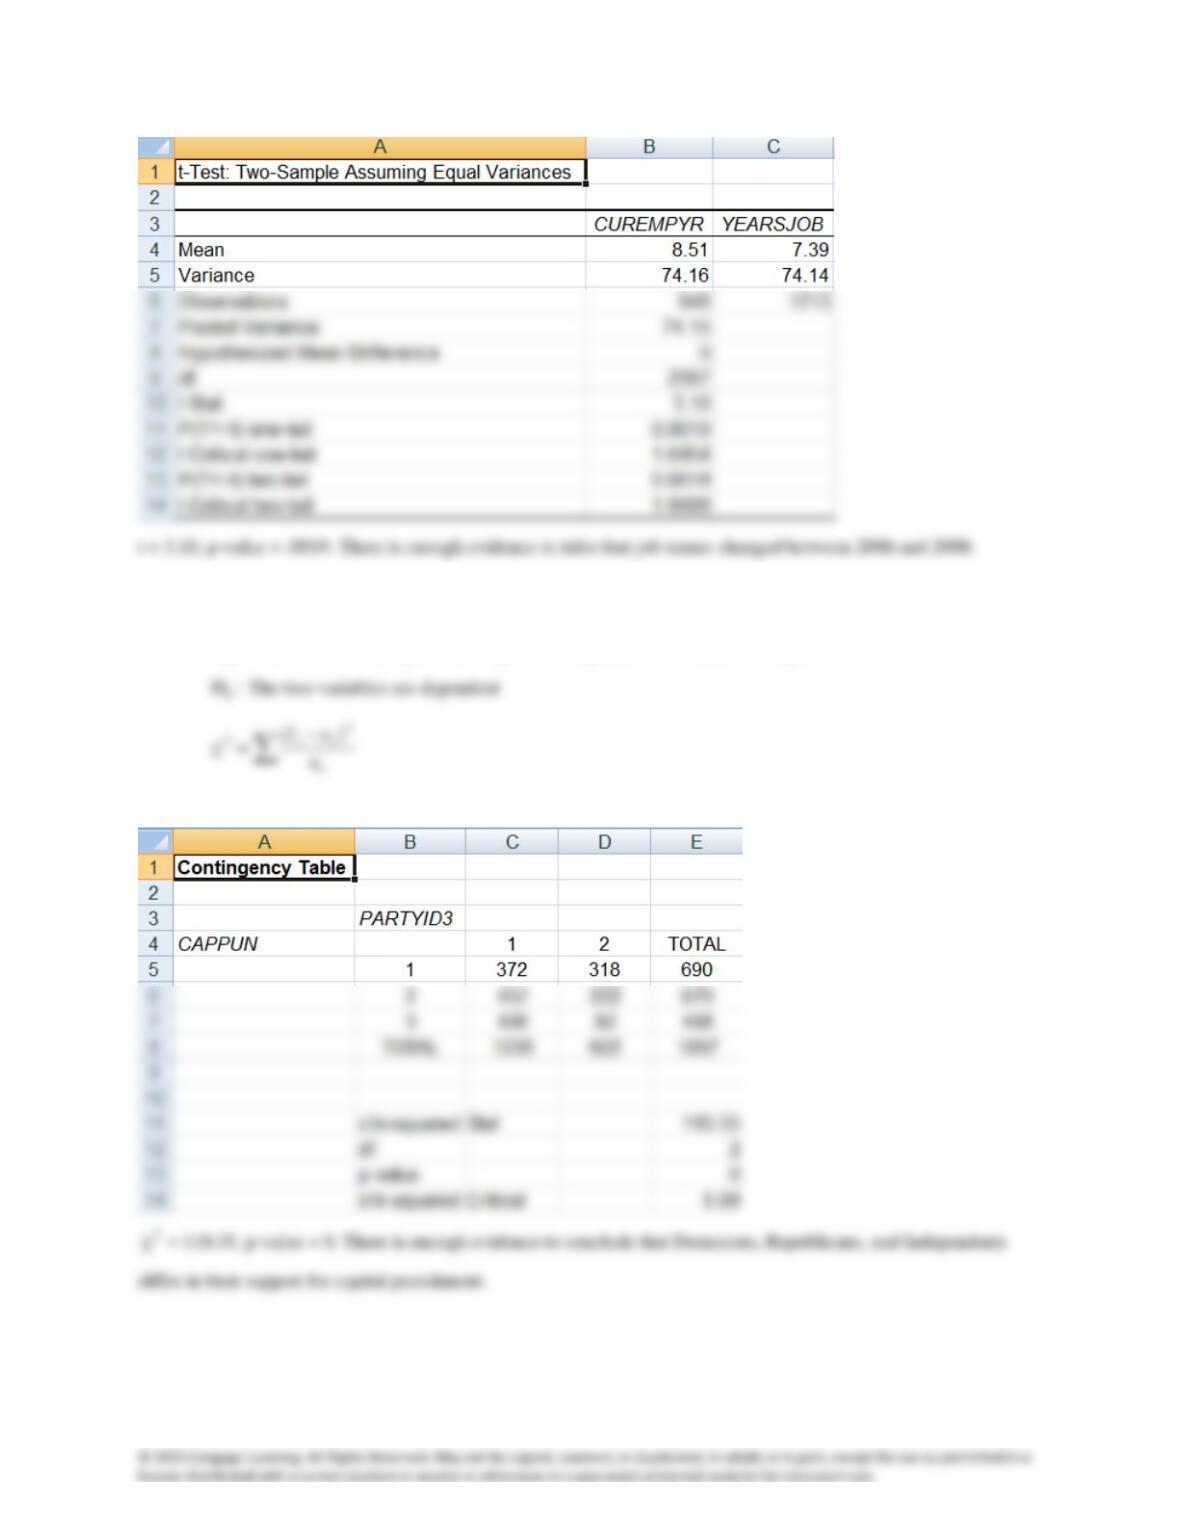
)(:H 210 −
= 0
)(:H 211 −
≠ 0
A15.18 Chi-squared test of a contingency table
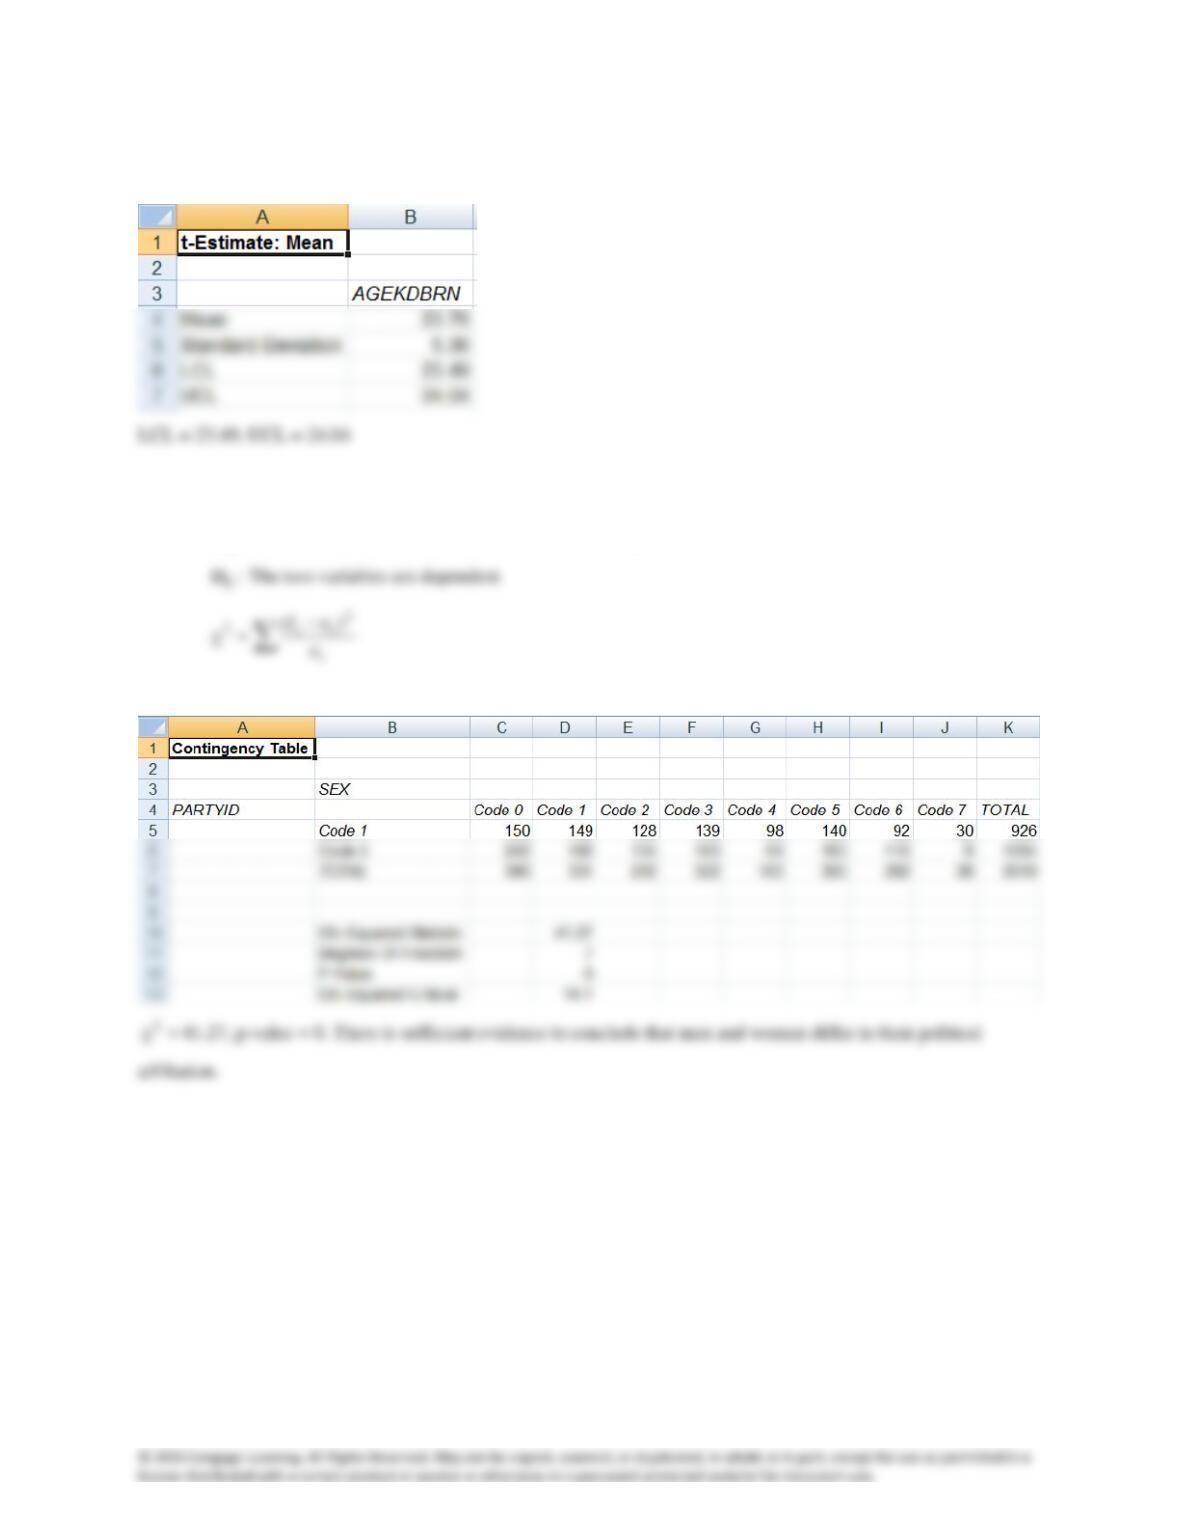
:H0
The two variables (party and support for capital punishment) are independent
A15.19 t-estimate of a mean
A15.20 Chi-squared test of a contingency table
:H0
The two variables (PARTYID and SEX) are independent
A15.21 one-way analysis of variance
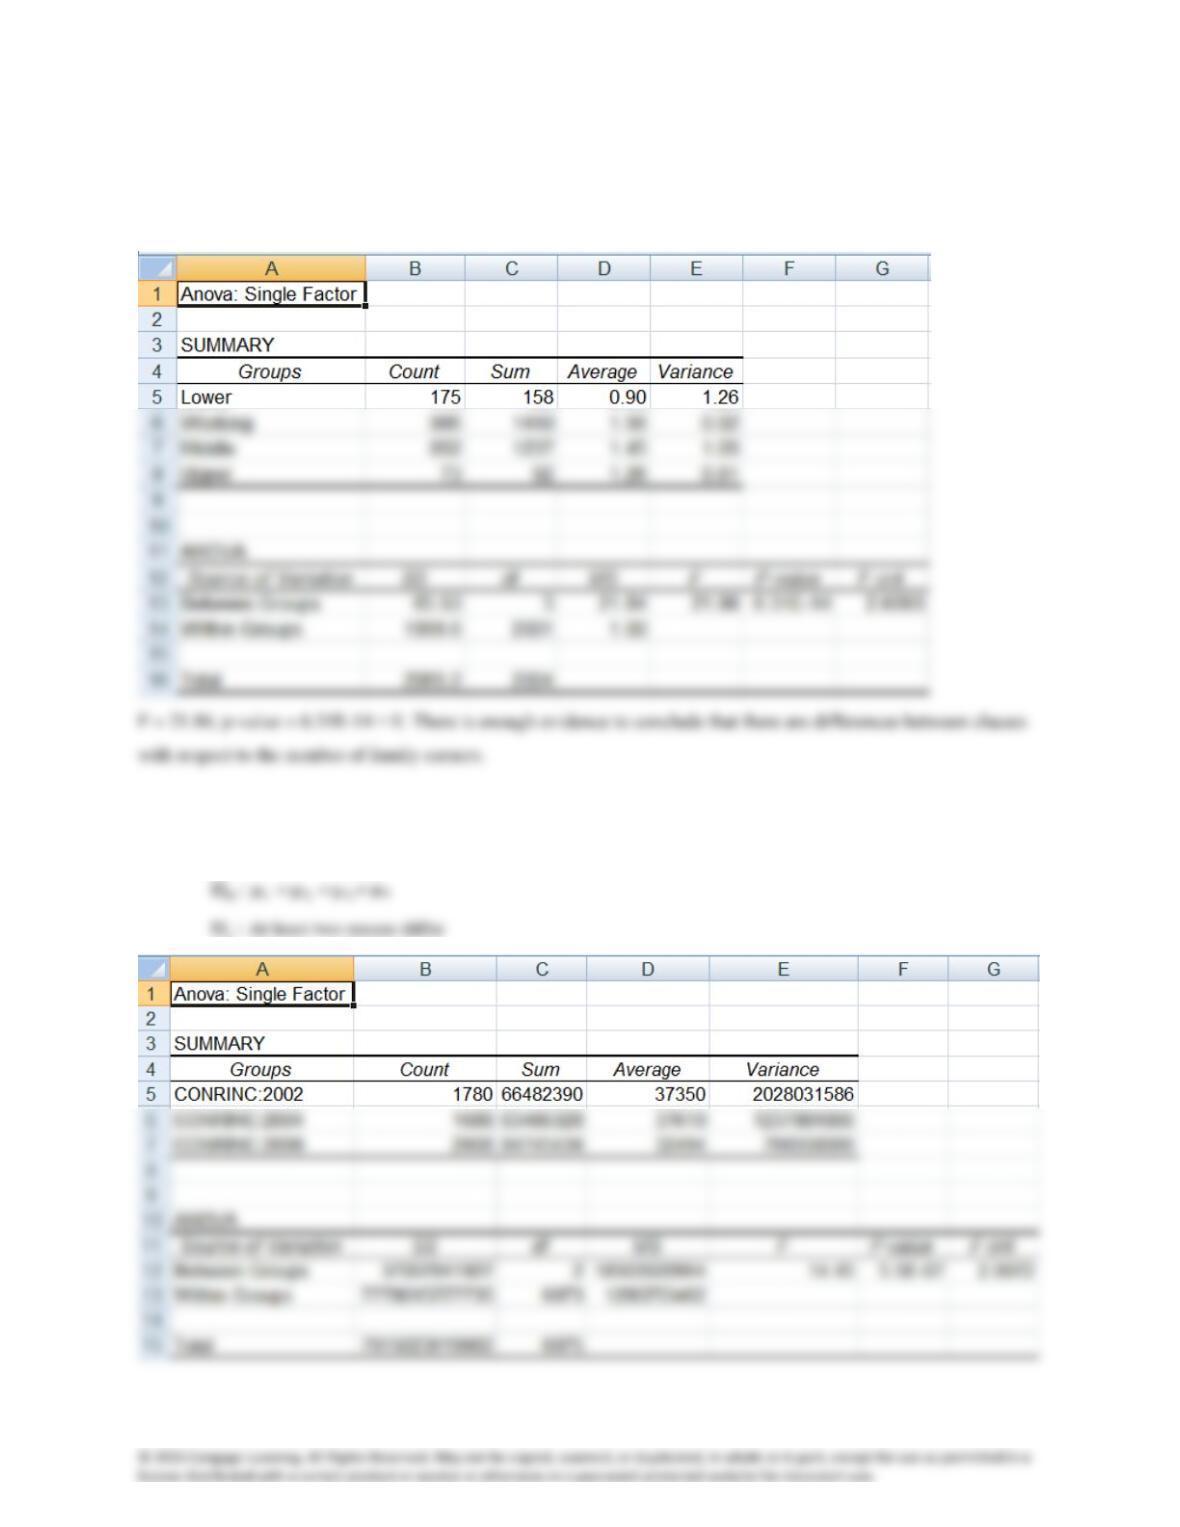
:H0
321 ==
= µ4
:H1
At least two means differ
A15.22 one-way analysis of variance
:H0
321 ==
:H1
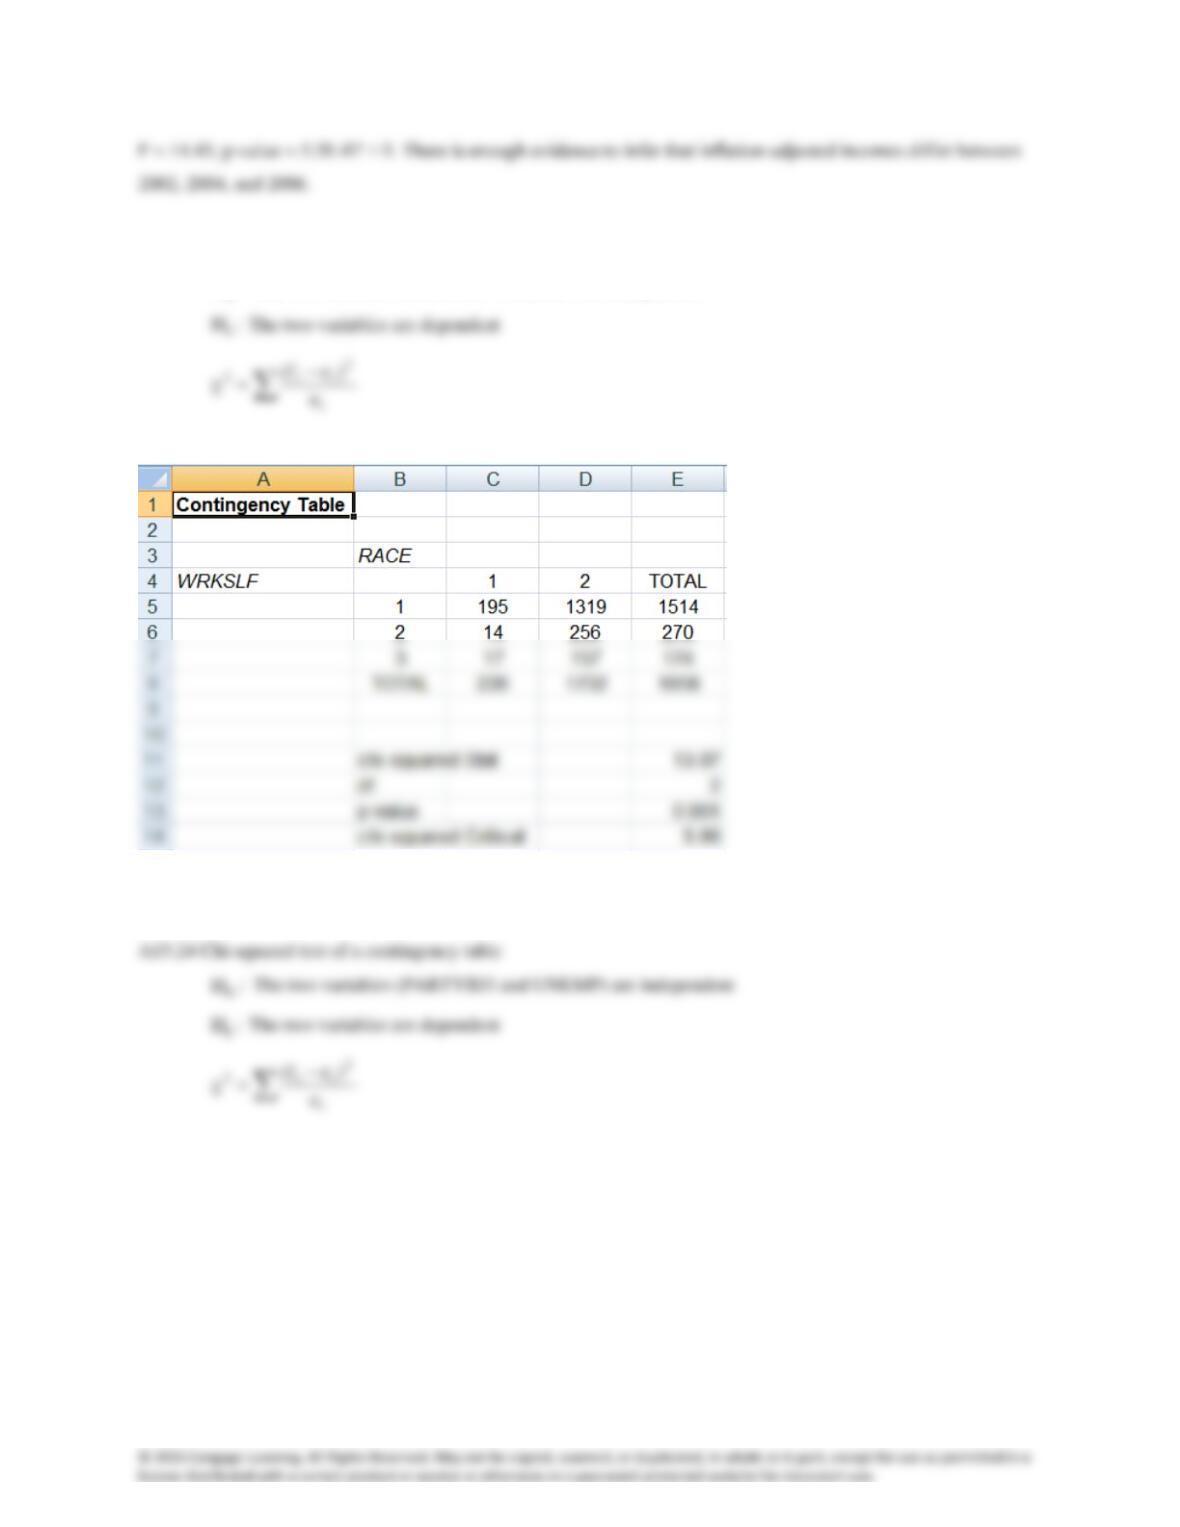
A15.23 Chi-squared test of a contingency table
:H0
The two variables (RACE and WRKSLF) are independent
=2
:H0
13.87, p-value = .0010. There is sufficient evidence to conclude that differences exist between the races in
whether an individual is self-employed.
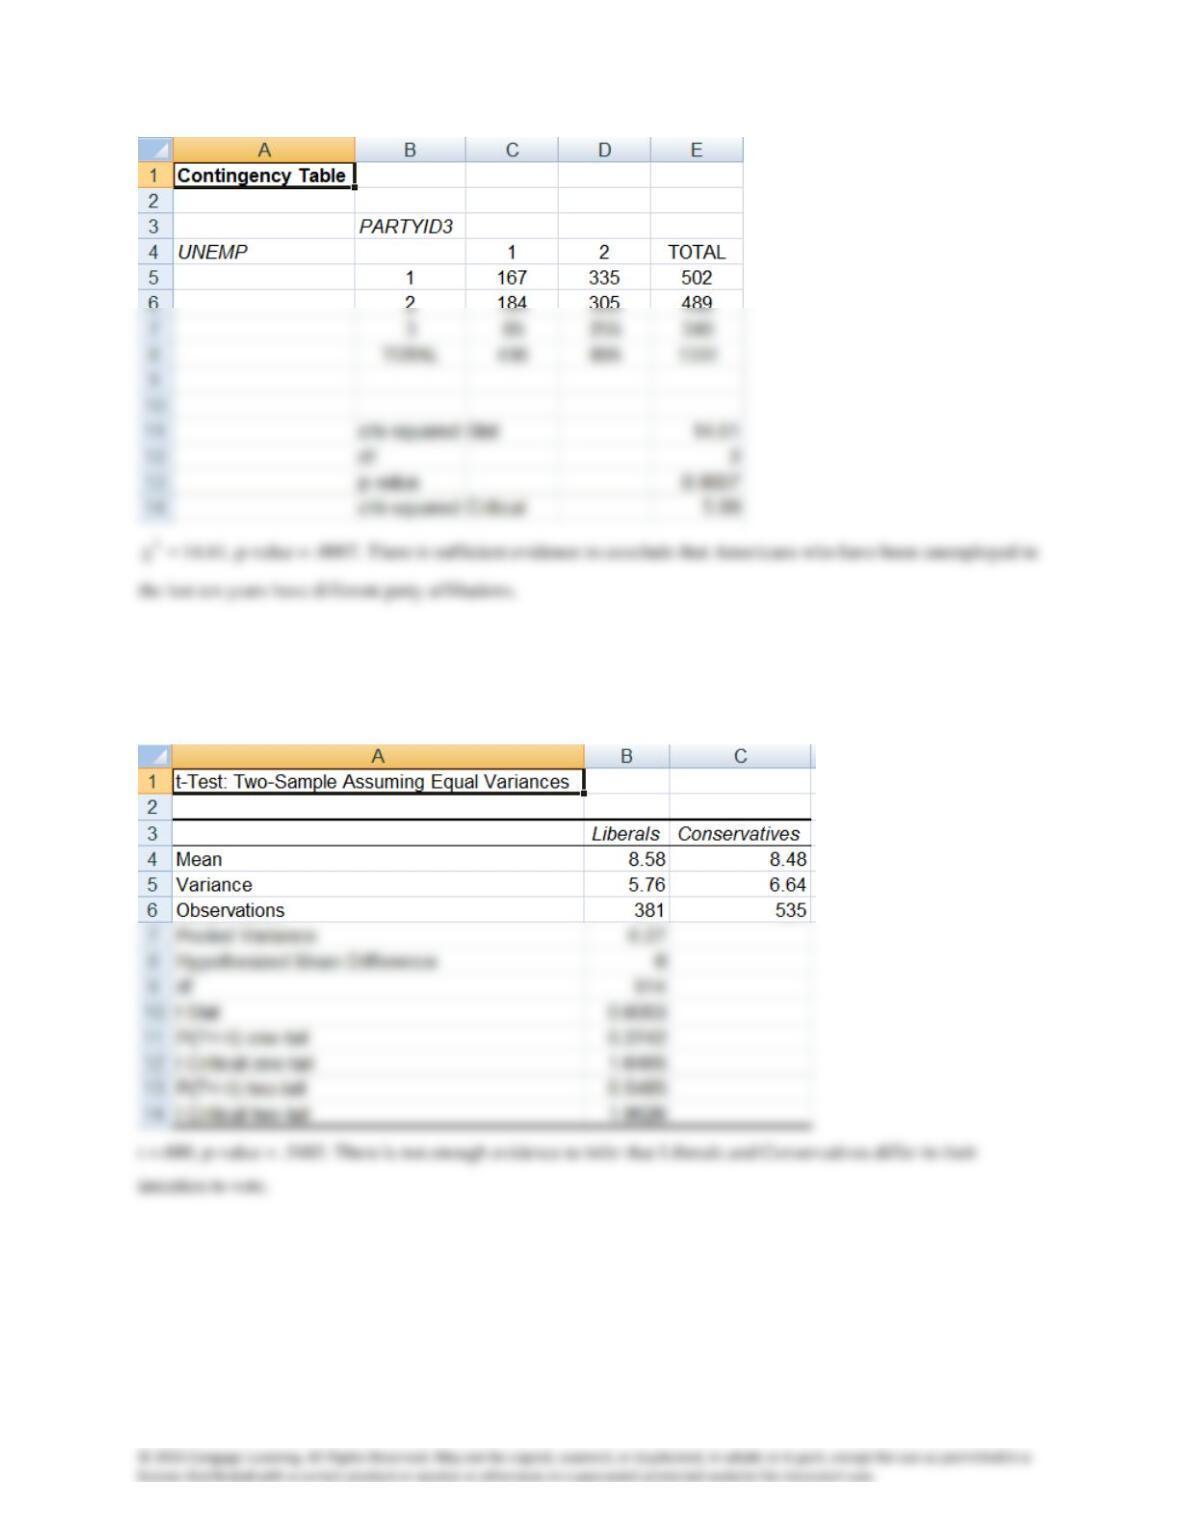
A15.25 H0: (µ1 – µ2) = 0
H1: (µ1 – µ2) ≠ 0
F = .866 p-value = .1339. Use equal-variances
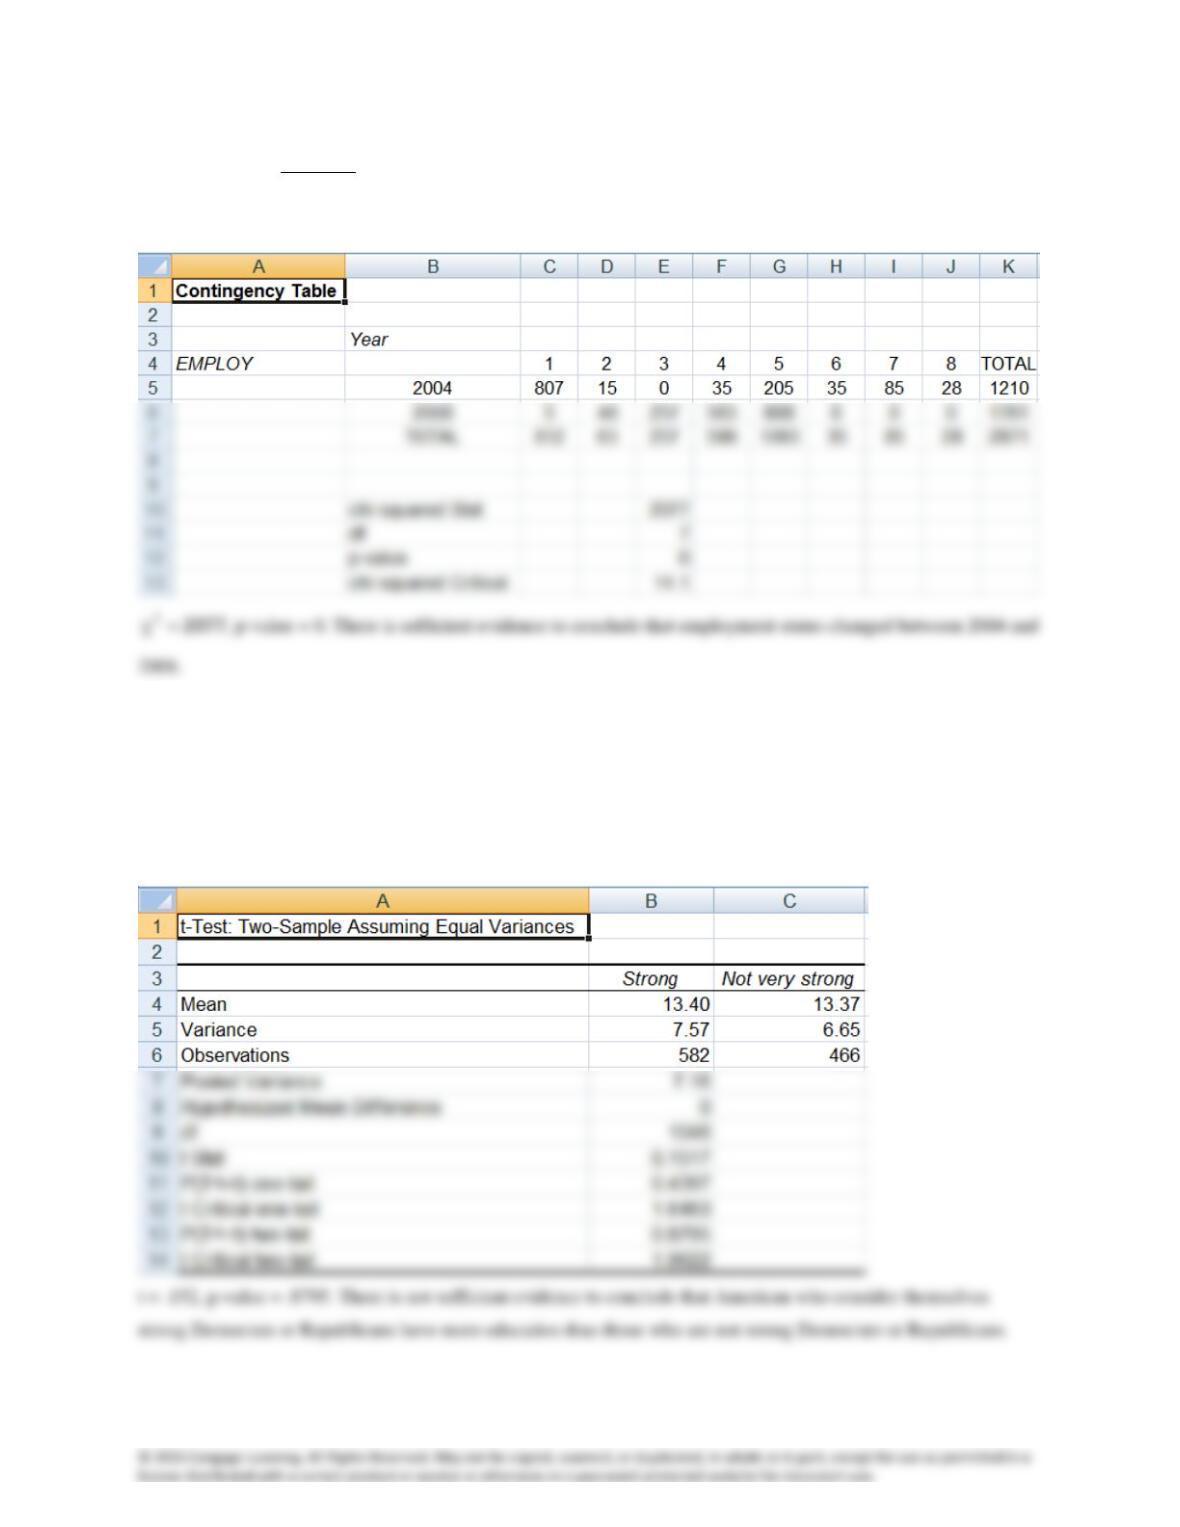
A15.26 Chi-squared test of a contingency table
:H0
The two variables (Year and EMPLOY) are independent
:H1
The two variables are dependent
−
=
i
2
ii
2
e
)ef(
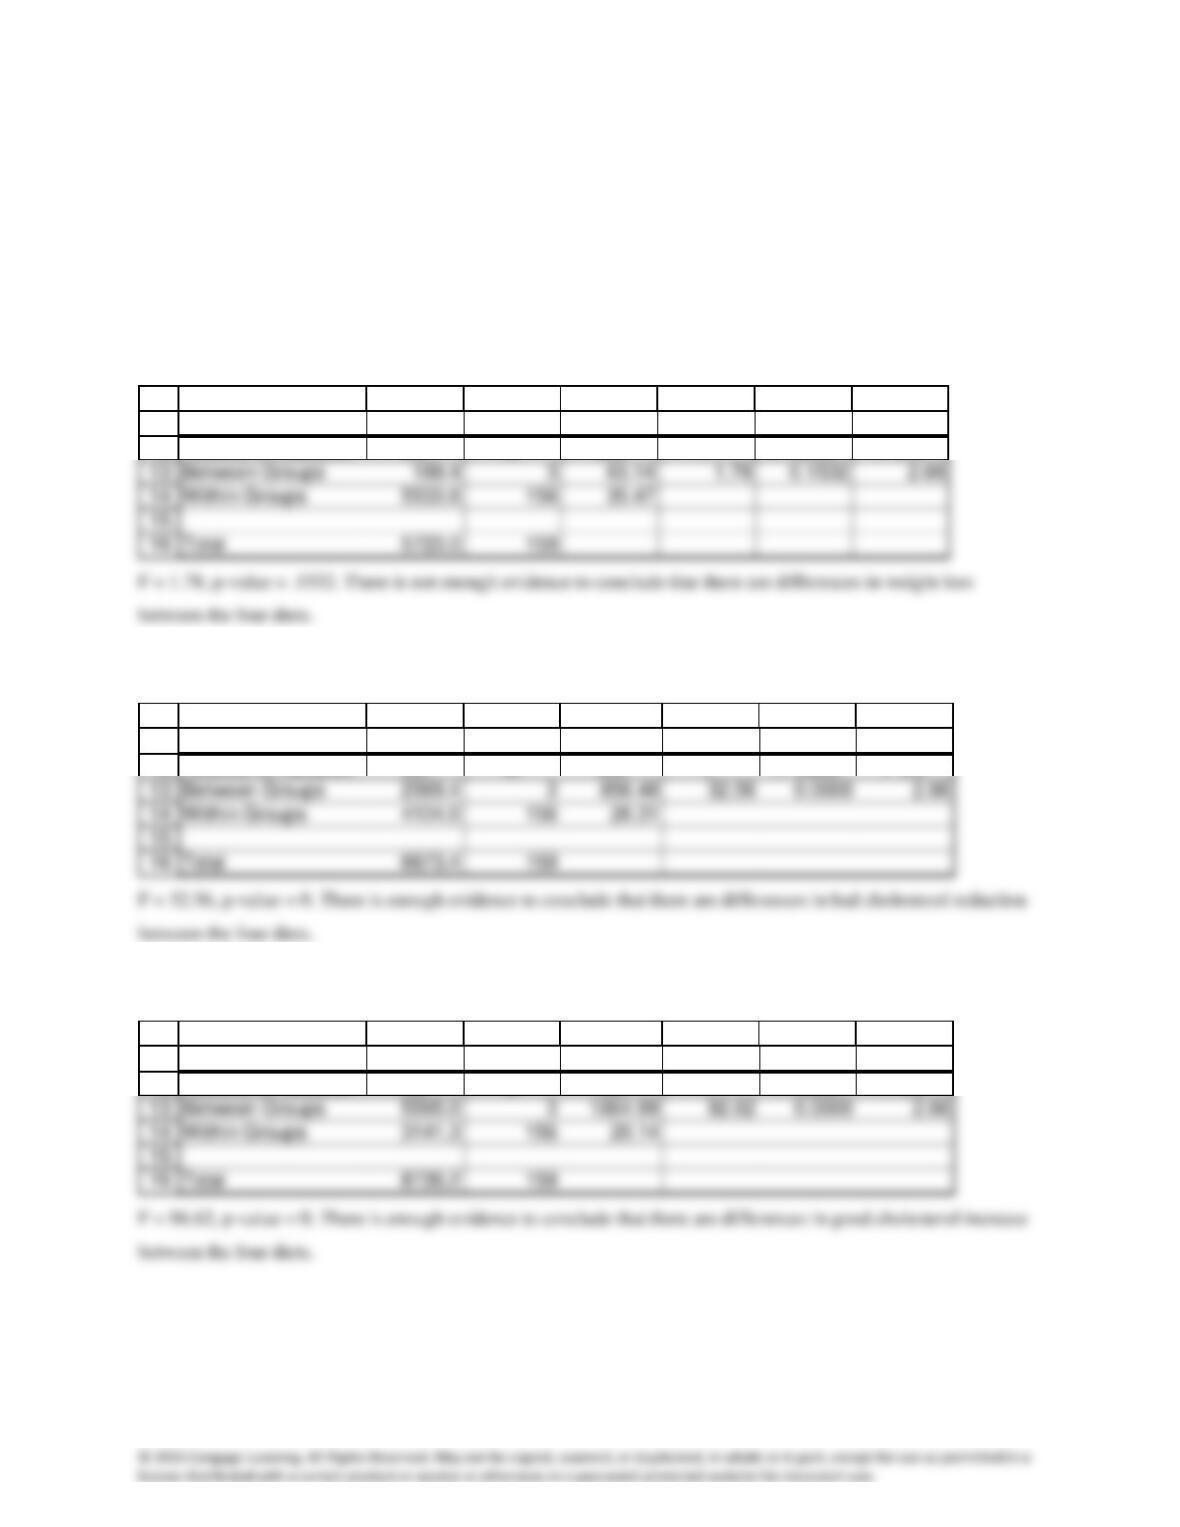
A15.27 H0: (µ1 – µ2) = 0
H1: (µ1 – µ2) > 0
F = 1.14, p-value = .1429. Use equal-variances t-test
Case A15.1 One-way analysis of variance
:H0
4321 ===
:H1
At least two means differ
Weight loss:
11
16
12
A B C D E F G
ANOVA
Source of Variation SS df MS F P-value F crit
Percent LDL decrease:
11
16
12
A B C D E F G
ANOVA
Source of Variation SS df MS F P-value F crit
Percent HDL Increase:
11
16
12
A B C D E F G
ANOVA
Source of Variation SS df MS F P-value F crit