CHAPTER 2: GRAPHICAL DESCRIPTIVE TECHNIQUES I
TRUE/FALSE
1. Your age group (1-9; 10-19; 20-29; 30-39; etc.) is an interval variable.
2. Your gender is a nominal variable.
3. Your final grade in a course (A, B, C, D, E) is a nominal variable.
4. Your age is an interval variable.
5. Interval data may be treated as ordinal or nominal.
6. Whether or not you are over the age of 21 is a nominal variable.
7. The values of quantitative data are categories.
8. Interval data, such as heights, weights, incomes, and distances, are also referred to as quantitative or
numerical data.
9. All calculations are permitted on interval data.
10. Nominal data are also called qualitative or categorical.
11. A variable is some characteristic of a population or sample.
12. With nominal data, there is one and only one way the possible values can be ordered.
13. You cannot calculate and interpret differences between numbers assigned to ordinal data.
MULTIPLE CHOICE
1. The classification of student major (accounting, economics, management, marketing, other) is an
example of a(n)
a.
nominal random variable.
c.
continuous random variable.
b.
interval random variable.
d.
parameter.
2. The classification of student class designation (freshman, sophomore, junior, senior) is an example of
a(n)
a.
nominal random variable.
c.
ordinal random variable.
b.
interval random variable.
d.
a parameter.
3. A researcher wishes to estimate the textbook costs of first-year students at Barry University. To do so,
he recorded the textbook cost of 300 first-year students and found that their average textbook cost was
$195 per semester. The variable of interest to the researcher is
a.
textbook cost.
c.
number of students.
b.
class rank.
d.
name of university.
4. All calculations are permitted on what type of data?
a.
Interval data
c.
Ordinal data
b.
Nominal data
d.
All of these choices are true.
5. Values must represent ordered rankings for what type of data?
a.
Interval data
c.
Ordinal data
b.
Nominal data
d.
None of these choices.
6. For what type of data are frequencies the only calculations that can be done?
a.
Interval data
c.
Ordinal data
b.
Nominal data
d.
None of these choices.
7. For which type of data are the values arbitrary numbers?
a.
Interval data
c.
Ordinal data
b.
Nominal data
d.
None of these choices.
COMPLETION
1. The Chief of Police conducted a survey of the officers on his squad. An officer’s shooting score at
target practice is an example of a(n) ____________________ variable.
2. The Dean of Students conducted a survey on campus. The gender of each student is an example of a(n)
____________________ variable.
3. The Dean of Students conducted a survey on campus. Class rank (Freshman, Sophomore, Junior, and
Senior) is an example of a(n) ____________________ variable.
4. The final grade received in a Literature course (A, B, C, D, or F) is an example of a(n)
____________________ variable.
5. In purchasing a used computer, there are a number of variables to consider. The age of the computer is
an example of a(n) ____________________ variable.
6. In purchasing an automobile, there are a number of variables to consider. The body style of the car
(sedan, coupe, wagon, etc.) is an example of a(n) ____________________ variable.
SHORT ANSWER
1. At the end of a safari, the tour guide asks the vacationers to respond to the questions listed below. For
each question, determine whether the possible responses are interval, nominal, or ordinal.
a.
How many safaris have you taken prior to this one?
b.
Do you feel that your tour safari lasted sufficiently long (yes/no)?
c.
Which of the following features of the accommodations did you find most attractive:
location, facilities, room size, service, or price?
d.
What is the maximum number of hours per day that you would like to spend traveling?
e.
Is your overall rating of this safari: excellent, good, fair, or poor?
a.
Interval
b.
Nominal
c.
Nominal
d.
Interval
e.
Ordinal
2. Before leaving a particular restaurant, customers are asked to respond to the questions listed below.
For each question, determine whether the possible responses are interval, nominal, or ordinal.
a.
What is the approximate distance (in miles) between this restaurant and your residence?
b.
Have you ever eaten at this restaurant before?
c.
On how many occasions have you eaten at the restaurant before?
d.
Which of the following attributes of this restaurant do you find most attractive: service,
prices, quality of the food, or the menu?
e.
What is your overall rating of the restaurant: excellent, good, fair, or poor?
a.
Interval
b.
Nominal
c.
Interval
d.
Nominal
e.
Ordinal
3. For each of the following examples, identify the data type as nominal, ordinal, or interval.
a.
The final grade received by a student in a neuro-science class.
b.
The number of students in a Physics course.
c.
The starting salary of a PhD graduate.
d.
The size of an order of fries (small, medium, large, super-size) purchased by a Burger
King customer.
e.
The college you are enrolled in (Arts and Sciences, Business, Education, etc.).
a.
Ordinal
b.
Interval
c.
Interval
d.
Ordinal
e.
Nominal
4. For each of the following, indicate whether the variable of interest is nominal or interval.
a.
Your marital status.
b.
Whether you are a U.S. citizen.
c.
Sally’s travel time from her dorm to the student union on campus.
d.
The amount of time you spent last week on your homework.
e.
The number of cars parked in a certain parking lot at any given time.
f.
Kate’s favorite brand of sneakers.
a.
Nominal
b.
Nominal
c.
Interval
e.
Interval
f.
Nominal
5. Provide one example of ordinal data; one example of nominal data; and one example of interval data.
6. Explain why religious preference is not an ordinal variable.
7. Explain the difference between ordinal data and interval data.
8. Give an example of interval data that can also be treated as ordinal data and nominal data.
9. A bar chart is used to represent interval data.
10. One of the advantages of a pie chart is that it clearly shows that the total percentages of all the
categories add to 100%.
11. Bar and pie charts are graphical techniques for nominal data. The former focus the attention on the
frequency of the occurrences of each category, and the later emphasizes the proportion of occurrences
of each category.
12. A relative frequency distribution lists the categories and their counts.
13. A frequency distribution lists the categories and the proportion with which each occurs.
14. From a pie chart you are able to find the frequency for each category.
15. Which of the following statements about pie charts is false?
a.
A pie chart is a graphical representation of a relative frequency distribution.
b.
You can always determine frequencies for each category by looking at a pie chart.
c.
The total percentage of all the slices of a pie chart is 100%.
d.
The area of a slice of a pie chart is the proportion of all the individuals that fall into that
particular category.
16. Which of the following situations is best suited for a pie chart?
a.
The number of dollars spent this year on each type of legal gambling.
b.
The percentage of a charitable donation that goes to administrative costs vs. directly to the
charity.
c.
The number of students in your class who received an A, B, C, D, F on their exam.
d.
All of these choices are true.
17. Which situation identifies when to use pie charts and/or bar charts?
a.
You want to describe a single set of data.
b.
Your data is nominal.
c.
You want to show the number or the percentage of individuals in each category.
d.
All of these choices are true.
18. Suppose you measure the number of minutes it takes an employee to complete a task, where the
maximum allowed time is 5 minutes, and each time is rounded to the nearest minute. Data from 130
employees is summarized below. How long did it take most employees to complete the task?
Time (minutes)
1
2
3
4
5
Frequency
25
40
50
35
30
a.
5 minutes
b.
3 minutes
c.
30 minutes
d.
50 minutes
19. Car buyers were asked to indicate the car dealer they believed offered the best overall service. The four
choices were Contour Motors (C), Modern Chrysler (M), Tonneau Auto (T), and Uncanny Chevrolet
(U). The following data were obtained:
T
C
C
C
U
C
M
T
C
U
U
M
C
M
T
C
M
M
C
M
T
C
C
T
U
M
M
C
C
T
T
U
C
U
T
M
M
C
U
T
What percentage of car buyers identified Contour Motors as having the best overall service?
a.
1/4 = 0.25 or 25%
b.
14/40 = 0.35 or 35%
c.
14%
d.
None of these choices.
20. Two types of graphs that organize nominal data are ____________________ and
____________________.
21. A bar chart is used to represent ____________________ data.
22. A pie chart is used to represent ____________________ data.
23. A(n) ____________________ chart is often used to display frequencies; a(n) ____________________
chart graphically shows relative frequencies.
24. A pie chart shows the ____________________ of individuals that fall into each category.
25. We can summarize nominal data in a table that presents the categories and their counts. This table is
called a(n) ____________________ distribution.
26. A(n) ____________________ distribution lists the categories of a nominal variable and the proportion
with which each occurs.
27. A(n) ____________________ chart is not able to show frequencies. It can only show relative
frequencies.
28. In a pie chart, each slice is proportional to the ____________________ of individuals in that category.
29. A category in a pie chart that contains 50% of the observations is represented by a slice of the pie that
is equal to ____________________ degrees.
30. Identify the type of data for which each of the following graphs is appropriate.
a.
Pie chart
b.
Bar chart
a.
Nominal
b.
Nominal
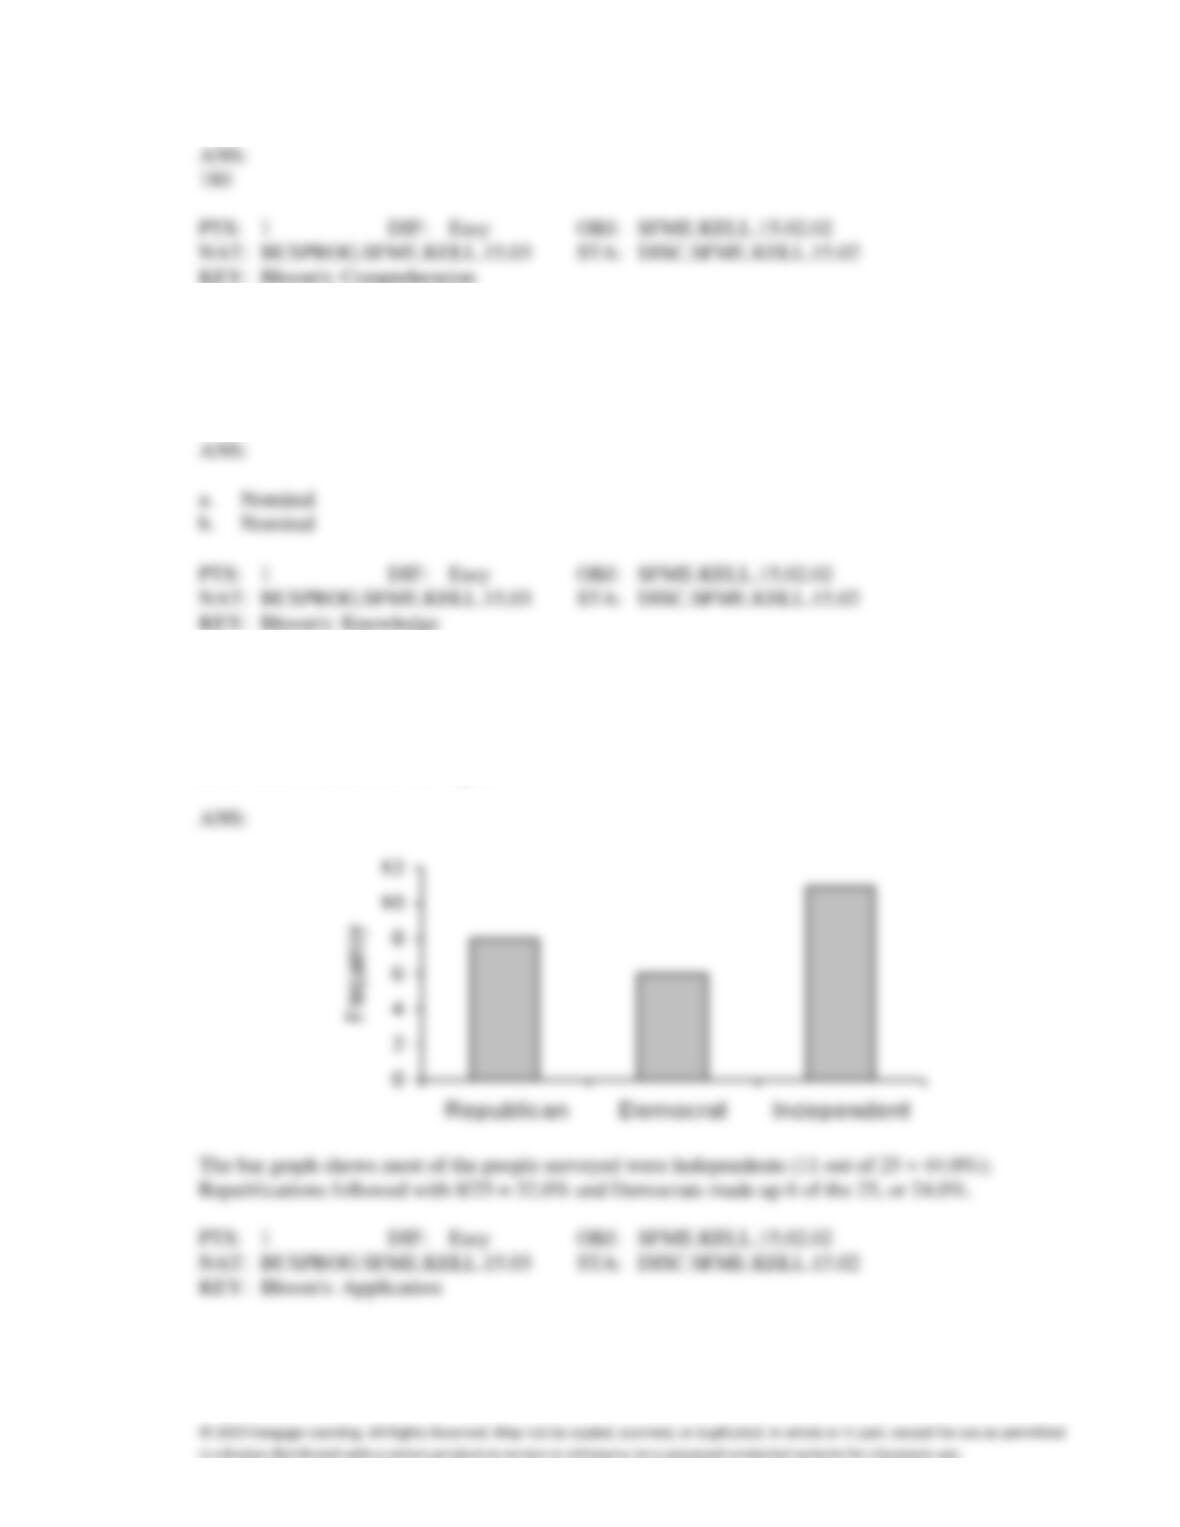
31. Twenty-five voters participating in a recent election exit poll in Minnesota were asked to state their
political party affiliation. Coding the data as R for Republican, D for Democrat, and I for Independent,
the data collected were as follows: I, R, D, I, R, I, I, D, R, I, I, D, R, R, I, D, I, R, I, D, I, D, R, R, and
I. Construct a frequency bar chart from this data. What does the bar chart tell you about the political
affiliations of those in this sample?
Car Buyers
Forty car buyers were asked to indicate which car dealer offered the best overall service. The four
choices were Contour Motors (C), Modern Chrysler (M), Tonneau Auto (T), and Uncanny Chevrolet
(U). The following data were obtained:
T
C
C
C
U
C
M
T
C
U
U
M
C
M
T
C
M
M
C
M
T
C
C
T
U
M
M
C
C
T
T
U
C
U
T
M
M
C
U
T
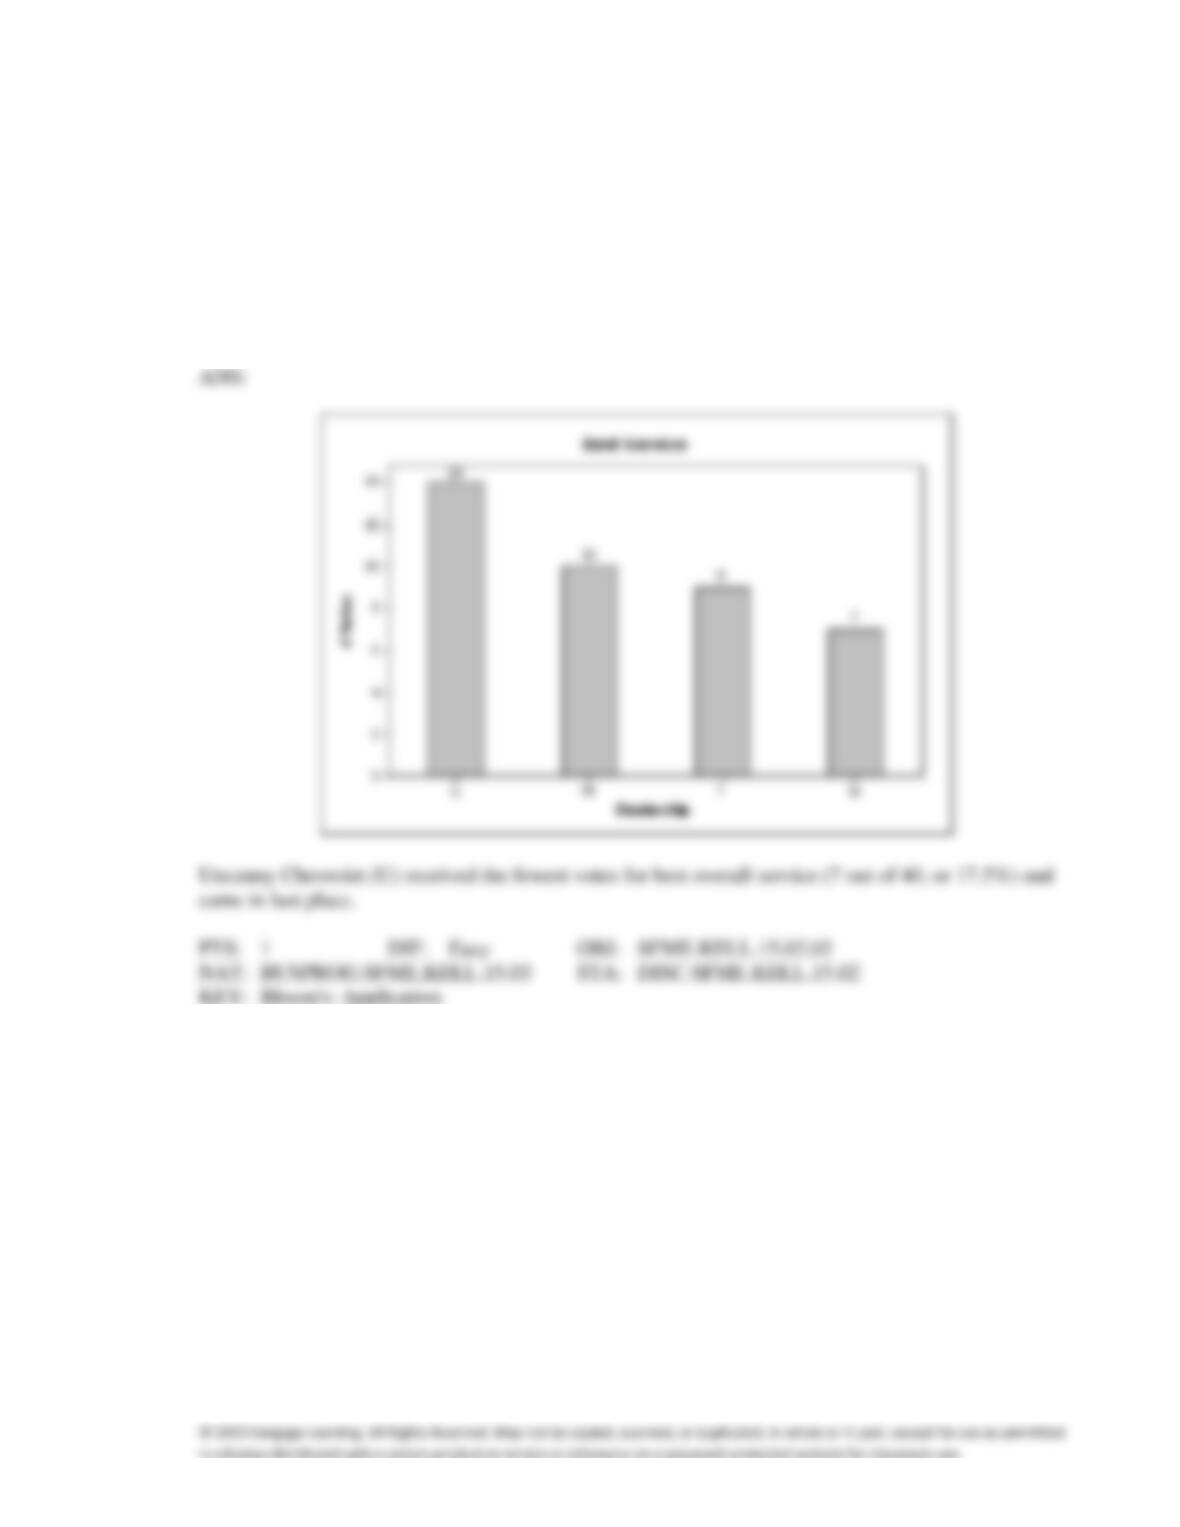
32. {Car Buyers Narrative} Construct a frequency bar chart of this data. Which car dealer came in last
place in terms of overall service?
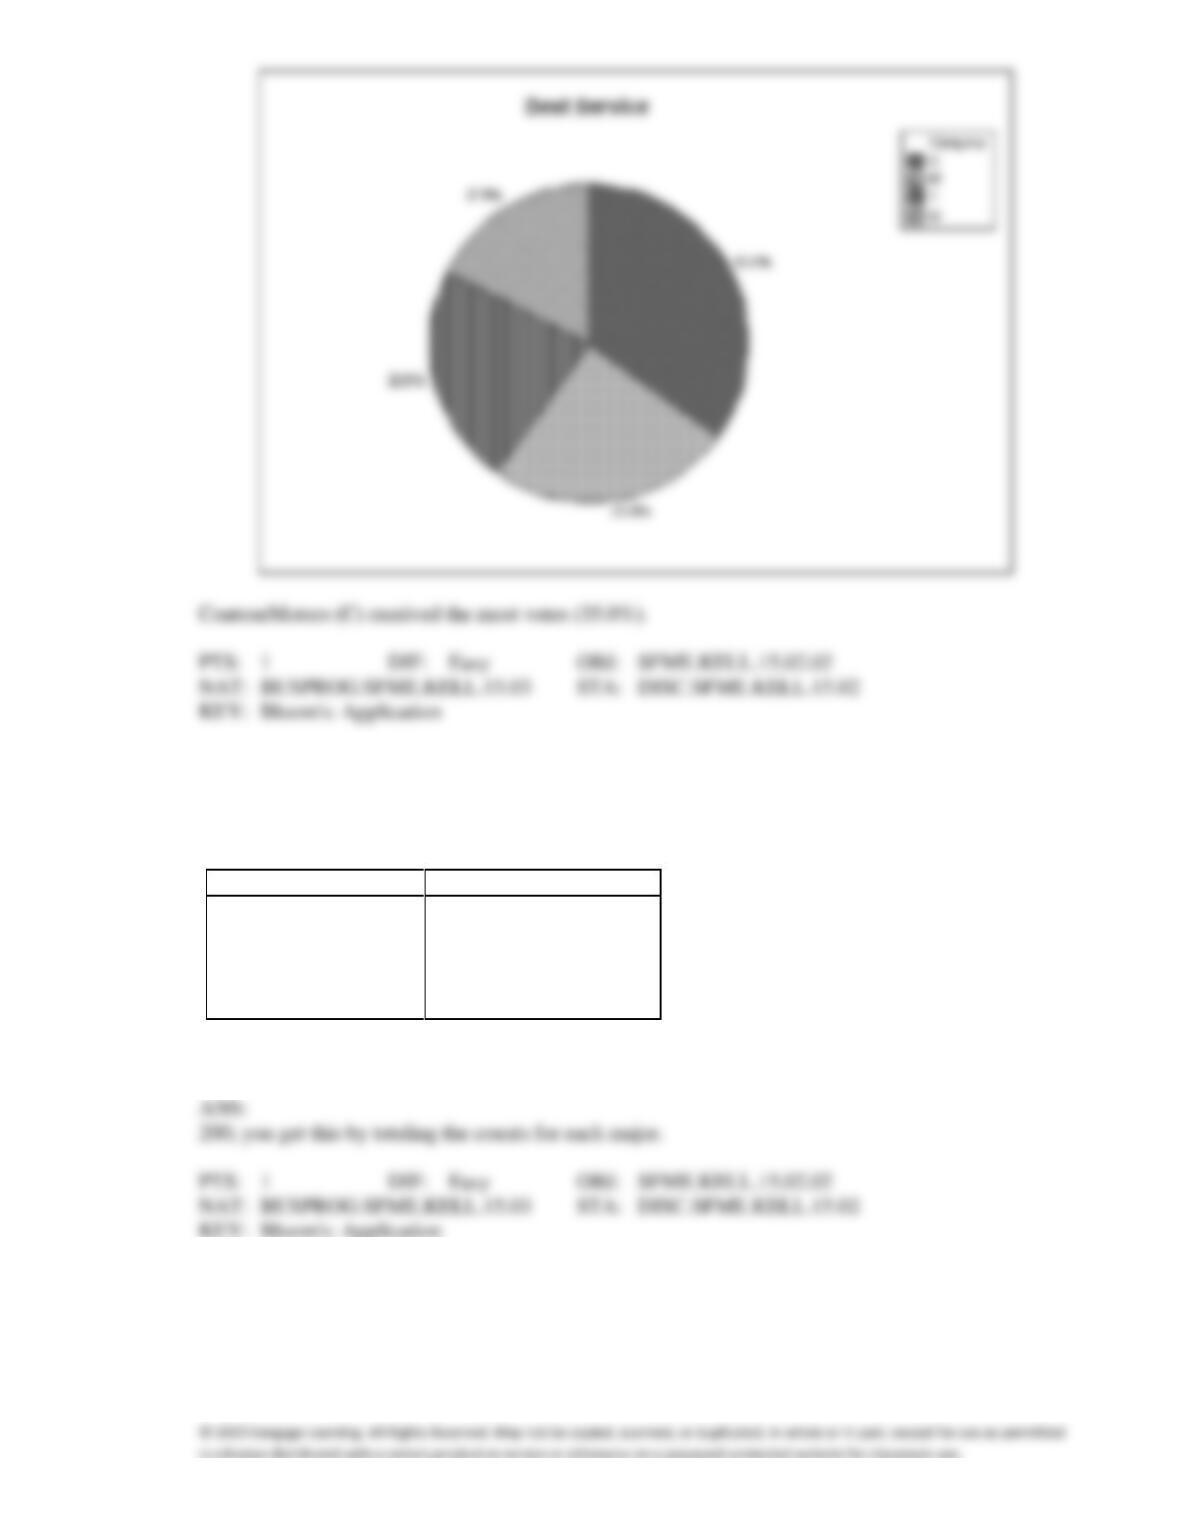
33. {Car Buyers Narrative} Construct a pie chart of this data. Which car dealer offered the best overall
service?
ANS:
Business School Graduates
A sample of business school graduates were asked what their major was. The results are shown in the
following frequency distribution.
Major of Graduates
Number of graduates
Accounting
58
Finance
42
Management
38
Marketing
52
Other
10
34. {Business School Graduates Narrative} How many graduates were surveyed?
35. {Business School Graduates Narrative} Draw a pie chart to summarize this data. Which major was the
most popular?
ANS: