Appendix 16
A16.1 t-test of ρ
0:H0=
0:H1
1
2
3
A B
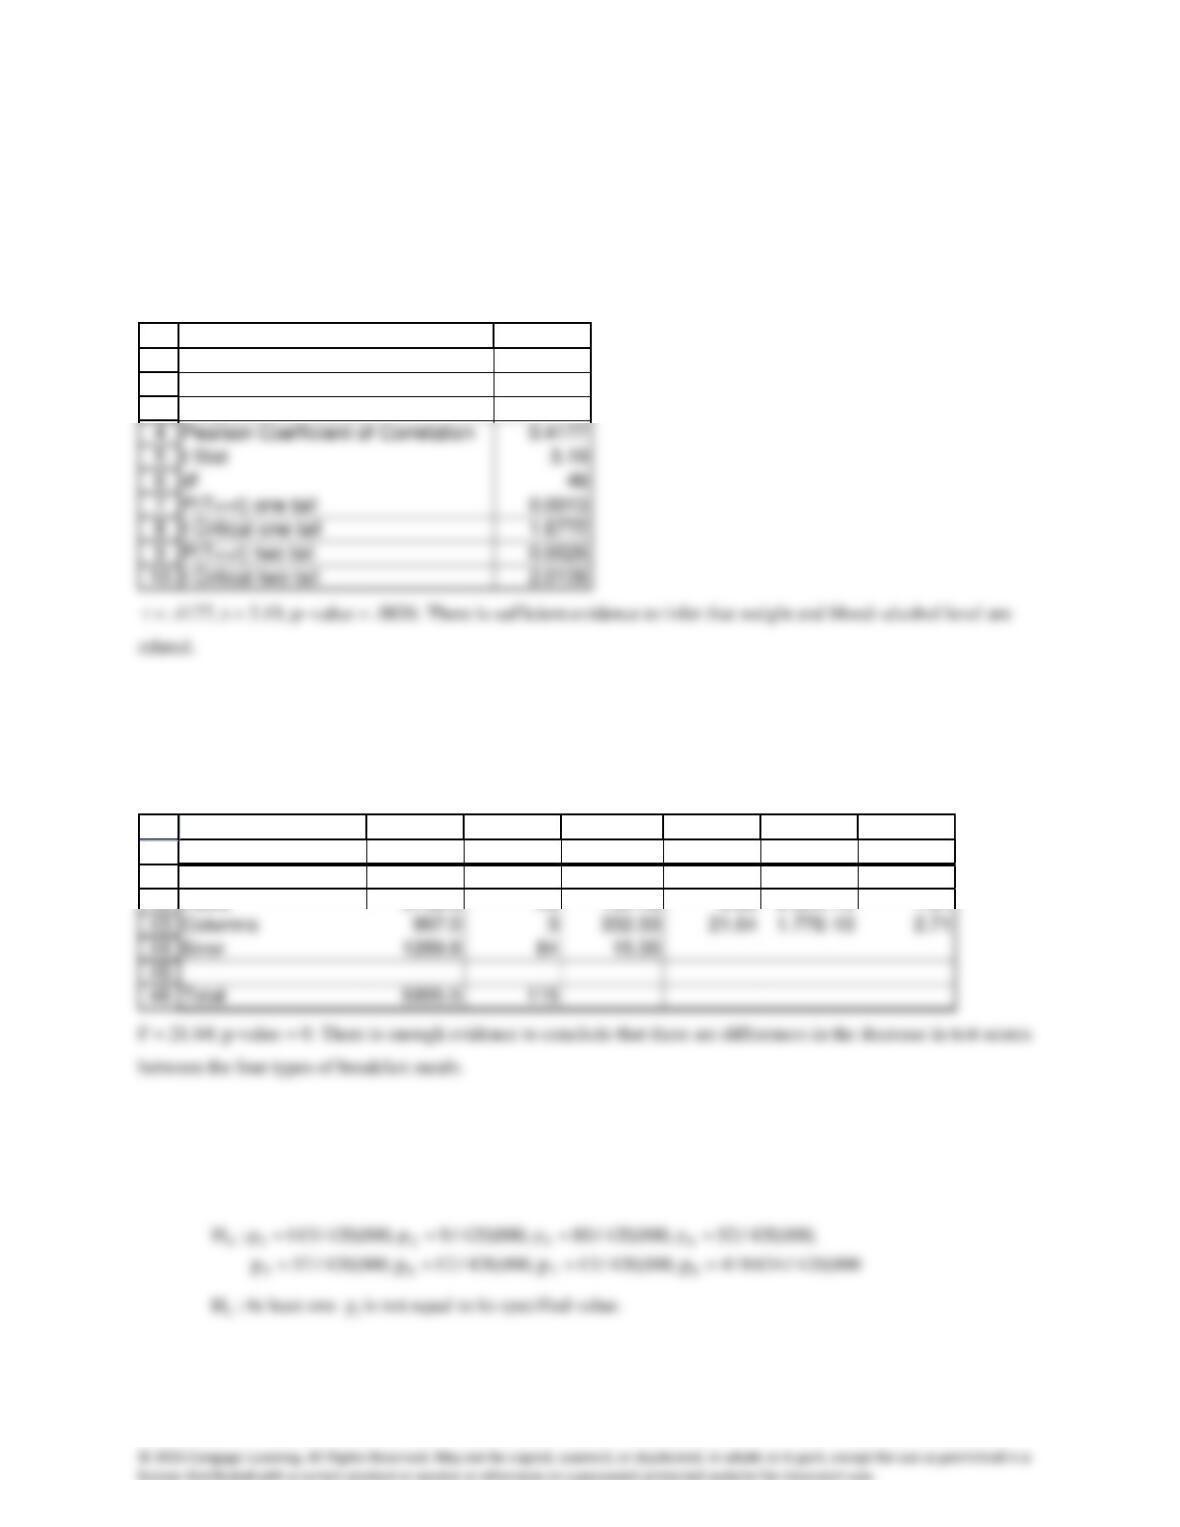
Correlation
Weight and B/A Level
A16.2 Two-way analysis of variance
:H0
4321 ===
:H1
At least two means differ
40
46
41
42
A B C D E F G
ANOVA
Source of Variation SS df MS F P-value F crit
Rows 3708.8 28 132.46 8.63 6.52E-15 1.61
A16.3a Chi-squared goodness-of-fit test (the percentages must be converted to actual and expected values and we
must include those who did not have cancer)
:H1
=
−
=
8
1i i
2
ii
2
e
)ef(
1
2
3
A B C D
Actual Expected
135 143
7 9
b The data are observational. Even if we regard the statistical result as significant we cannot automatically infer that
cell phone use causes cancer. Additionally, an examination of the actual and expected values reveals that in all 7
types of cancers the actual values are less than or equal to the expected values, indicating that (if anything) cell
phone use prevents cancer.
1
2
3
4
A B C D
Correlation
Age and Duration
Pearson Coefficient of Correlation
0.558
0)(:H 210 =−
)(:H 211 −
+
−−−
=
21
2
p
2121
n
1
n
1
s
)()xx(
t
1
2
3
4
5
A B C
t-Test: Two-Sample Assuming Equal Variances
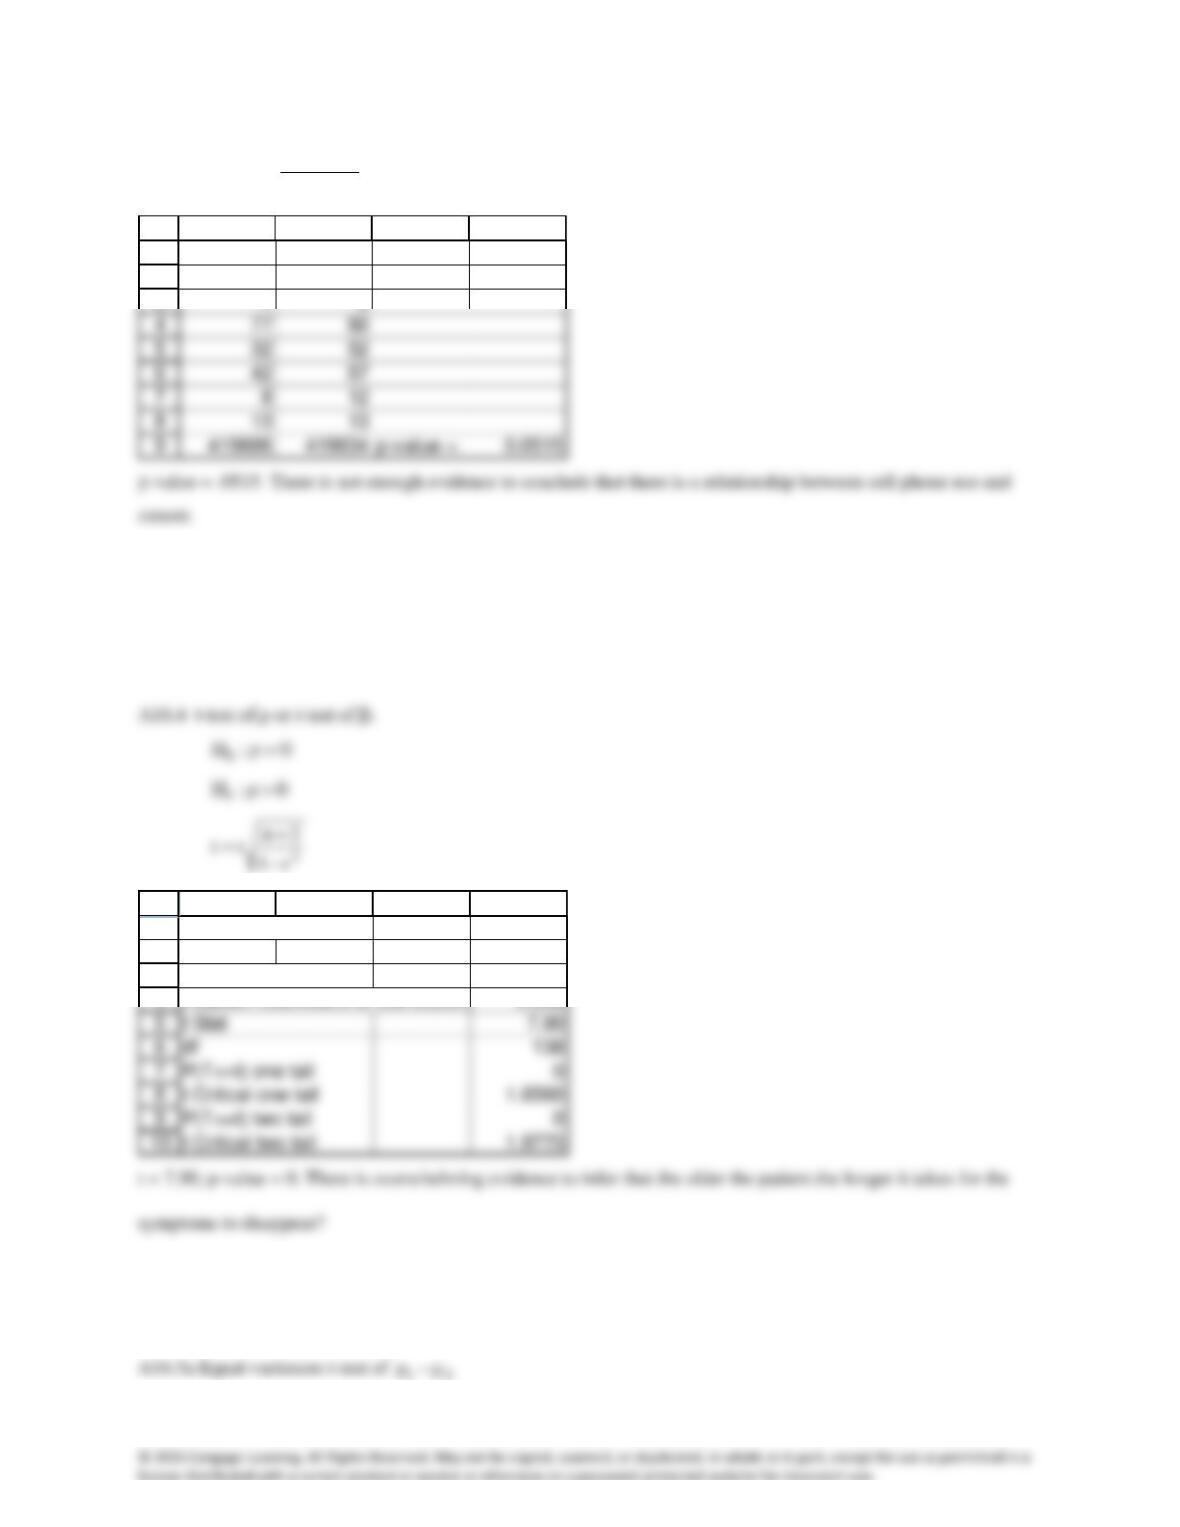
Home Outside
Mean 59.21 54.91
Variance 102.03 88.28
A16.6 Question 1: Equal-variances t-test of
21 −
0)(:H 210 =−
)(:H 211 −
< 0
+
−−−
=
21
2
p
2121
n
1
n
1
s
)()xx(
t
1
2
3
4
A B C
t-Test: Two-Sample Assuming Equal Variances
US Days Canada Days
Mean 26.98 29.44
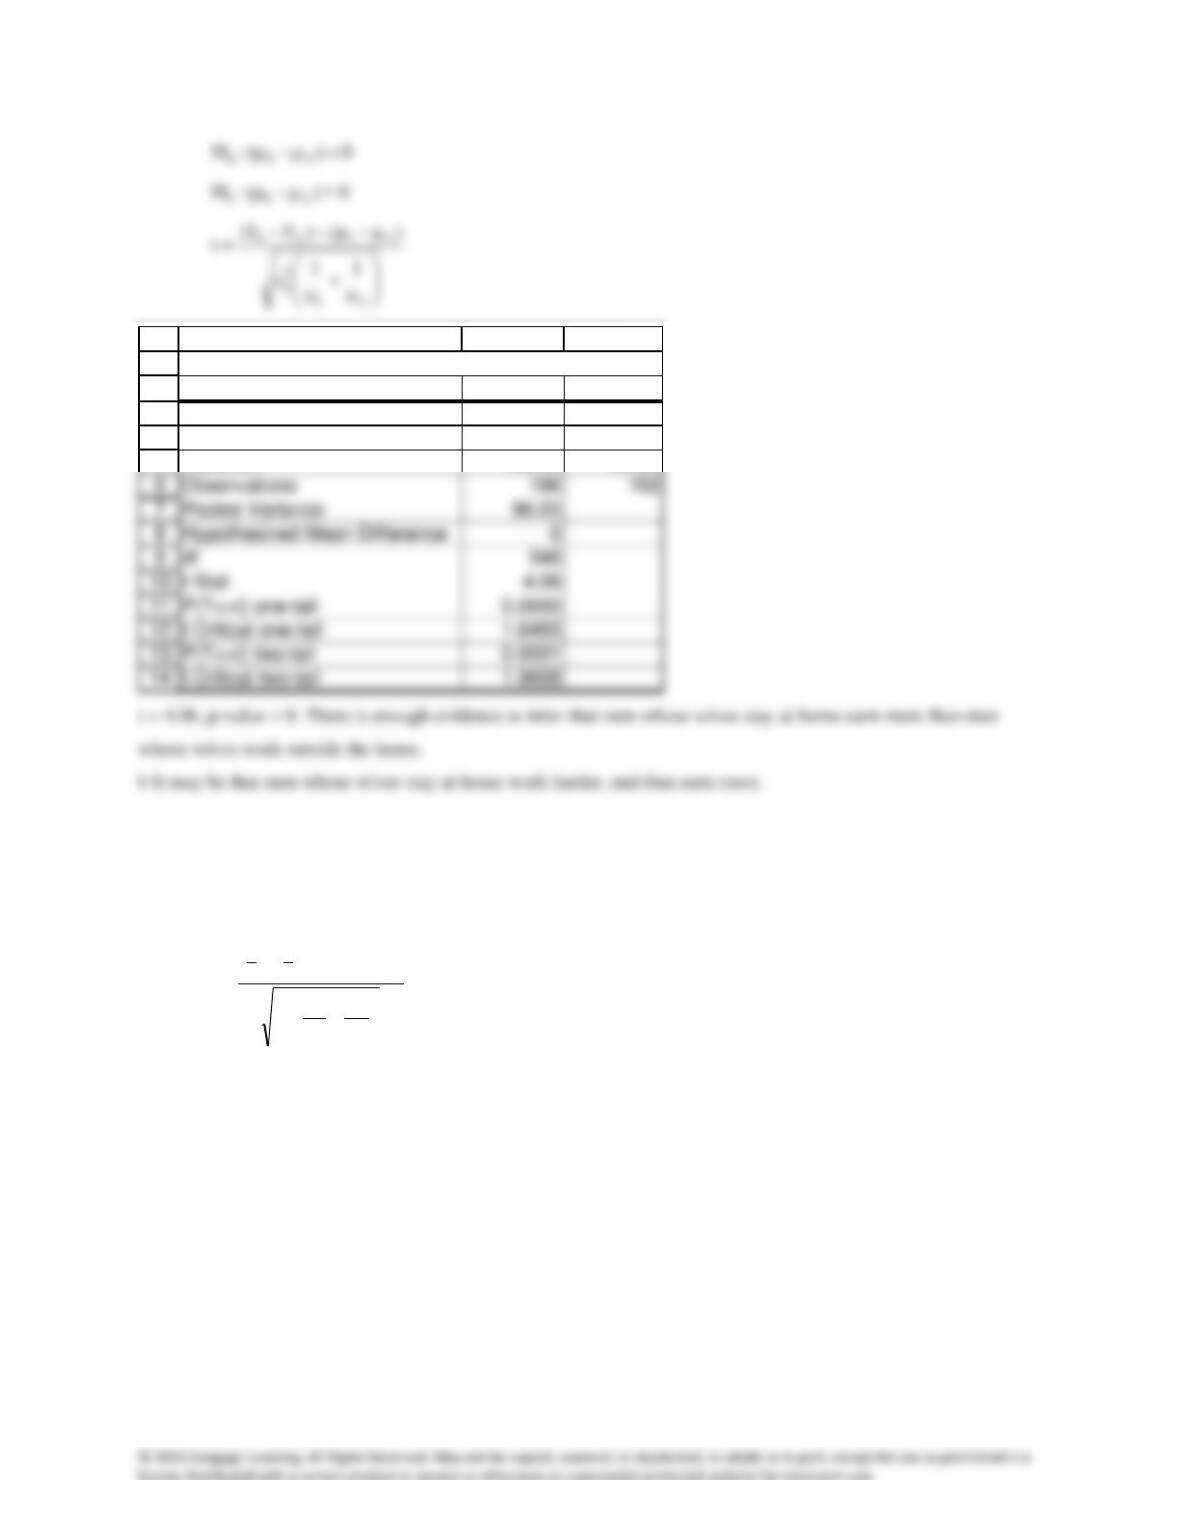
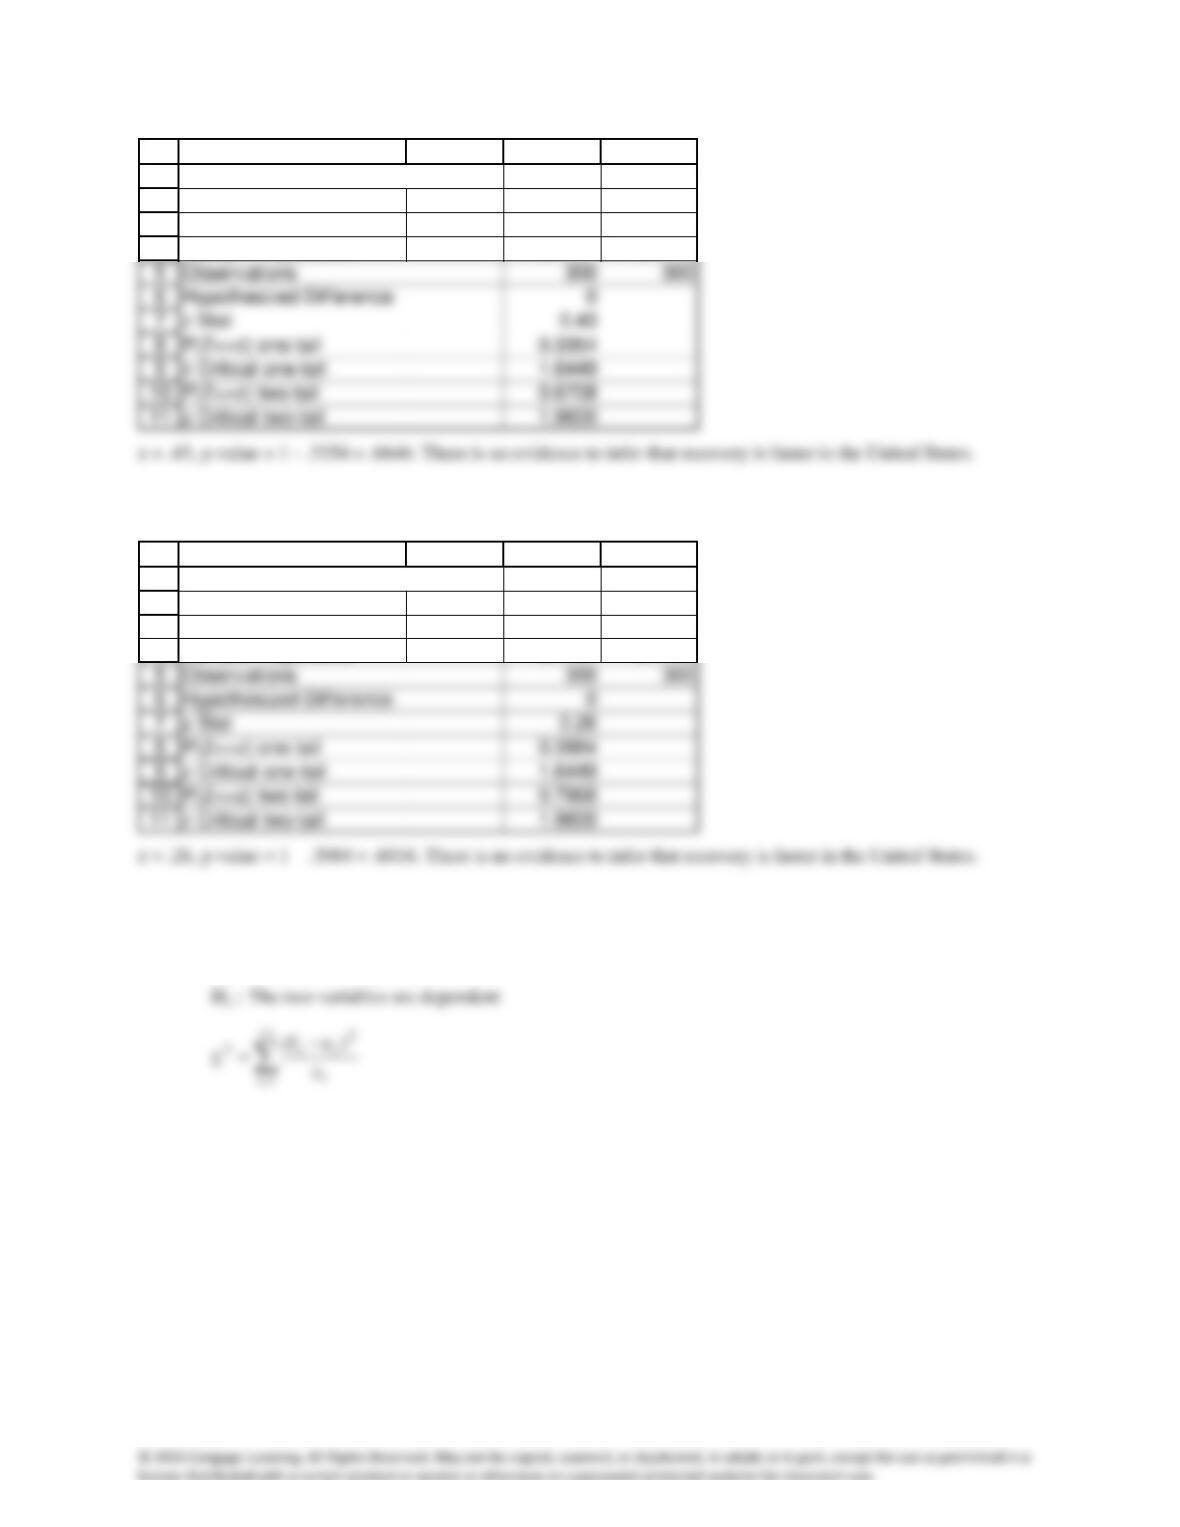
t = –4.00, p-value = 0. There is enough evidence to indicate that recovery is faster in the United States.
Question 2: z-tests of
21 pp −
(case 1)
1
2
3
4
A B C D
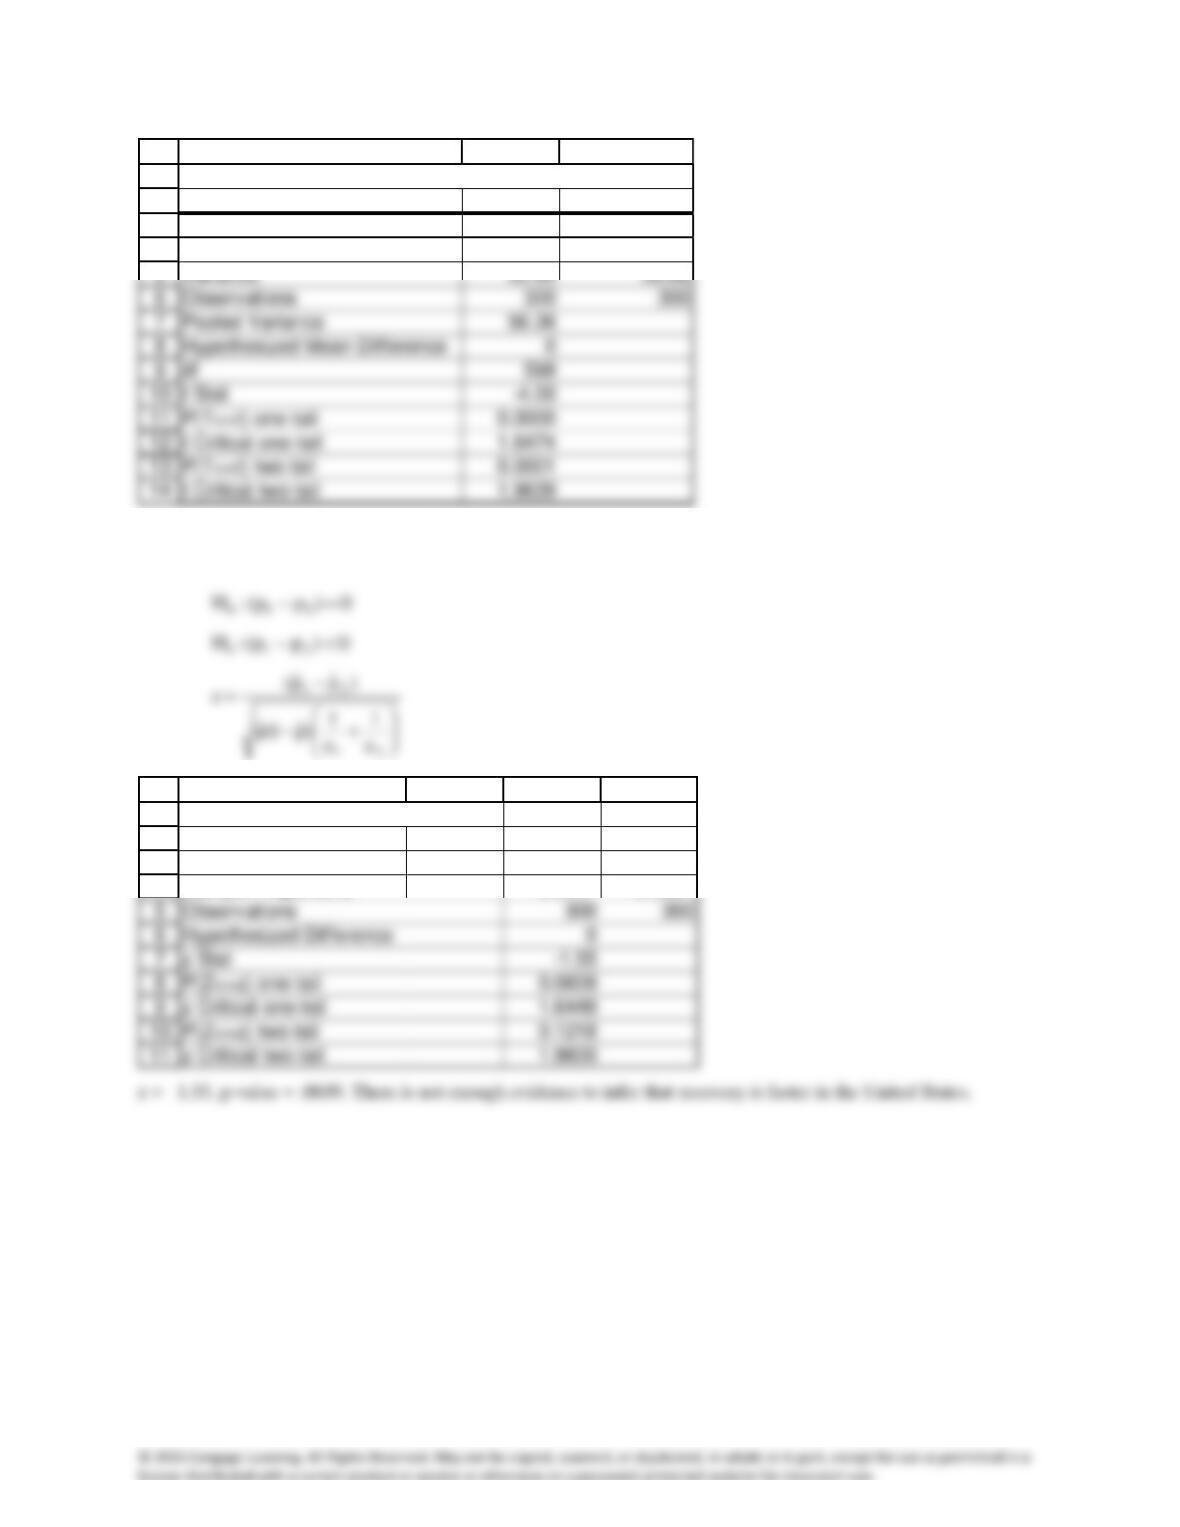
z-Test: Two Proportions
U.S. Canada
Sample Proportions 0.6267 0.6867
6 months after heart attack:
1
2
3
4
A B C D
z-Test: Two Proportions
U.S. Canada
Sample Proportions 0.1867 0.1733
12 months after heart attack
1
2
3
4
A B C D
z-Test: Two Proportions
U.S. Canada
Sample Proportions 0.1167 0.1100
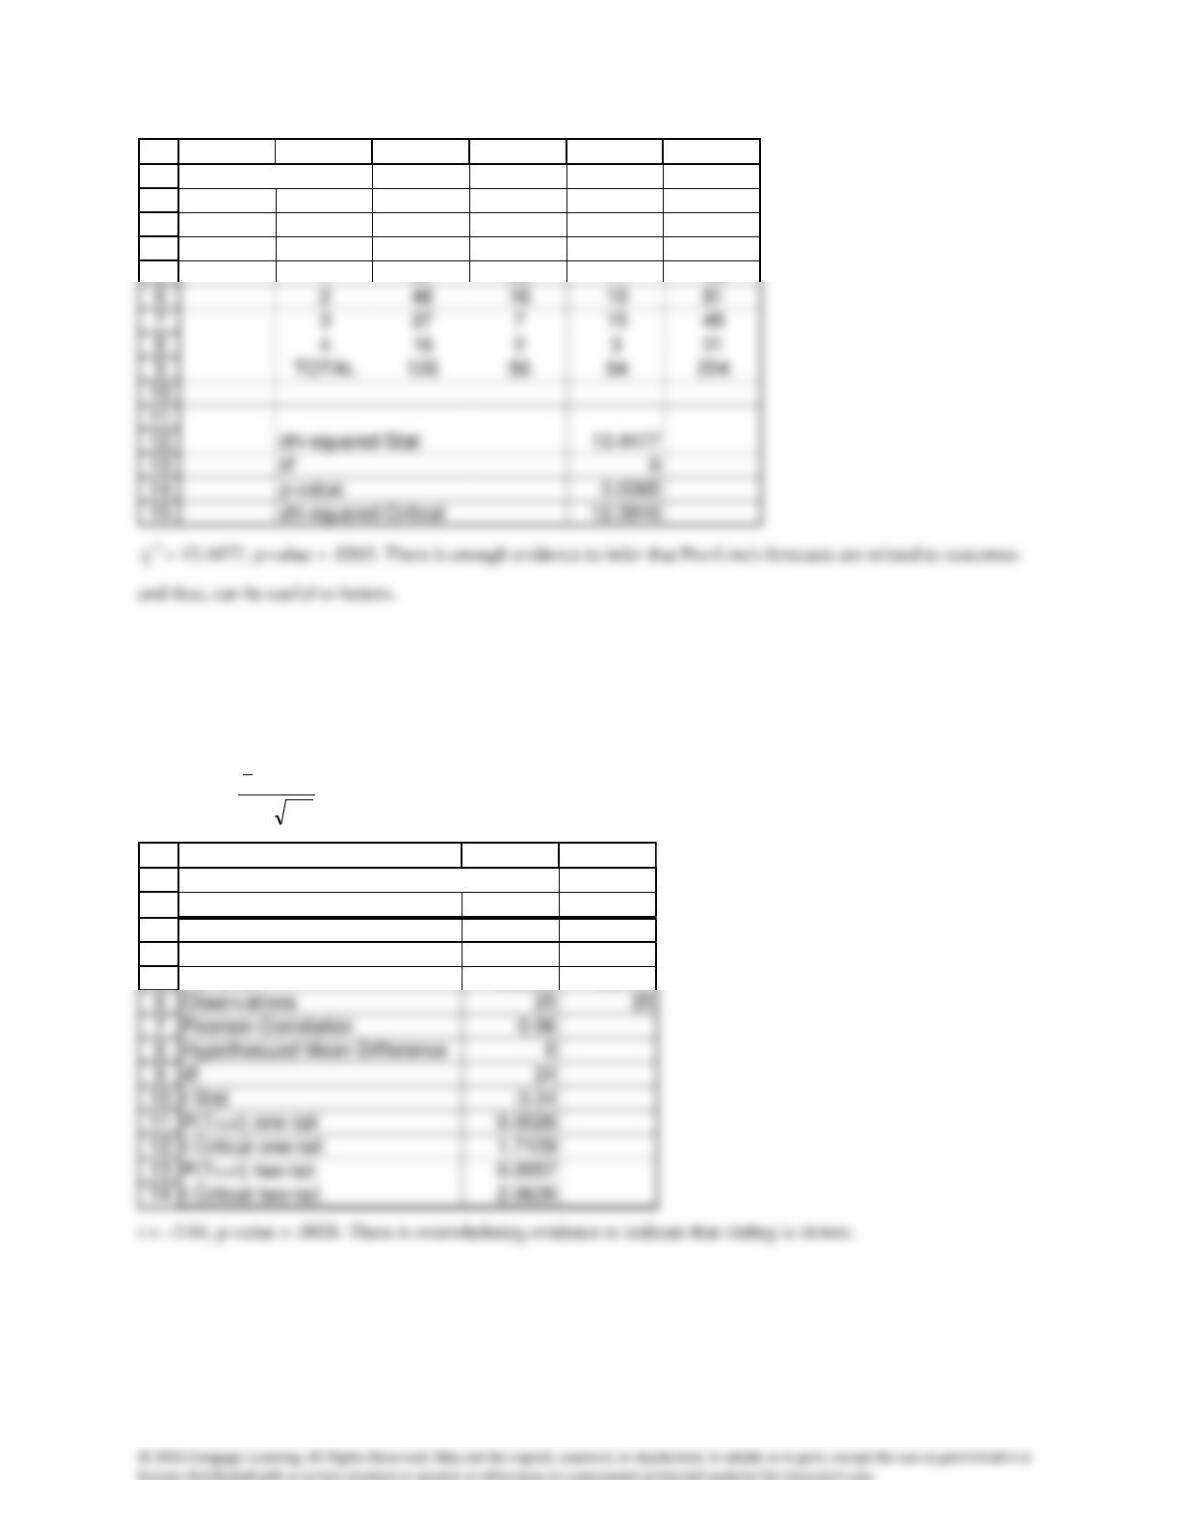
A16.7 Chi-squared test of a contingency table
:H0
The two variables are independent
1
2
3
4
5
A B C D E F
Contingency Table
Favored
Result 1 2 3 TOTAL
131 25 17 73
A16.8 t-test of
D
D0 :H
= 0
D1 :H
< 0
DD
DD
n/s
x
t−
=
1
2
3
4
5
A B C
t-Test: Paired Two Sample for Means
No-Slide Slide
Mean 3.73 3.78
Variance 0.0653 0.0727
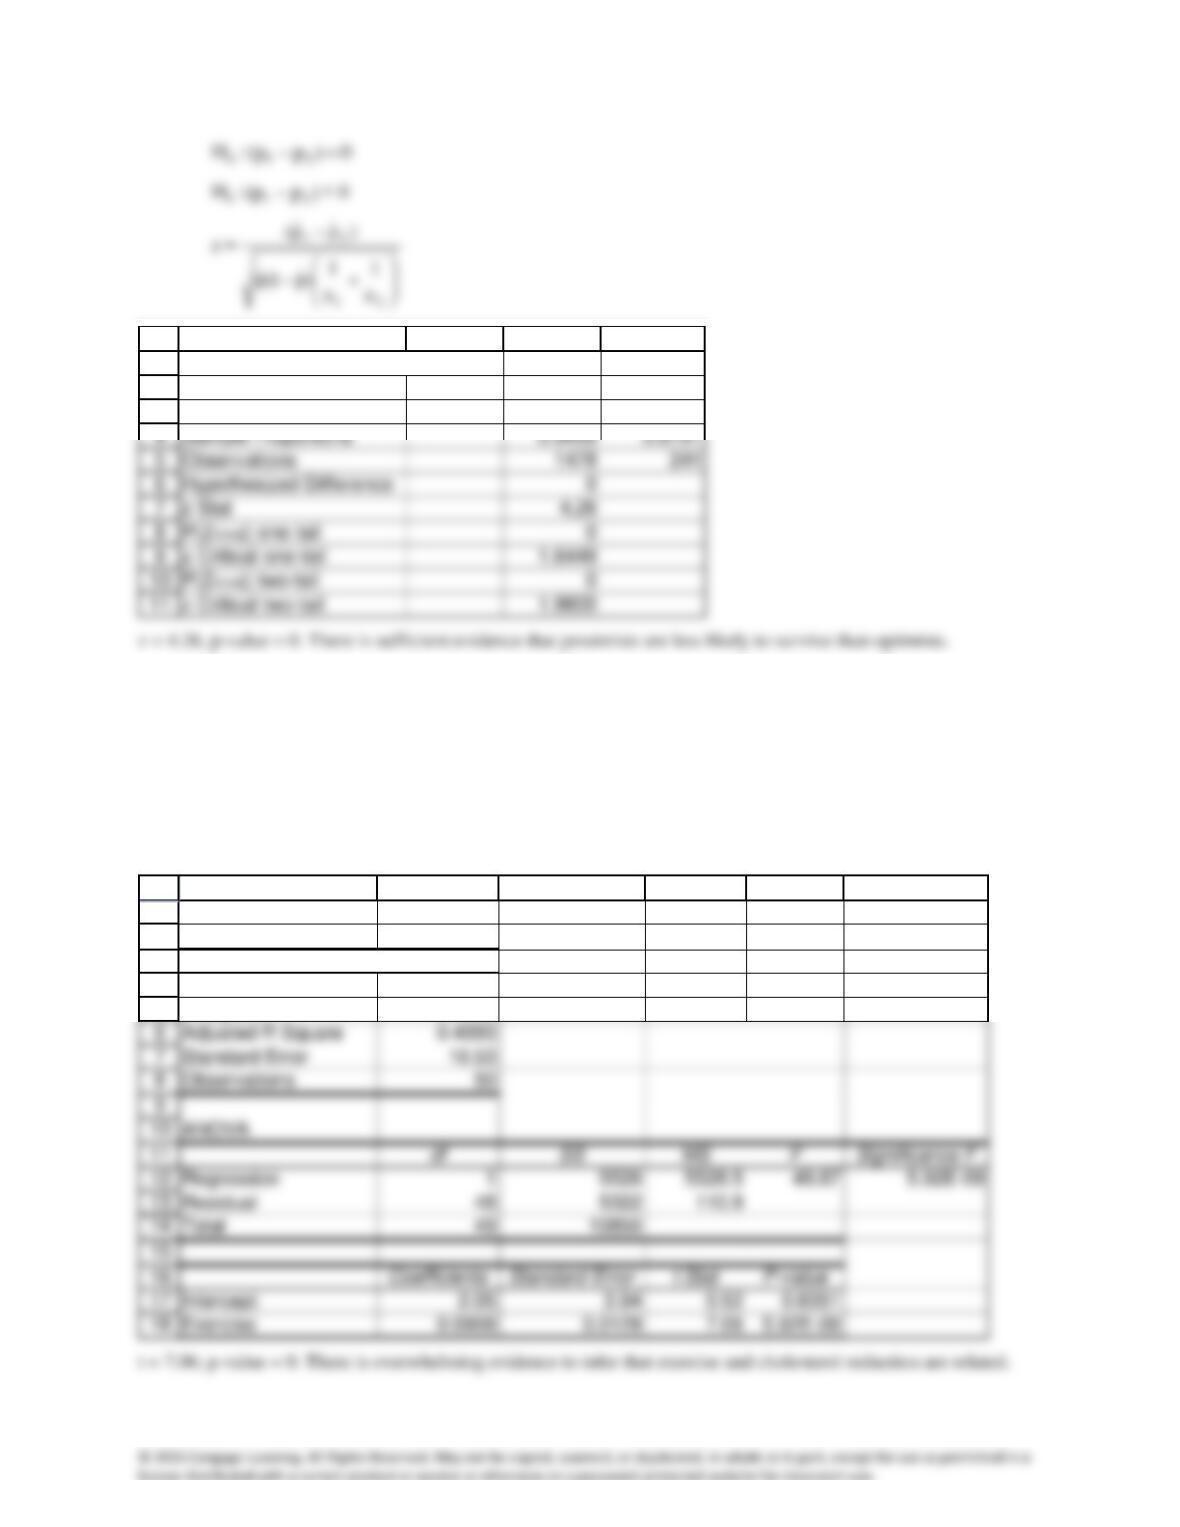
A16.9 z-test of
21 pp −
(case 1) (The data were unstacked prior to applying the z-test.)
1
2
3
A B C D
z-Test: Two Proportions
Optimist Pessimist
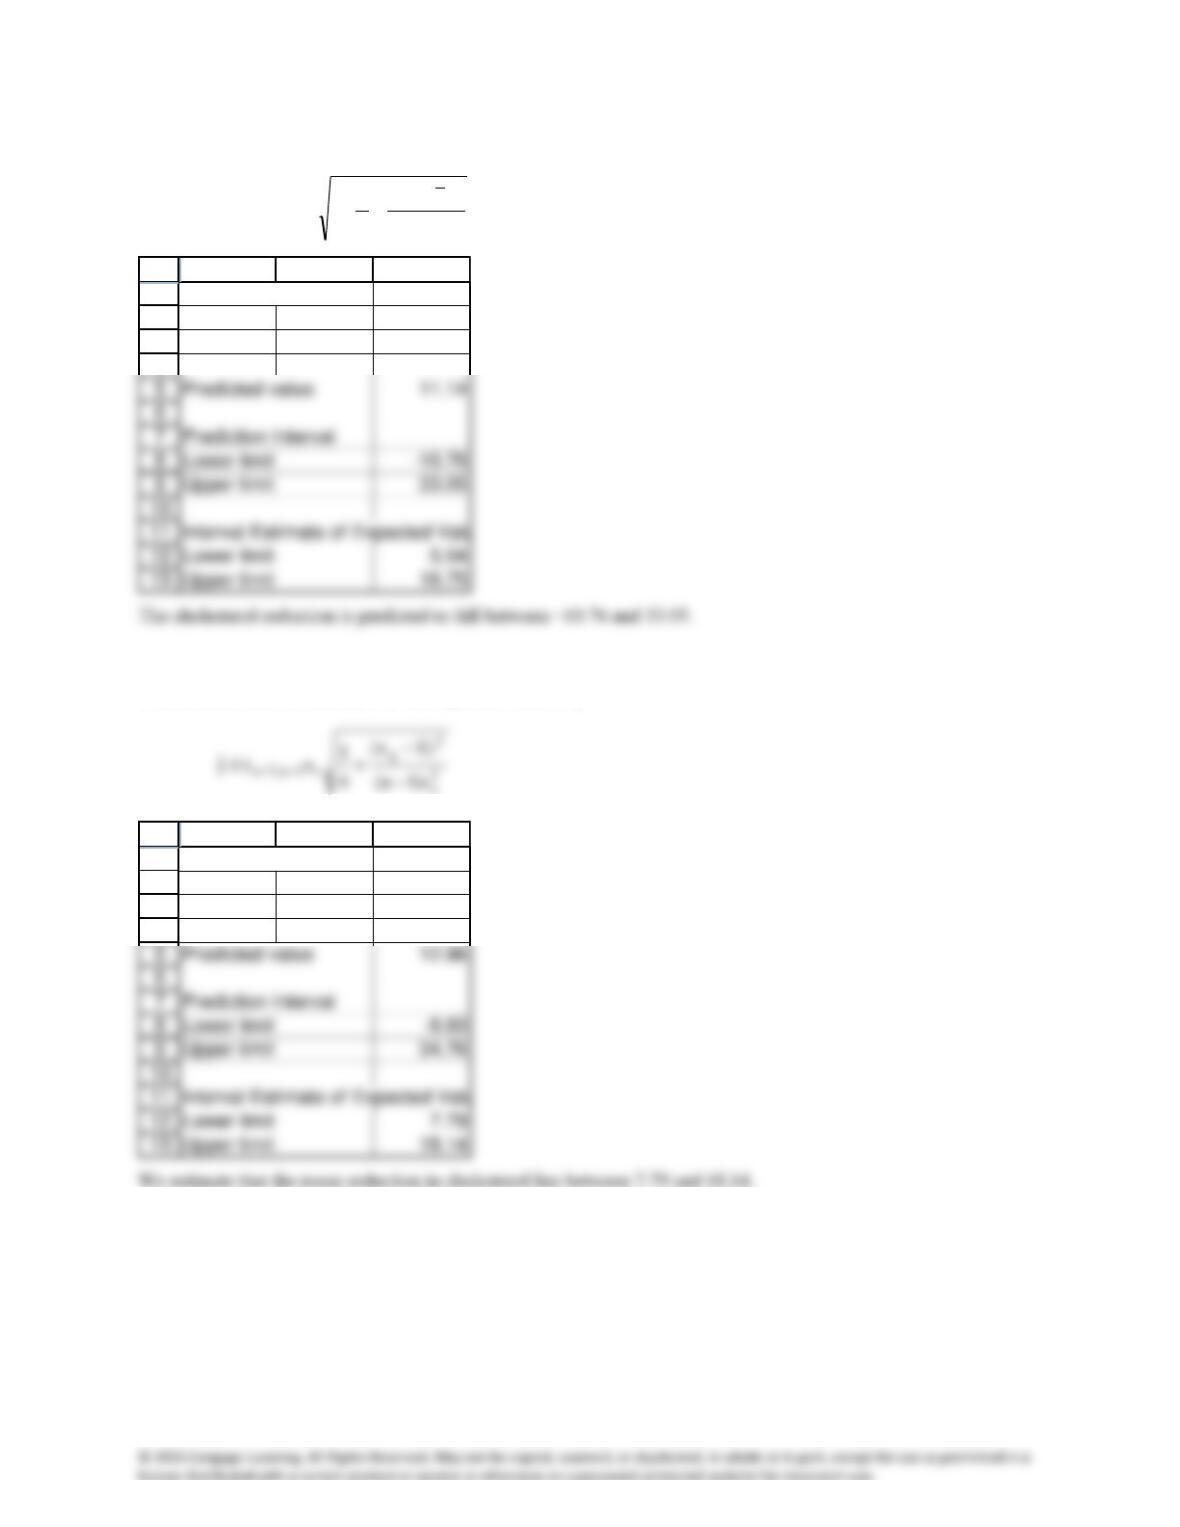
A16.10 Simple linear regression with cholesterol reduction (Before – After) as the dependent variable
a t-test of β1 or test of ρ
0:H 10 =
0:H 11
We used the t-test of β1 because parts (b) and (c) use the regression equation to predict and estimate.
1
2
3
4
5
A B C D E F
SUMMARY OUTPUT
Regression Statistics
Multiple R 0.7138
R Square 0.5095
b. Prediction interval
2
x
2
g
2n,2/ s)1n(
)xx(
n
1
1sty
ˆ−
−
++ −
1
2
3
4
A B C
Prediction Interval
Reduction
c Confidence interval estimator of the expected value of y
1
2
3
4
A B C
Prediction Interval
Reduction
A16.11 Instructors: Unequal-variances t-test of
21 −
0)(:H 210 =−
)(:H 211 −
< 0
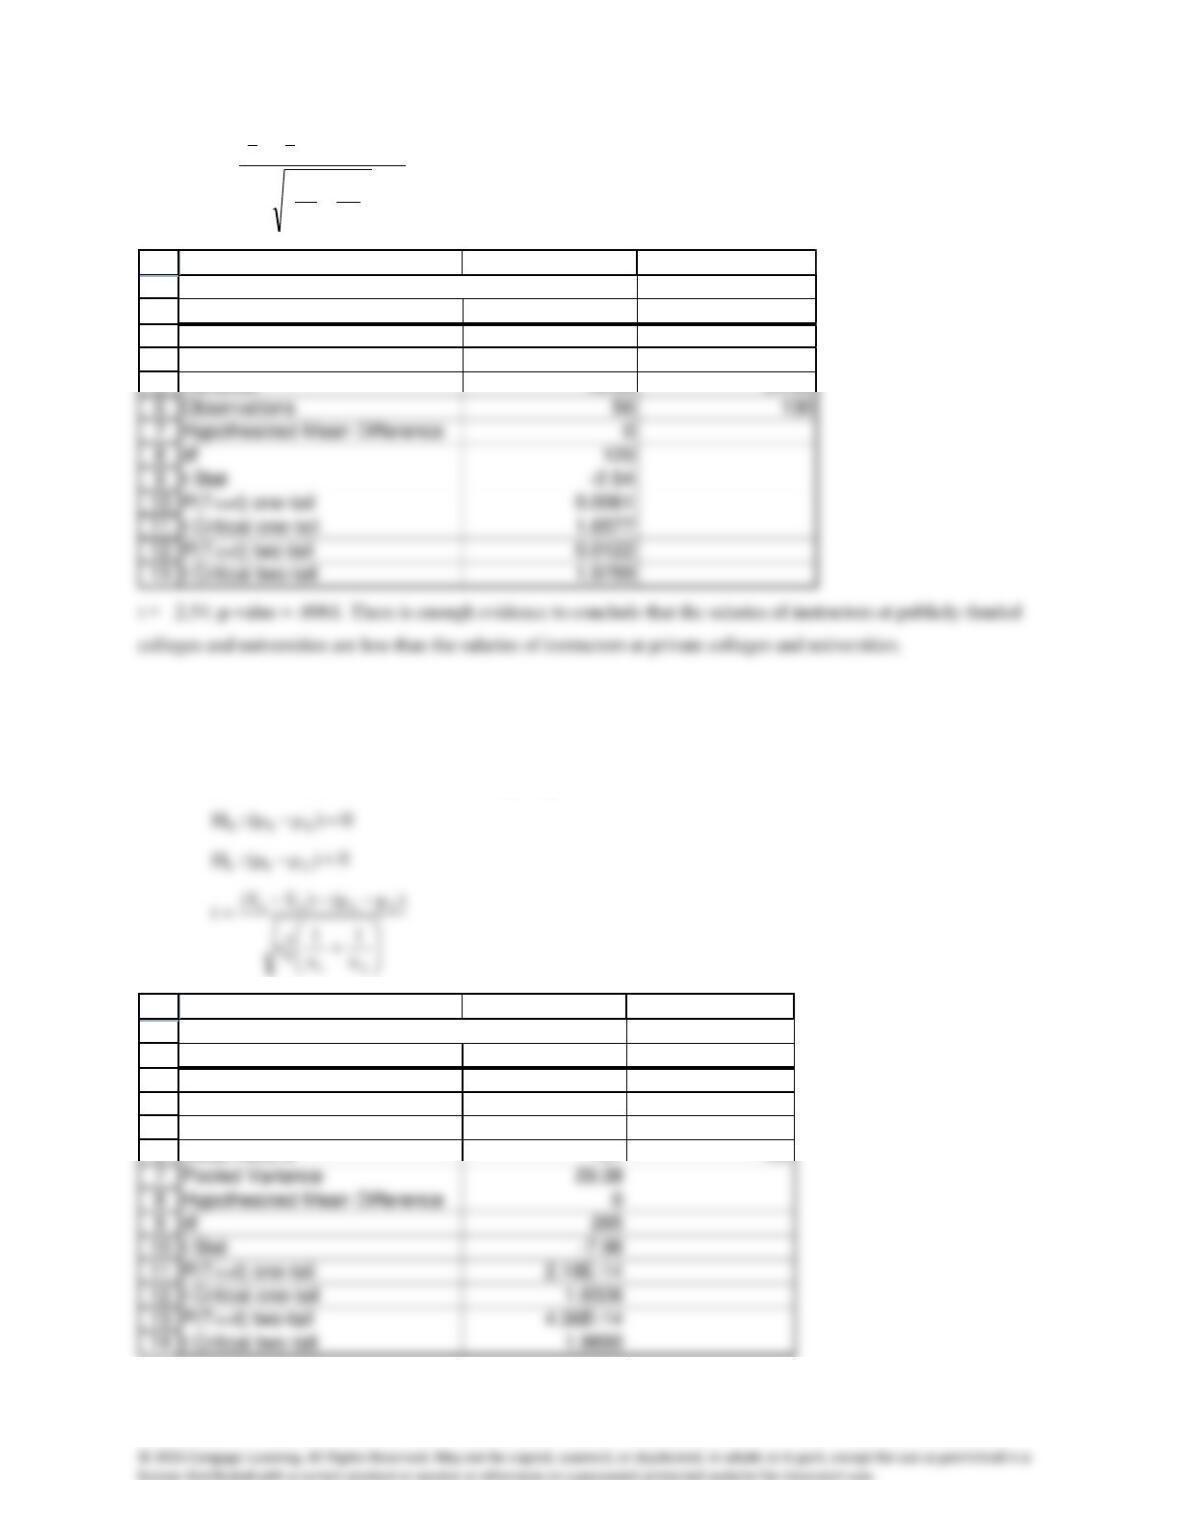
+
−−−
=
2
2
2
1
2
1
2121
n
s
n
s
)()xx(
t
1
2
3
4
5
A B C
t-Test: Two-Sample Assuming Unequal Variances
Public-Instructors Private-Instructors
Mean 39.40 41.23
Variance 18.38 24.66
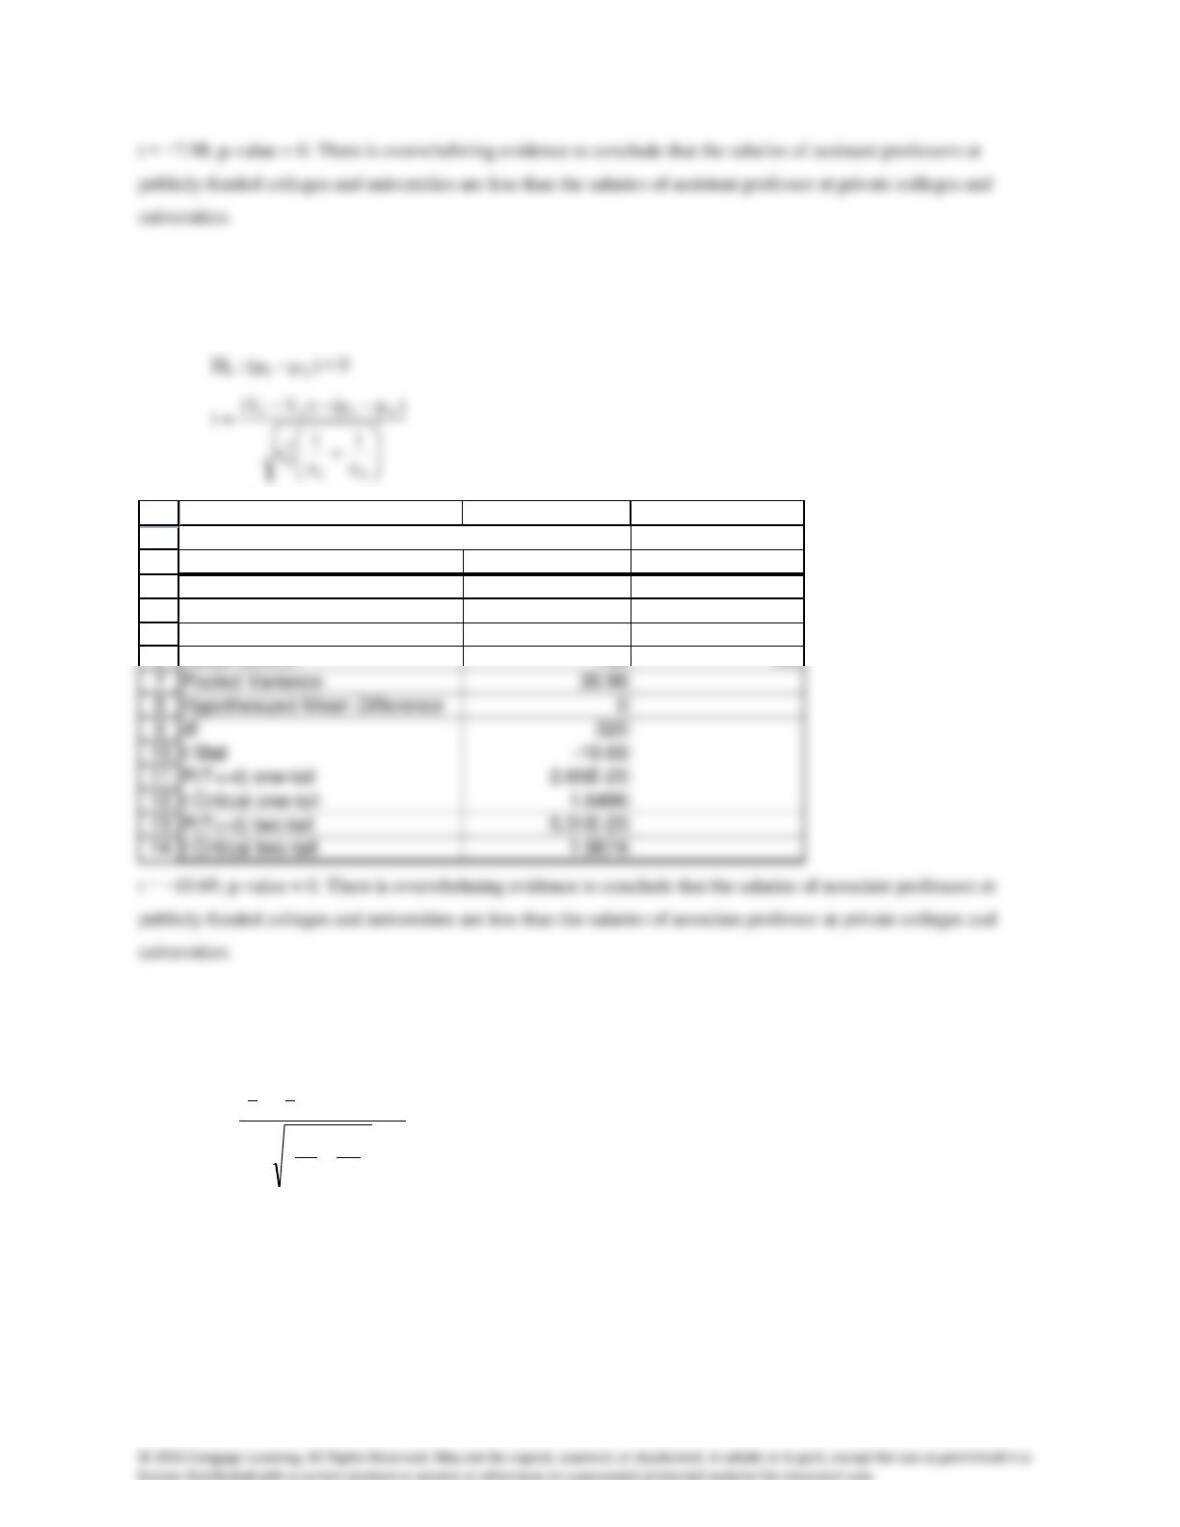
Assistant professors: Equal-variances t-test of
21 −
1
2
3
4
5
6
A B C
t-Test: Two-Sample Assuming Equal Variances
Public-Assistant Private-Assistant
Mean 54.08 59.37
Variance 26.10 32.84
Observations 137 130
Associate professors: Equal-variances t-test of
21 −
0)(:H 210 =−
)(:H 211 −
1
2
3
4
5
6
A B C
t-Test: Two-Sample Assuming Equal Variances
Public-Associate Private-Associate
Mean 64.45 71.07
Variance 30.96 30.96
Observations 162 160
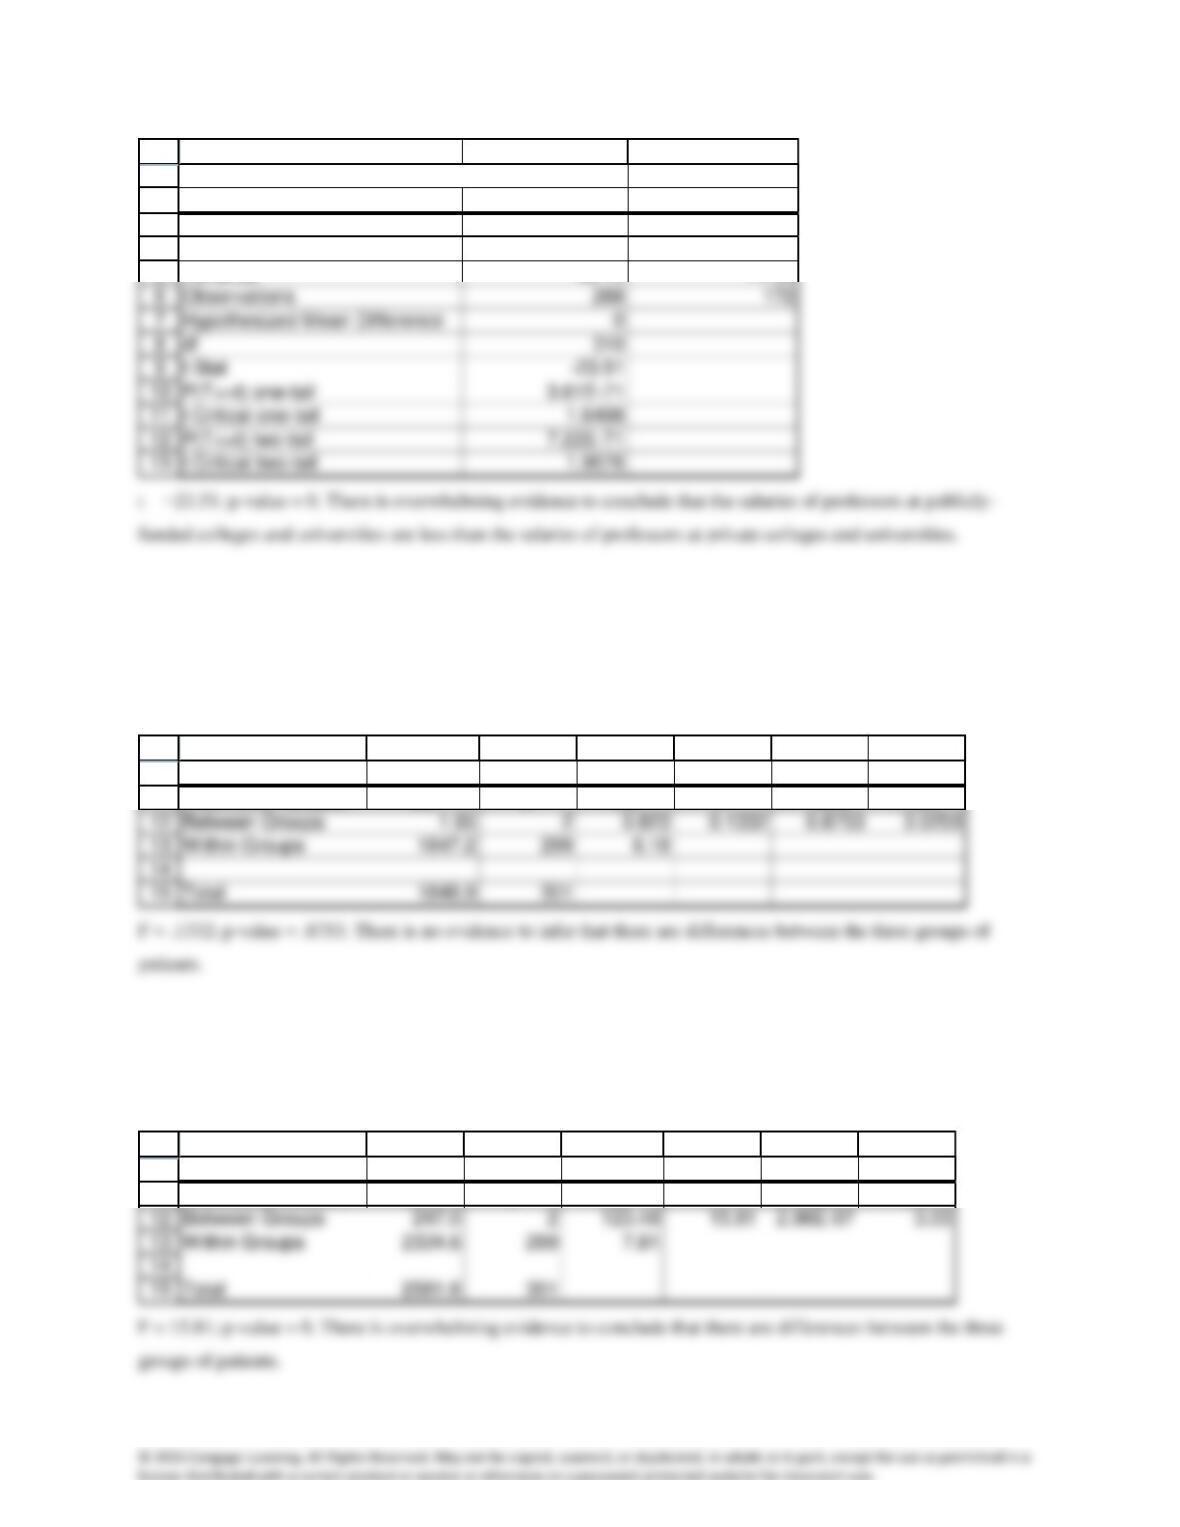
Professors: Unequal-variances t-test of
21 −
0)(:H 210 =−
)(:H 211 −
< 0
+
−−−
=
2
2
2
1
2
1
2121
n
s
n
s
)()xx(
t
1
2
3
4
5
A B C
t-Test: Two-Sample Assuming Unequal Variances
Public-Professor Private-Professor
Mean 88.89 107.39
Variance 49.14 74.99
A16.12a One-way analysis of variance
:H0
321 ==
:H1
At least two means differ
10
15
11
A B C D E F G
ANOVA
Source of Variation SS df MS F P-value F crit
b One-way analysis of variance
:H0
321 ==
:H1
At least two means differ
10
15
11
A B C D E F G
ANOVA
Source of Variation SS df MS F P-value F crit
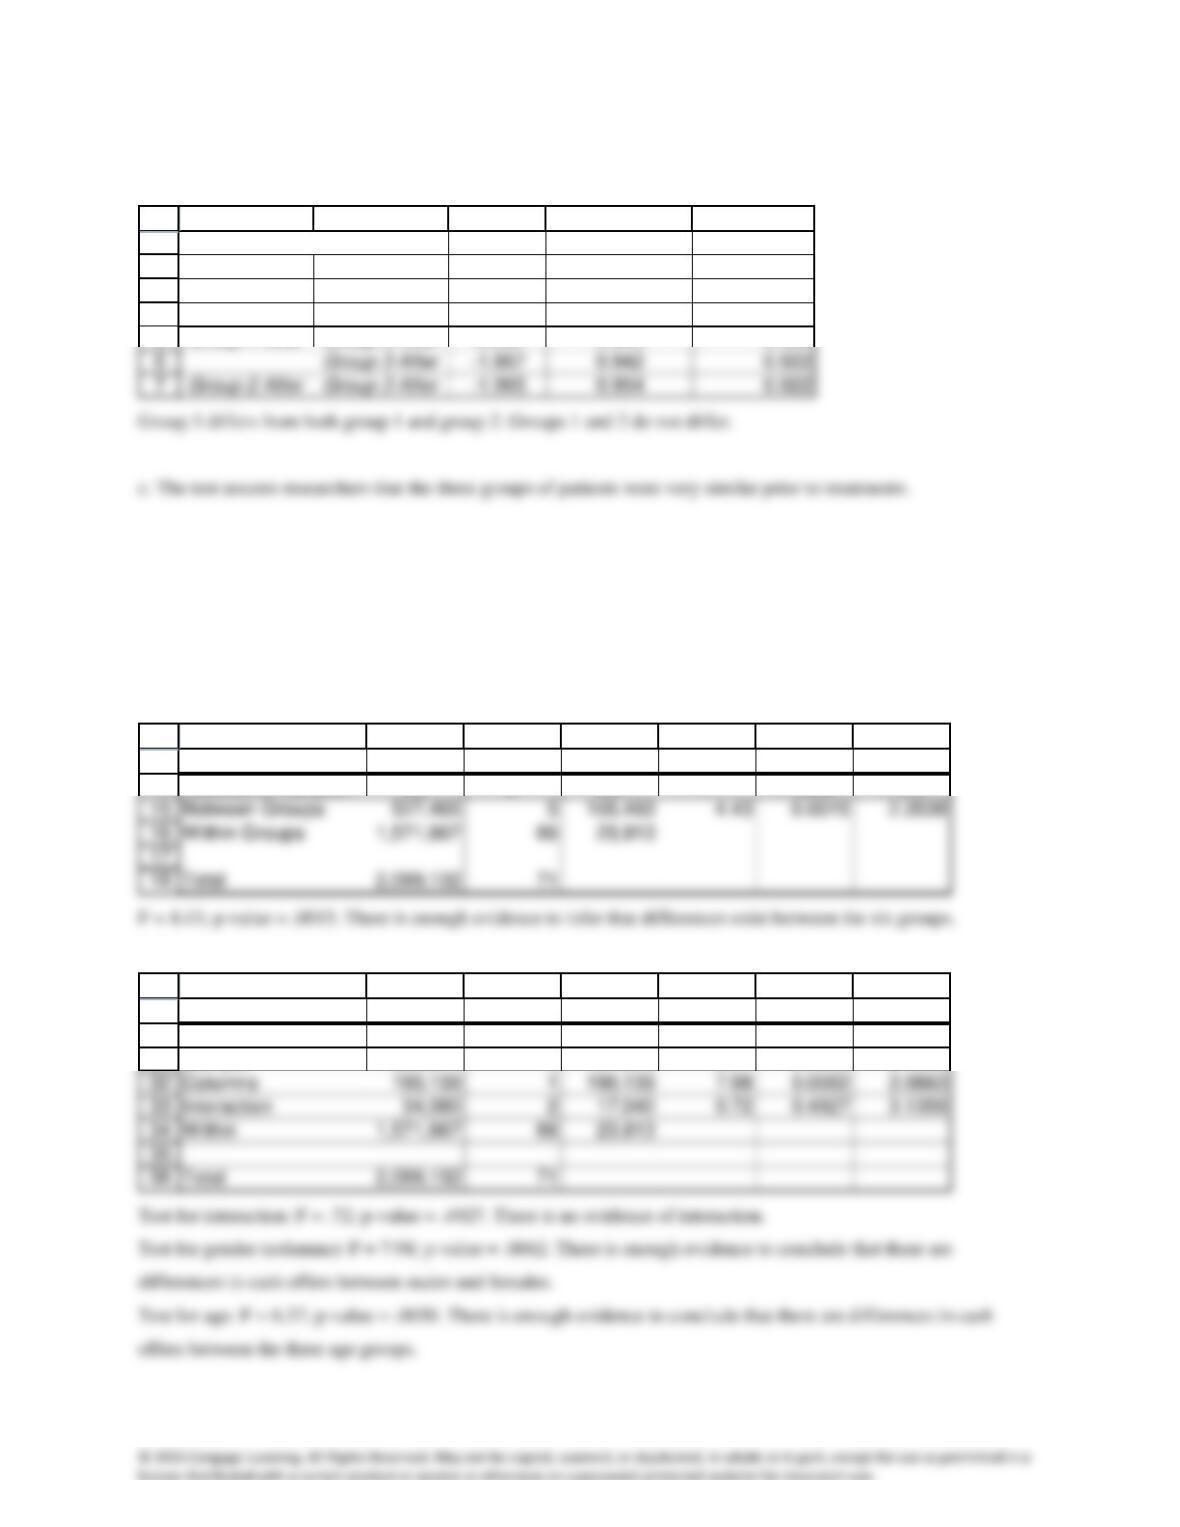
Multiple comparisons
1
2
3
4
5
A B C D E
Multiple Comparisons
LSD Omega
Treatment Treatment Difference Alpha = 0.0167 Alpha = 0.05
Group 1 After Group 2 After 0.099 0.949 0.922
A16.13 a. One-way analysis of variance
:H0
654321 =====
:H1
At least two means differ
13
18
14
A B C D E F G
ANOVA
Source of Variation SS df MS F P-value F crit
b. Two-factor analysis of variance
29
36
30
31
A B C D E F G
ANOVA
Source of Variation SS df MS F P-value F crit
Sample 303,247 2151,623 6.37 0.0030 3.1359
A16.14 a Chi-squared test of a contingency table
:H0
The two variables (year and party) are independent
:H1
1
2
3
4
A B C D E F
Contingency Table
1990 1996 2000 2004 TOTAL
Democrats
154 161 159 152 626
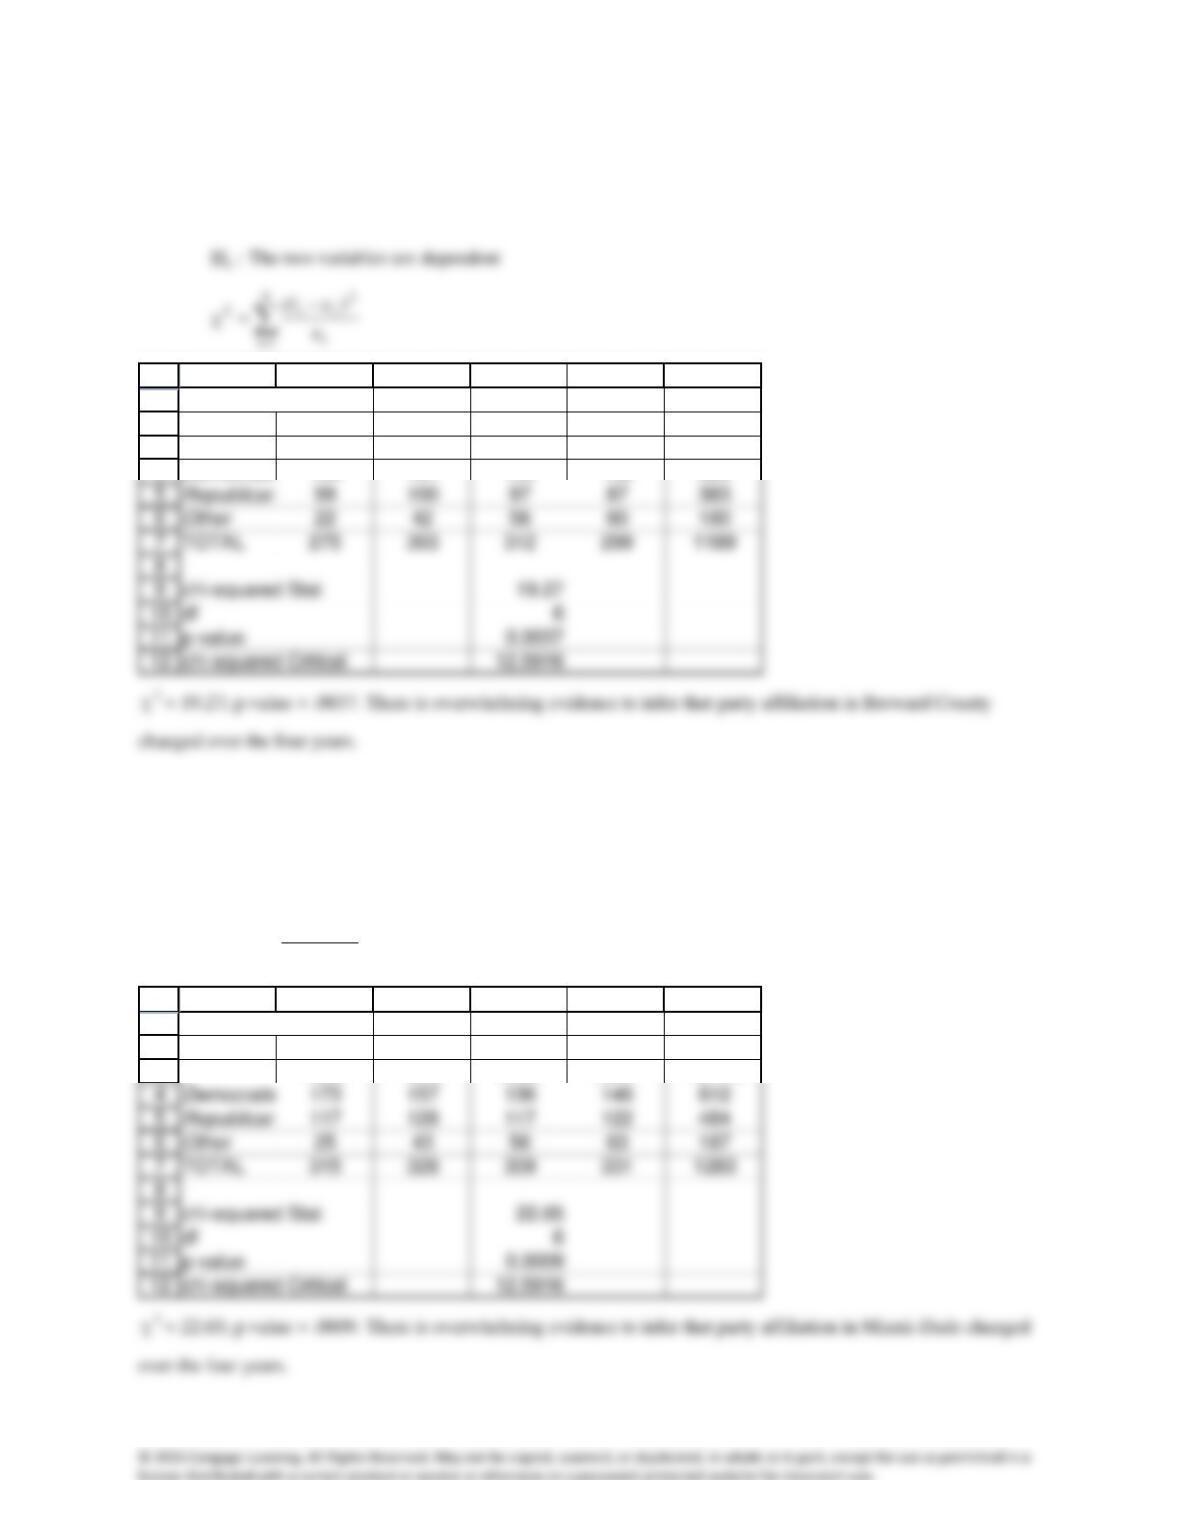
b Chi-squared test of a contingency table
:H0
The two variables (year and party) are independent
:H1
The two variables are dependent
=
−
=
8
1i i
2
ii
2
e
)ef(
4
Democrats
173 157 136 146 612
1
2
3
A B C D E F
Contingency Table
1990 1996 2000 2004 TOTAL