CHAPTER 3: GRAPHICAL DESCRIPTIVE TECHNIQUES II
TRUE/FALSE
1. The intervals (classes) in a histogram do not overlap.
2. The intervals (classes) in a histogram are equally wide.
3. In a histogram, each observation is assigned to one or more classes.
4. The number of class intervals in a histogram depends on the number of observations in the data set.
5. A relative frequency distribution describes the proportion of data values that fall within each category.
6. A stem-and-leaf display reveals more information about the original data than does a histogram.
7. The number of observations within each class may be found in a frequency distribution.
8. The advantage of a stem-and-leaf display over a histogram is that we can see the actual observations.
9. According to the stem-and-leaf plot below, the median quiz score for this data set is 8.
Stem-and-leaf of Quiz Score; N = 75
Leaf Unit = 1
9
0
000112333
14
0
56899
21
1
0000123
26
1
66699
33
2
3334445
(8)
2
66677888
34
3
0023344
27
3
56669999
19
4
000122233
10
4
5556667799
10. A cumulative relative frequency distribution lists the number of observations that lie below each of the
class limits.
11. According to the stem-and-leaf plot below, this data set has a negative median.
Stem-and-leaf of P/E ratio; N = 75
Leaf Unit = 0.01
1
−2
6
2
−2
0
5
−1
555
8
−1
420
22
−0
99999887777665
36
−0
44322111111000
(14)
0
01122233333344
25
0
66678889999
14
1
0022222334
4
1
56
2
2
03
12. A histogram represents interval data.
13. A stem-and-leaf display represents nominal data.
14. According to the stem-and-leaf plot below, this data set is symmetric.
Stem-and-leaf of P/E ratio; N = 10
Leaf Unit = 0.10
2
−1
53
4
−0
97
(2)
−0
65
4
0
3
3
0
6
2
1
3
1
1
8
15. When a distribution has more values to the left and tails off to the right, it is skewed negatively.
16. A histogram is said to be symmetric if, when we draw a vertical line down the center of the histogram
the two sides are nearly identical.
17. A skewed histogram is one with a long tail extending either to the right or left.
18. When a distribution has more values to the right and tails to the left, we say it is skewed negatively.
19. The sum of relative frequencies in a distribution always equals 1.
20. The sum of cumulative relative frequencies always equals 1.
21. The original observations cannot be determined once they are grouped into a frequency distribution.
22. A modal class is the class with the largest number of observations.
23. Experience shows that few students hand in their statistics exams early; most prefer to hand them in
near the end of the test period. This means the time taken by students to write exams is positively
skewed.
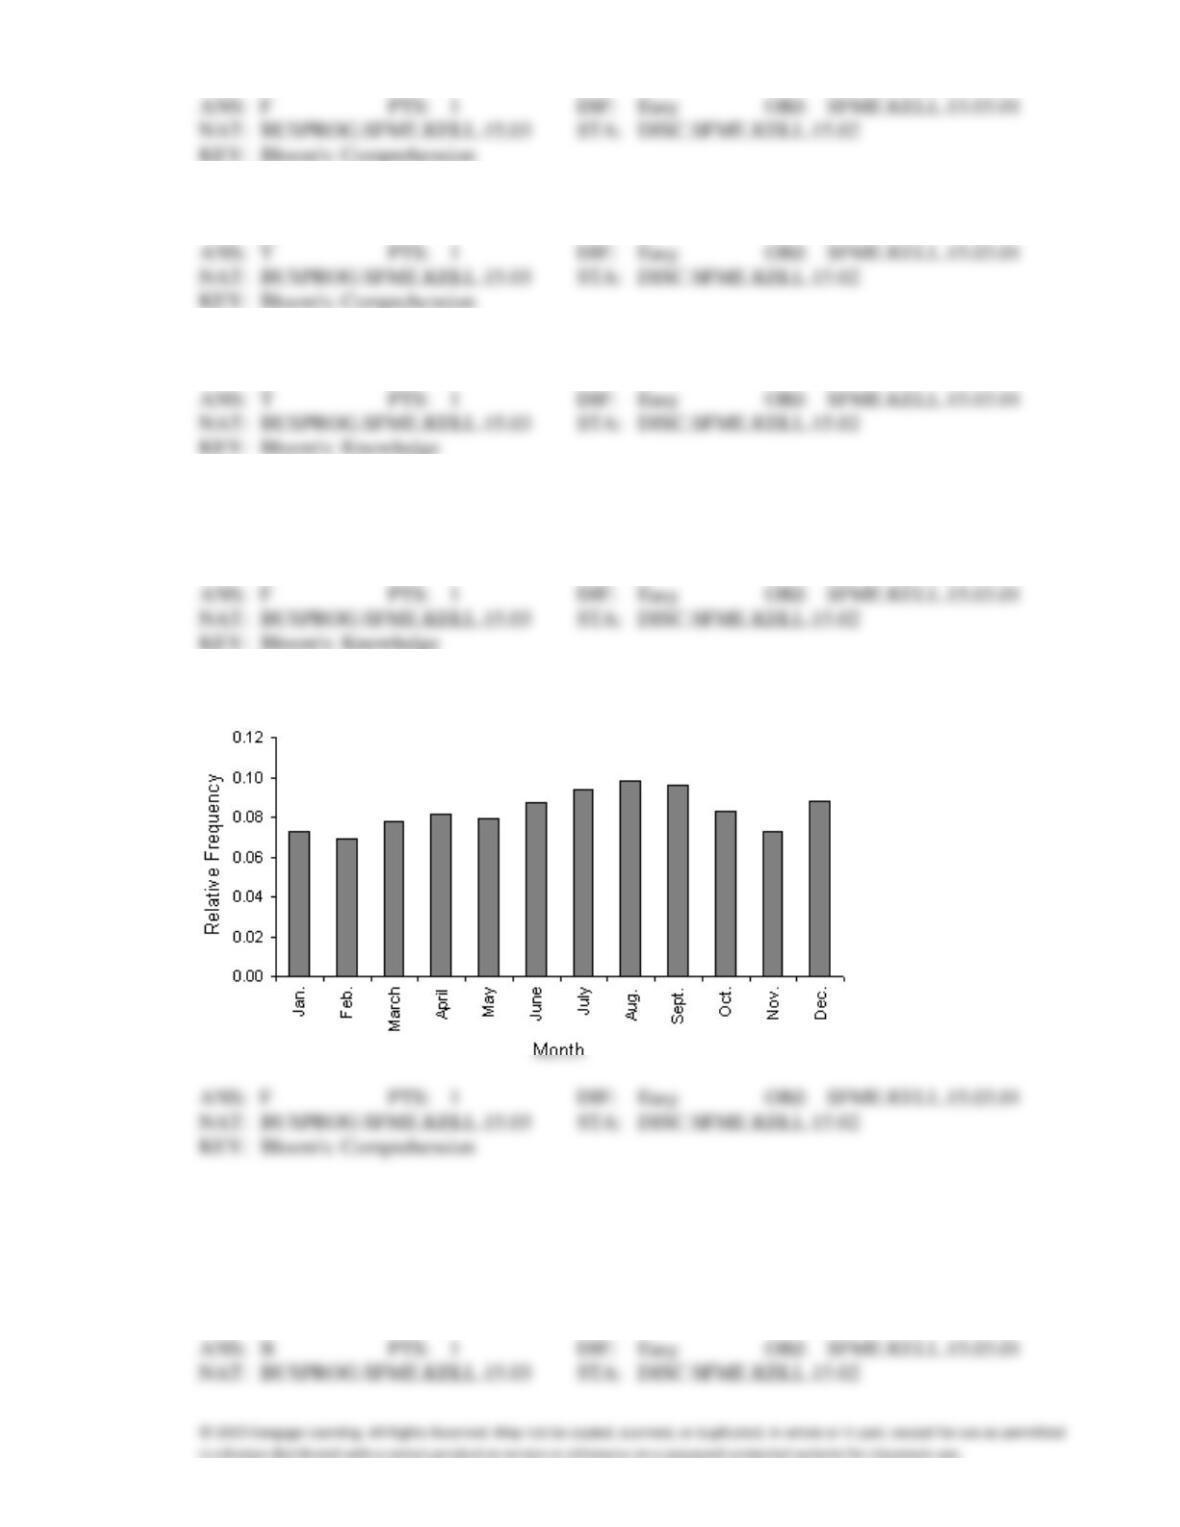
24. The graph below is an example of a histogram.
MULTIPLE CHOICE
1. Which of the following represents a graphical presentation of interval data?
a.
A bar chart.
c.
A pie chart.
b.
A histogram.
d.
All of these choices are true.
2. Which of the following statements about histograms is true?
a.
A histogram is a summary of interval data.
b.
A histogram is made of a series of intervals, called classes.
c.
The classes in a histogram cover the complete range of observations.
d.
All of these choices are true.
3. Which of the following statements about histograms is false?
a.
The intervals of a histogram do not overlap.
b.
Every observation is assigned to one and only one class in a histogram.
c.
The intervals of a histogram are equally wide.
d.
None of these choices.
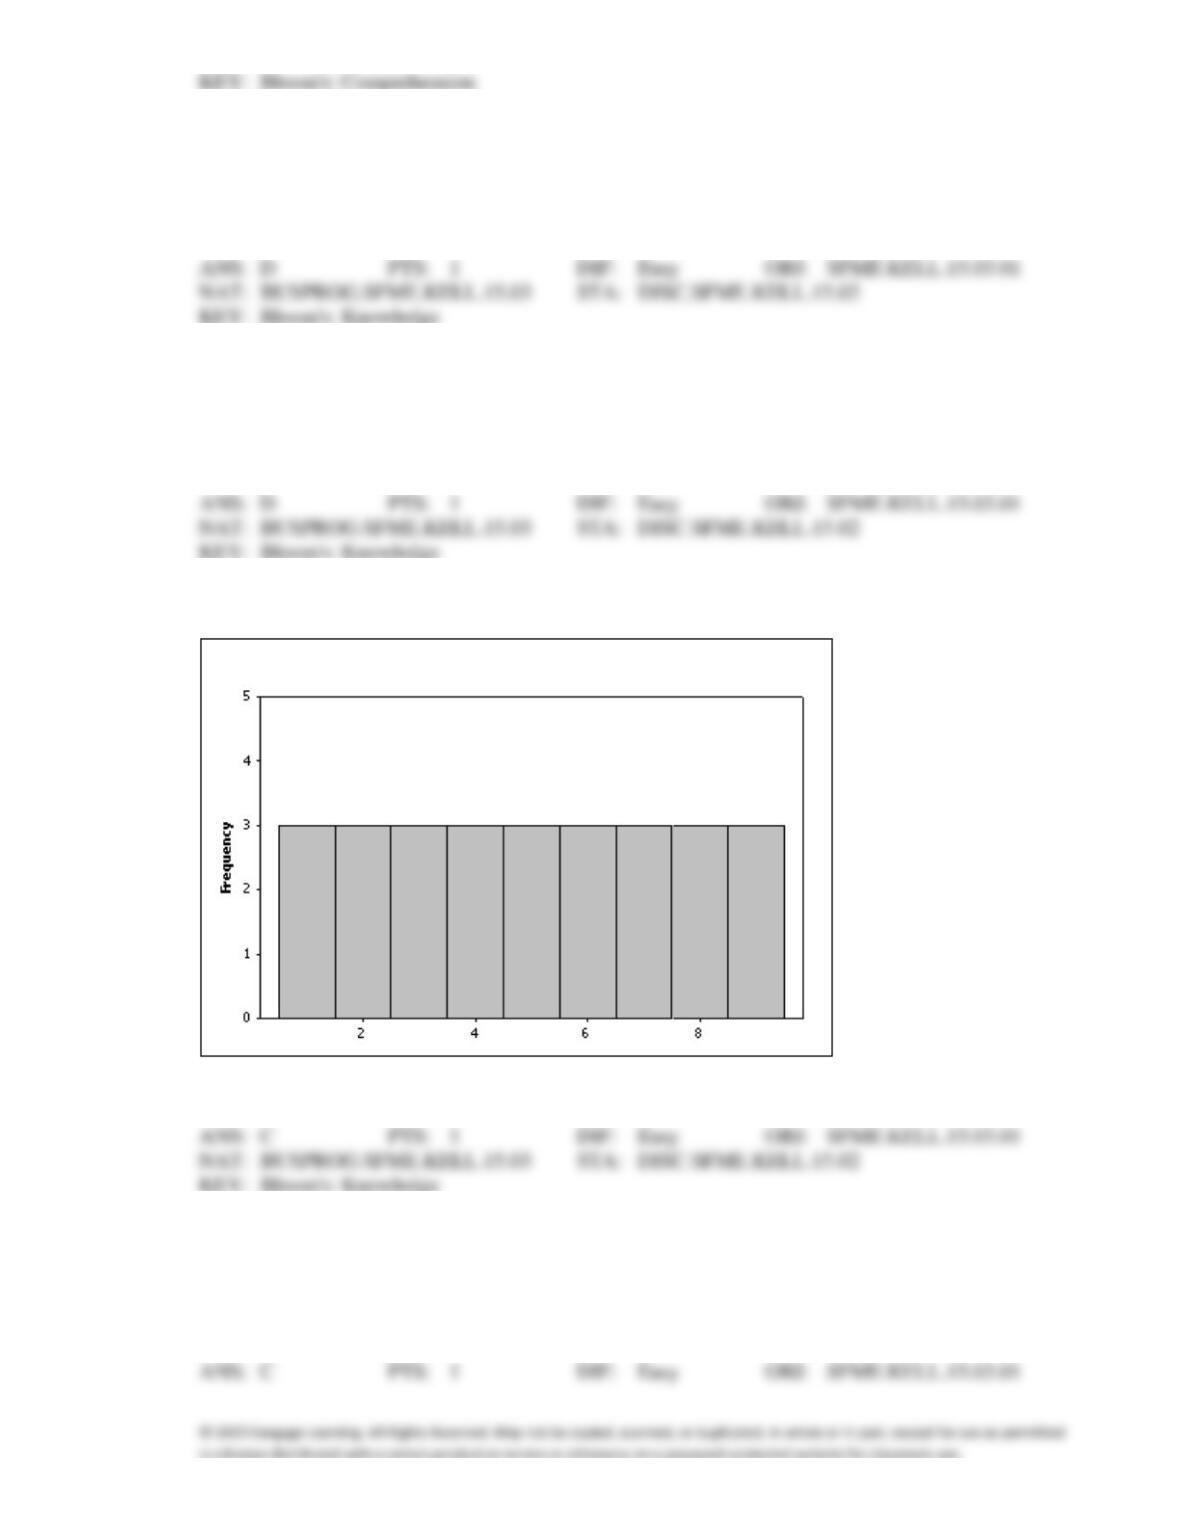
4. Which of the following describes the shape of the histogram below?
a.
Positively skewed
c.
Symmetric
b.
Negatively skewed
d.
None of these choices
5. The relative frequency of a class in a histogram is computed by
a.
dividing the frequency of the class by the number of classes.
b.
dividing the frequency of the class by the class width.
c.
dividing the frequency of the class by the total of all frequencies.
d.
None of these choices.
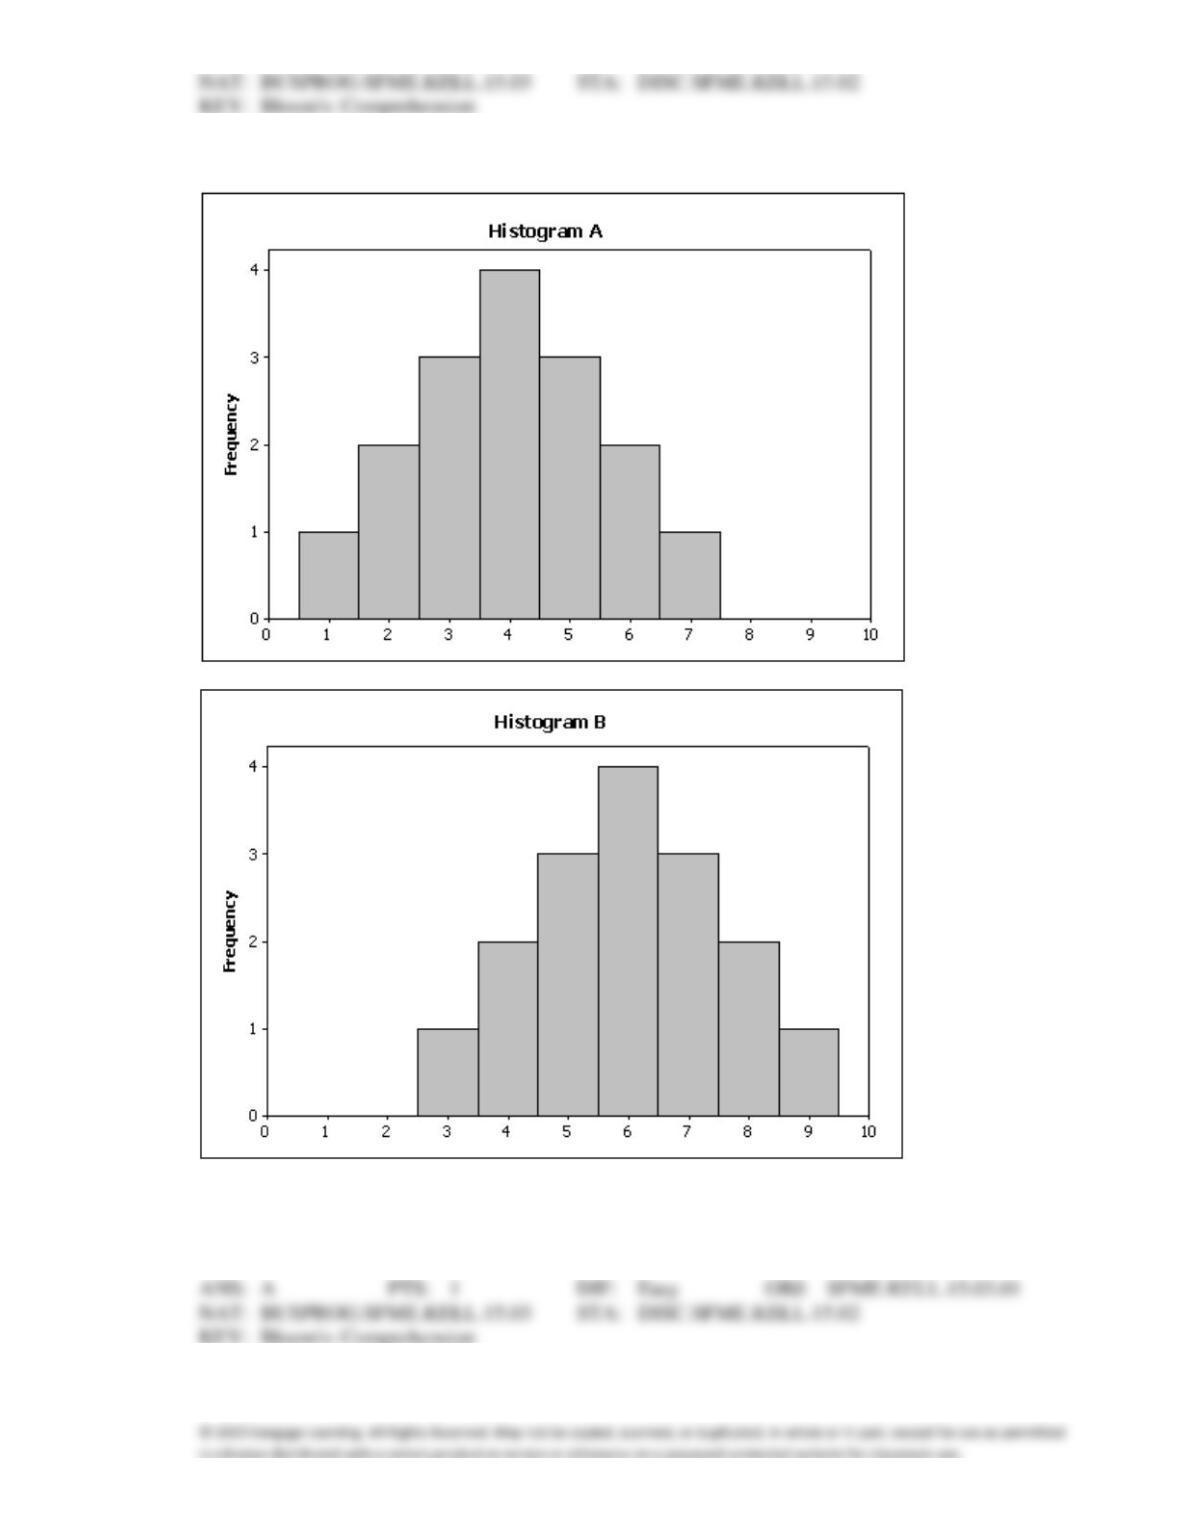
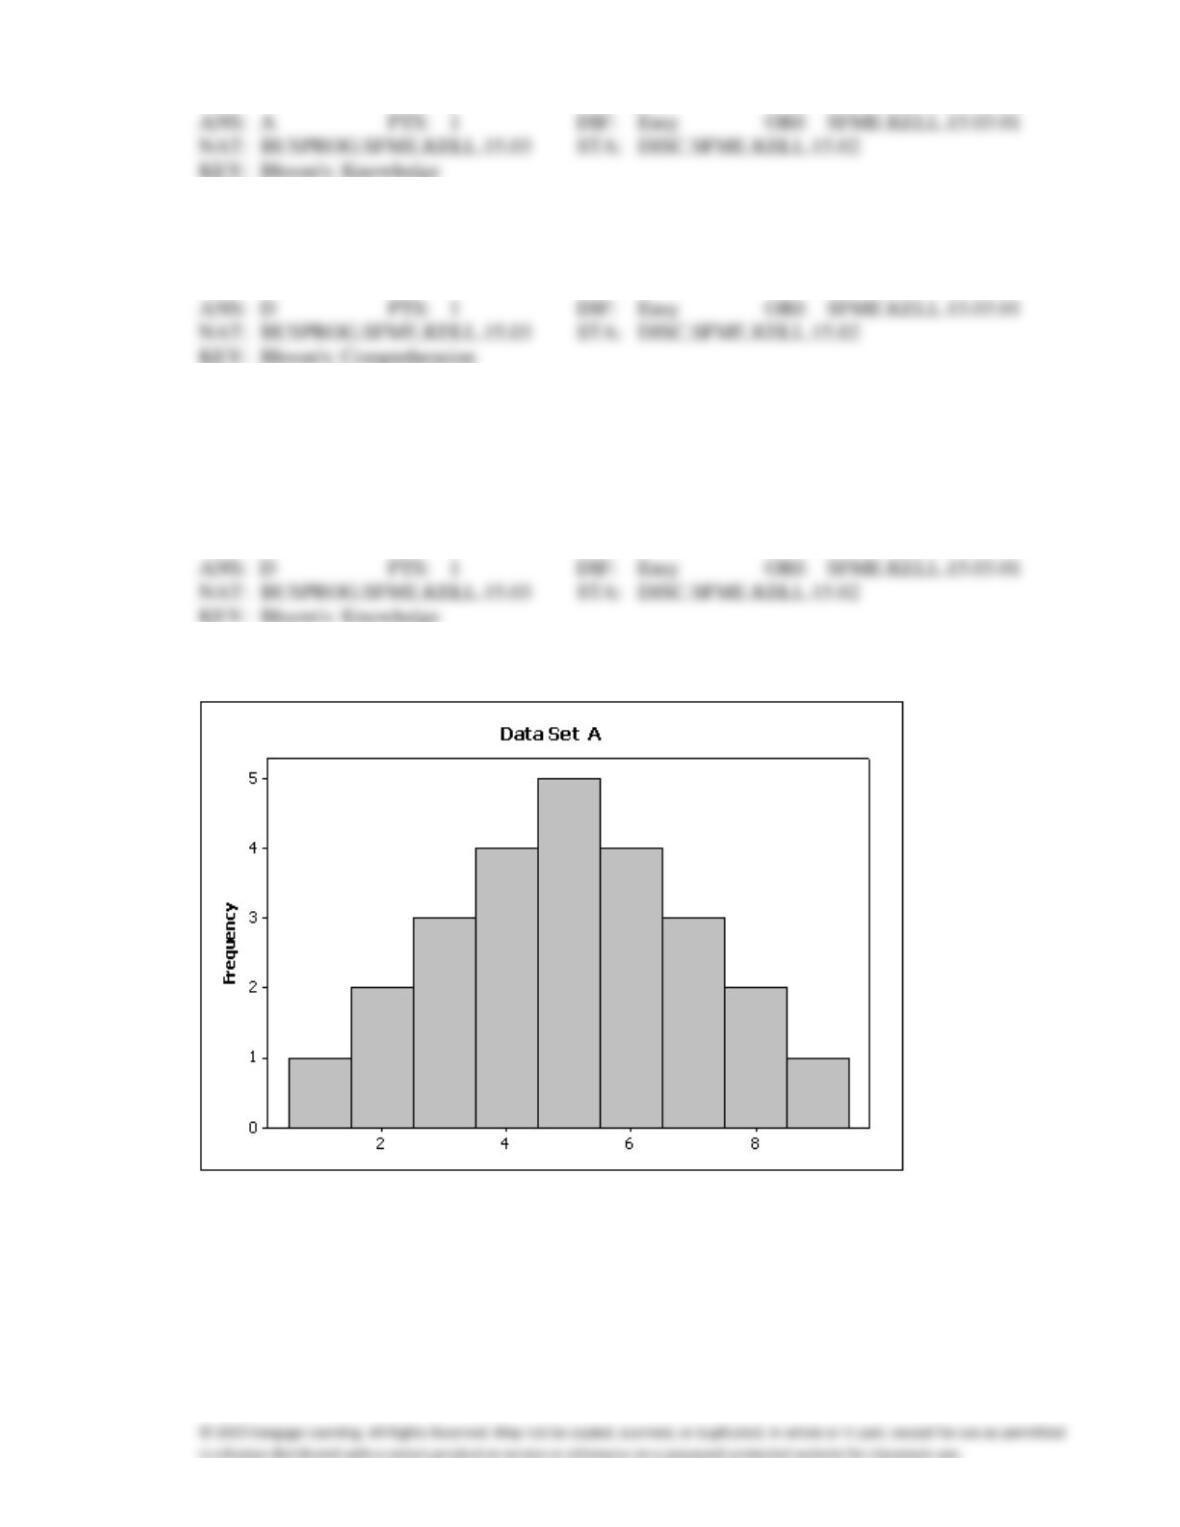
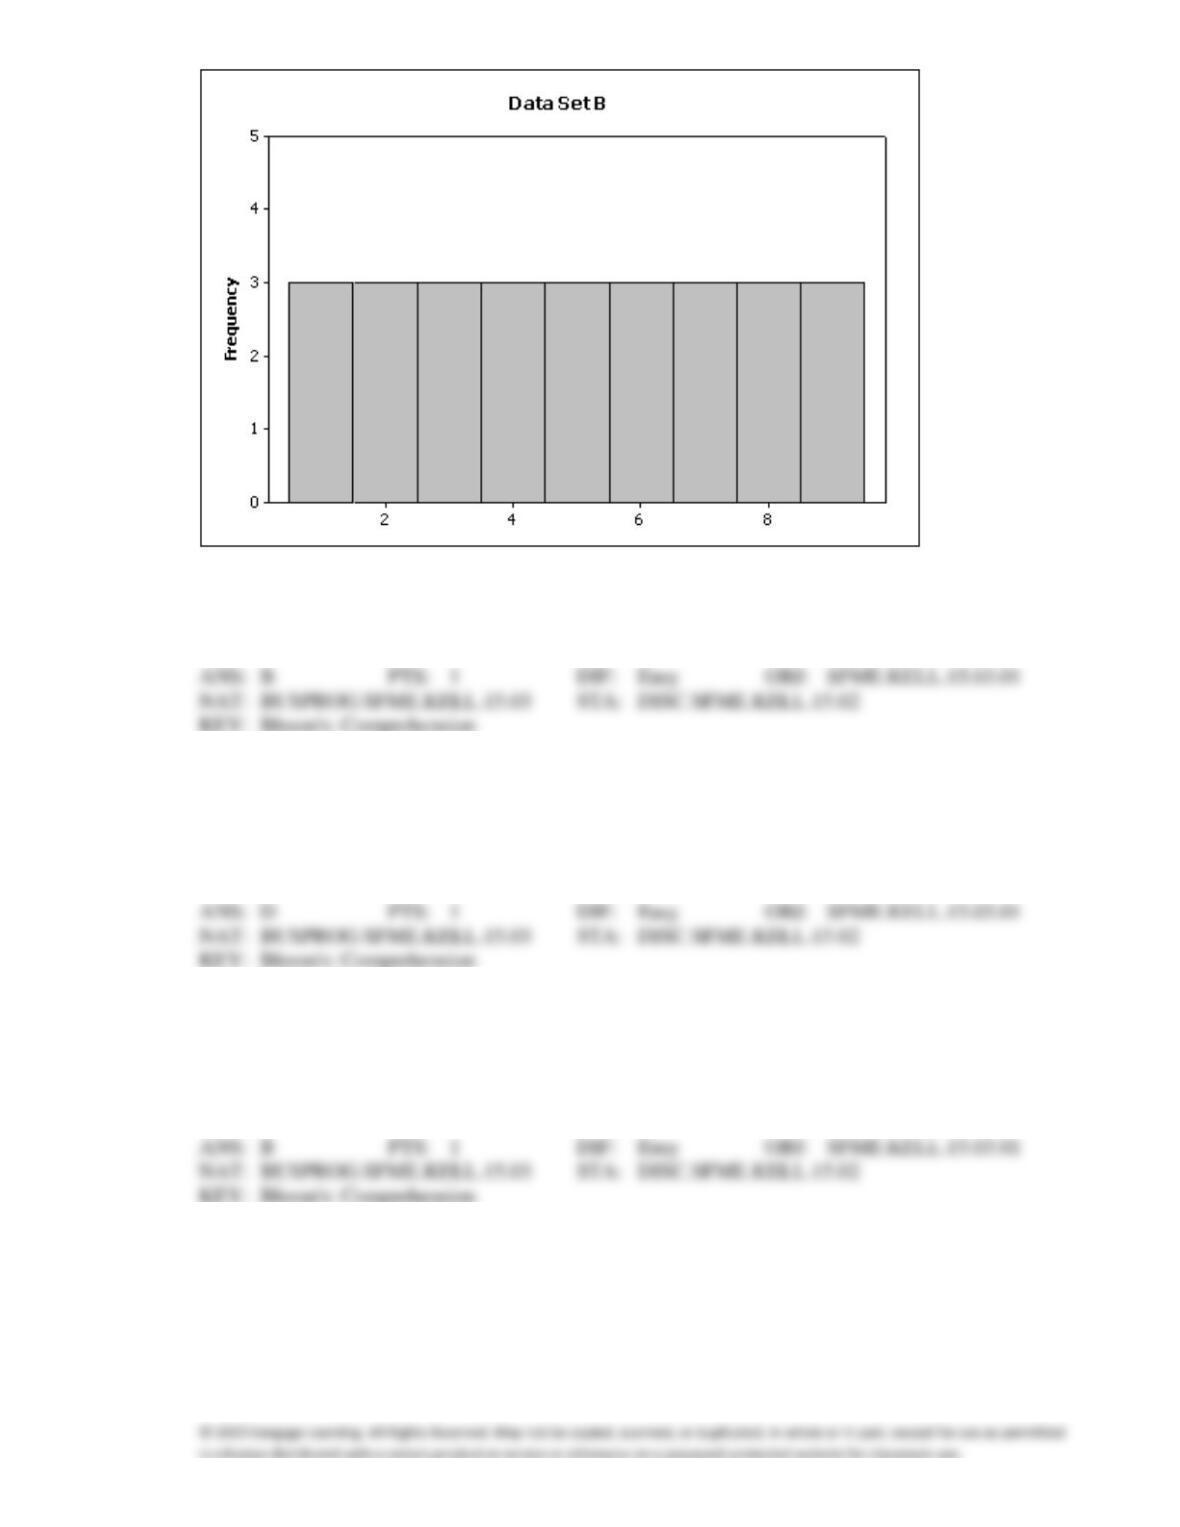
6. Compare the two histograms below. Which statement is true?
a.
The center of histogram A is lower than the center of histogram B.
b.
The center of histogram A is higher than the center of histogram B.
c.
The center of histogram A is the same as the center of histogram B.
d.
You cannot compare the centers of these two histograms without the original data.
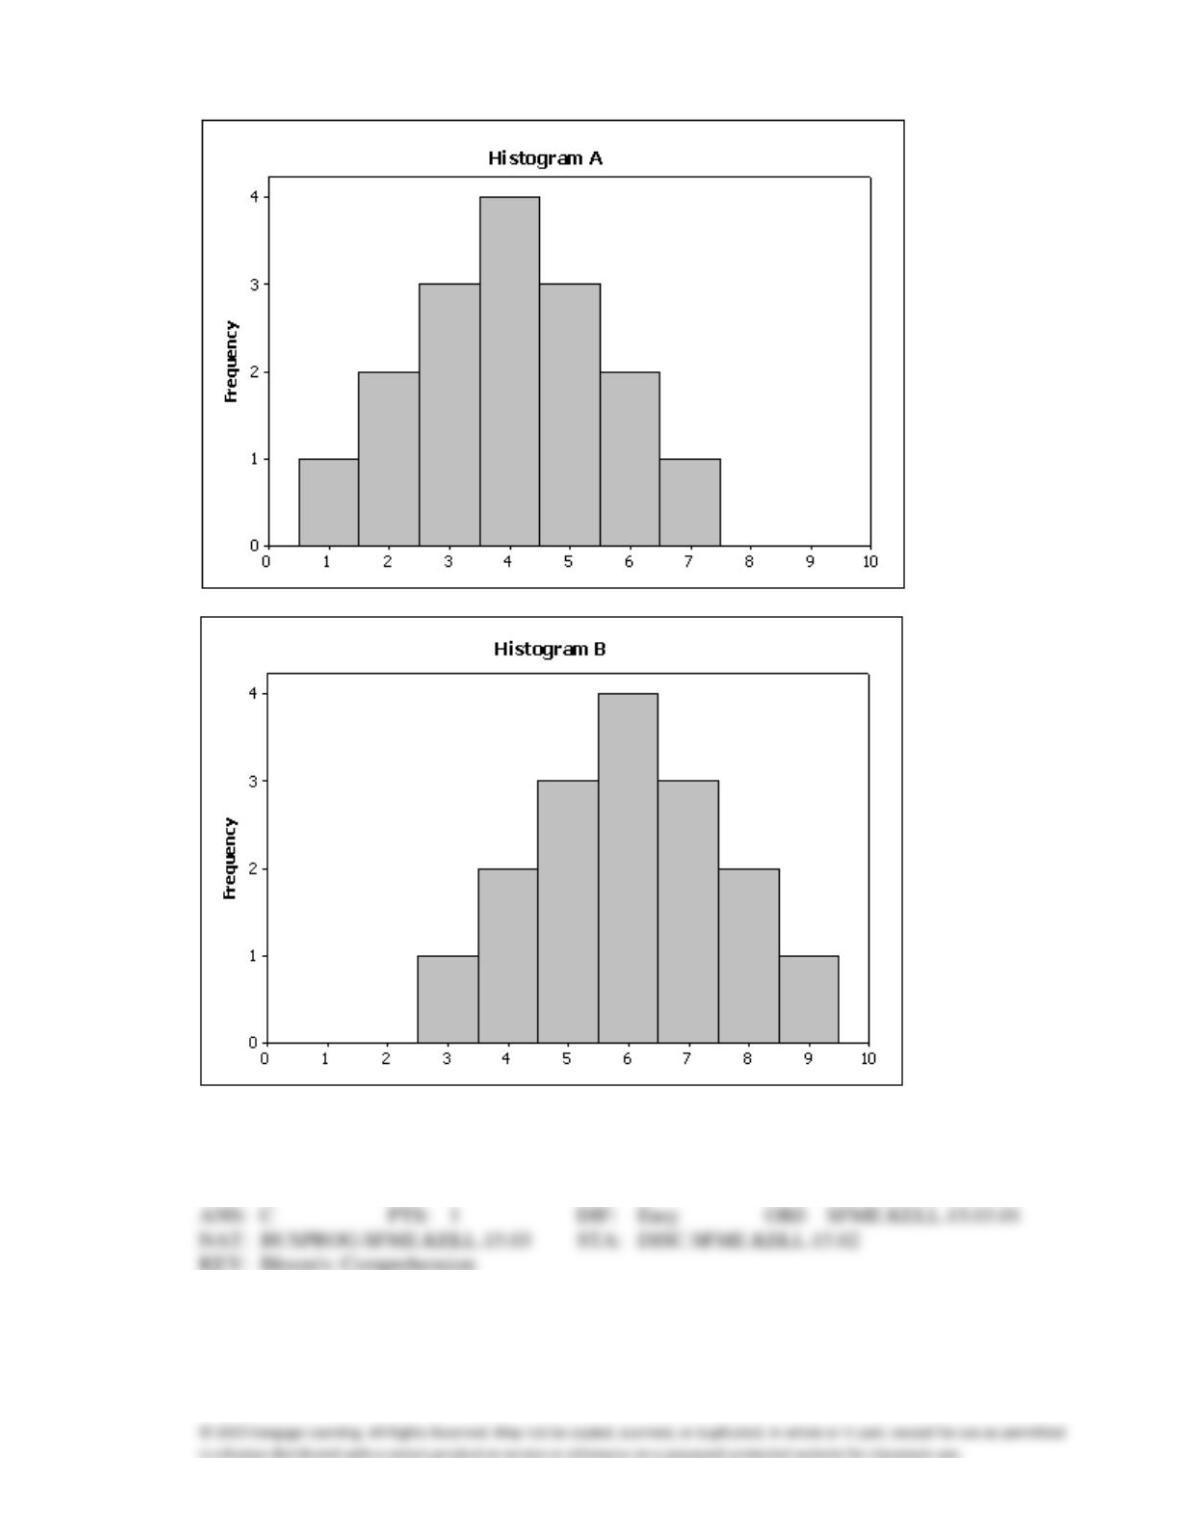
7. Compare the two histograms below. Which statement is true?
a.
The spread of histogram A is smaller than the spread of histogram B.
b.
The spread of histogram A is larger than the spread of histogram B.
c.
The spread of histogram A is the same as the spread of histogram B.
d.
You cannot compare the spreads of these two histograms without the original data.
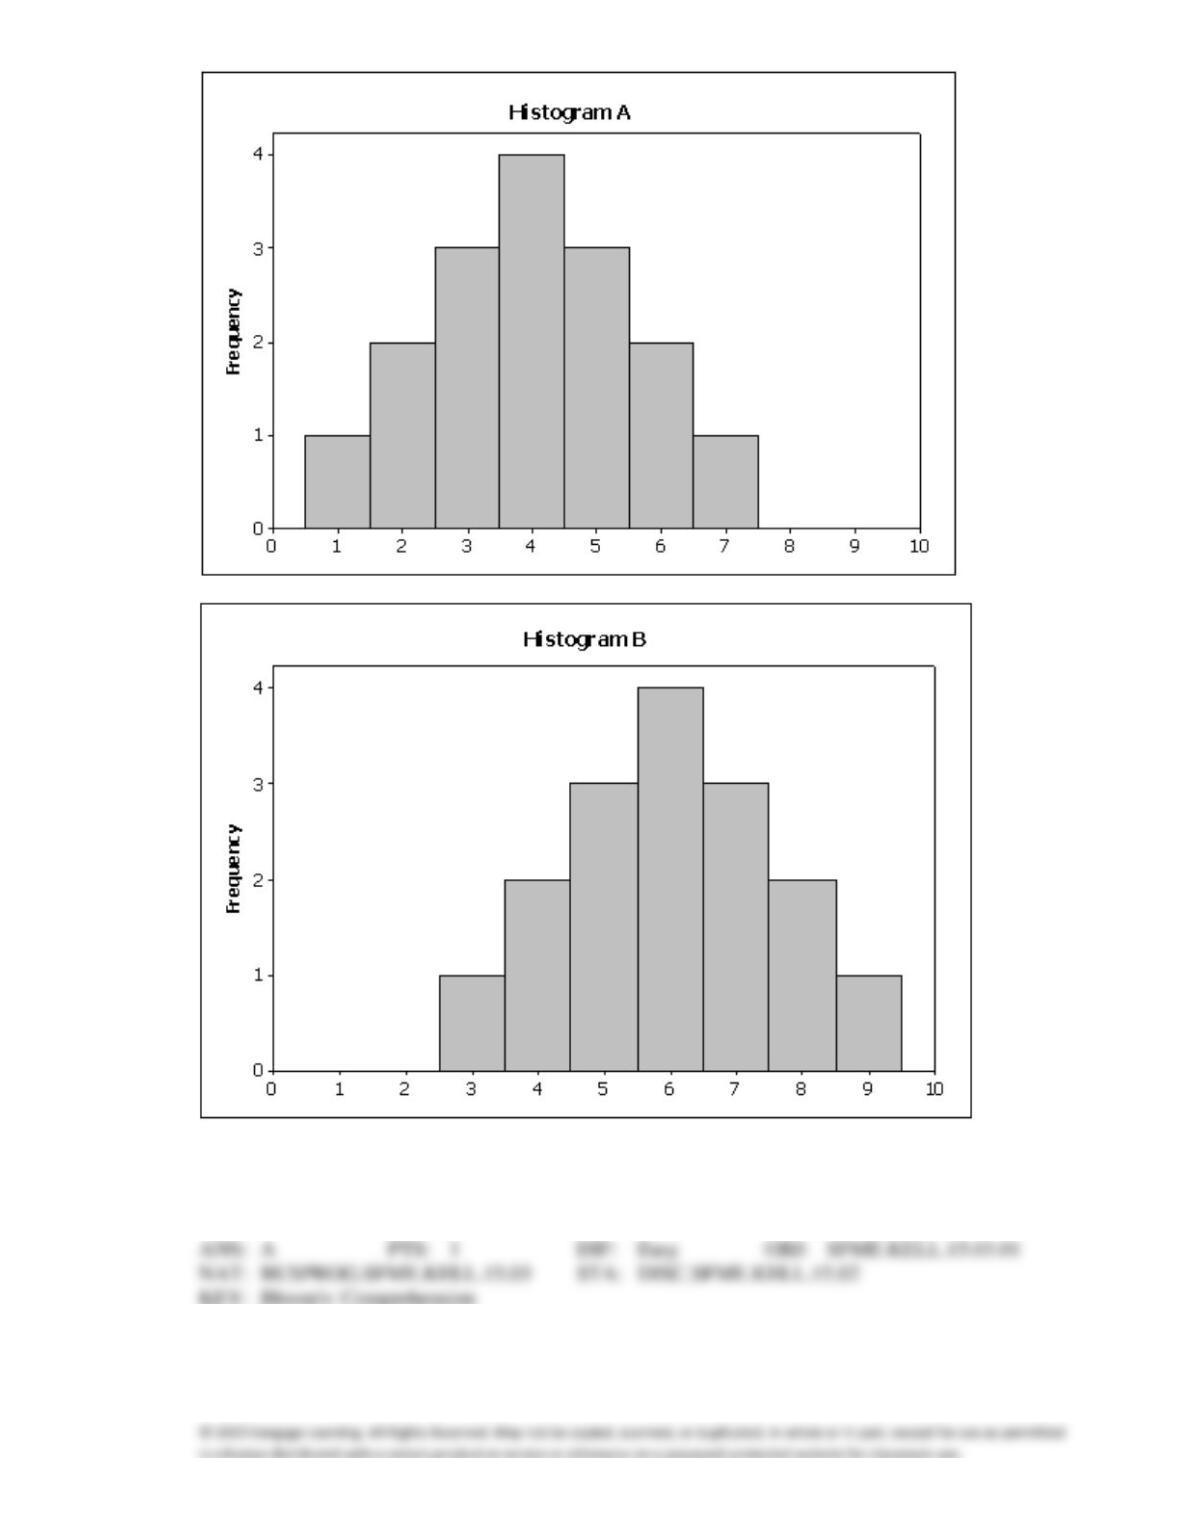
8. Compare the two histograms below. Which statement is true?
a.
The shape of histogram A is the same as the shape of histogram B.
b.
The shape of histogram A is positively skewed compared to histogram B.
c.
The shape of histogram A is negatively skewed compared to histogram B.
d.
You cannot compare the shapes of these two histograms without the original data.
9. A modal class in a histogram is the class that includes
a.
the largest number of observations.
c.
the largest observation in the data set.
b.
the smallest number of observations.
d.
the smallest observation in the data set.
10. The sum of the relative frequencies for all classes in a histogram always equals
a.
the number of classes.
c.
the total of all the frequencies.
b.
the class width.
d.
one.
11. Which of the following statements about shapes of histograms is true?
a.
A histogram is said to be symmetric if, when we draw a vertical line down the center of
the histogram, the two sides are identical in shape and size.
b.
A negatively skewed histogram is one with a long tail extending to the left.
c.
A positively skewed histogram is one with a long tail extending to the right.
d.
All of these choices are true.
12. Compare the spread of the two histograms below. Which of the following is true?
a.
Data Set A has a larger spread than Data Set B.
b.
Data Set A has a smaller spread than Data Set B.
c.
Data Set A has the same spread as Data Set B.
d.
You cannot compare the spreads of these histograms without the original data.
13. Which of the following is true about a stem-and-leaf display?
a.
You can recreate the original data set from it.
b.
Its shape resembles a histogram turned on its side.
c.
It provides an organized way to depict interval data.
d.
All of these choices are true.
14. What does the length of each line of a stem-and-leaf display represent?
a.
The percentage of observations in the interval represented by that stem.
b.
The number of observations in the interval represented by that stem.
c.
The total frequency of observations within or below that stem.
d.
The number of digits to the left of the decimal point.
15. What values are displayed on a cumulative relative frequency distribution?
a.
The number of observations that fall into each class interval.
b.
The proportion of observations that fall into each class interval.
c.
The number of observations that fall below each class interval.
d.
The proportion of observations that fall below each class interval.
16. Which of the following describes an ogive?
a.
A graphical representation of frequencies.
b.
A graphical representation of relative frequencies.
c.
A graphical representation of cumulative frequencies.
d.
A graphical representation of cumulative relative frequencies.
COMPLETION
1. We create a frequency distribution for interval data by counting the number of observations that fall
into each of a series of intervals, called ____________________.
2. The more observations we have, the ____________________ the number of class intervals we need to
use to draw a useful histogram.
3. A graph of the frequency distribution for interval data is called a(n) ____________________.
4. We determine the approximate width of the classes by subtracting the smallest observation from the
largest and dividing the answer by the number of ____________________.
5. A histogram is said to be ____________________ if, when we draw a vertical line down the center of
the histogram, the two sides are identical in shape and size.
6. A(n) ____________________ histogram is one with a long tail extending to either the right or the left.
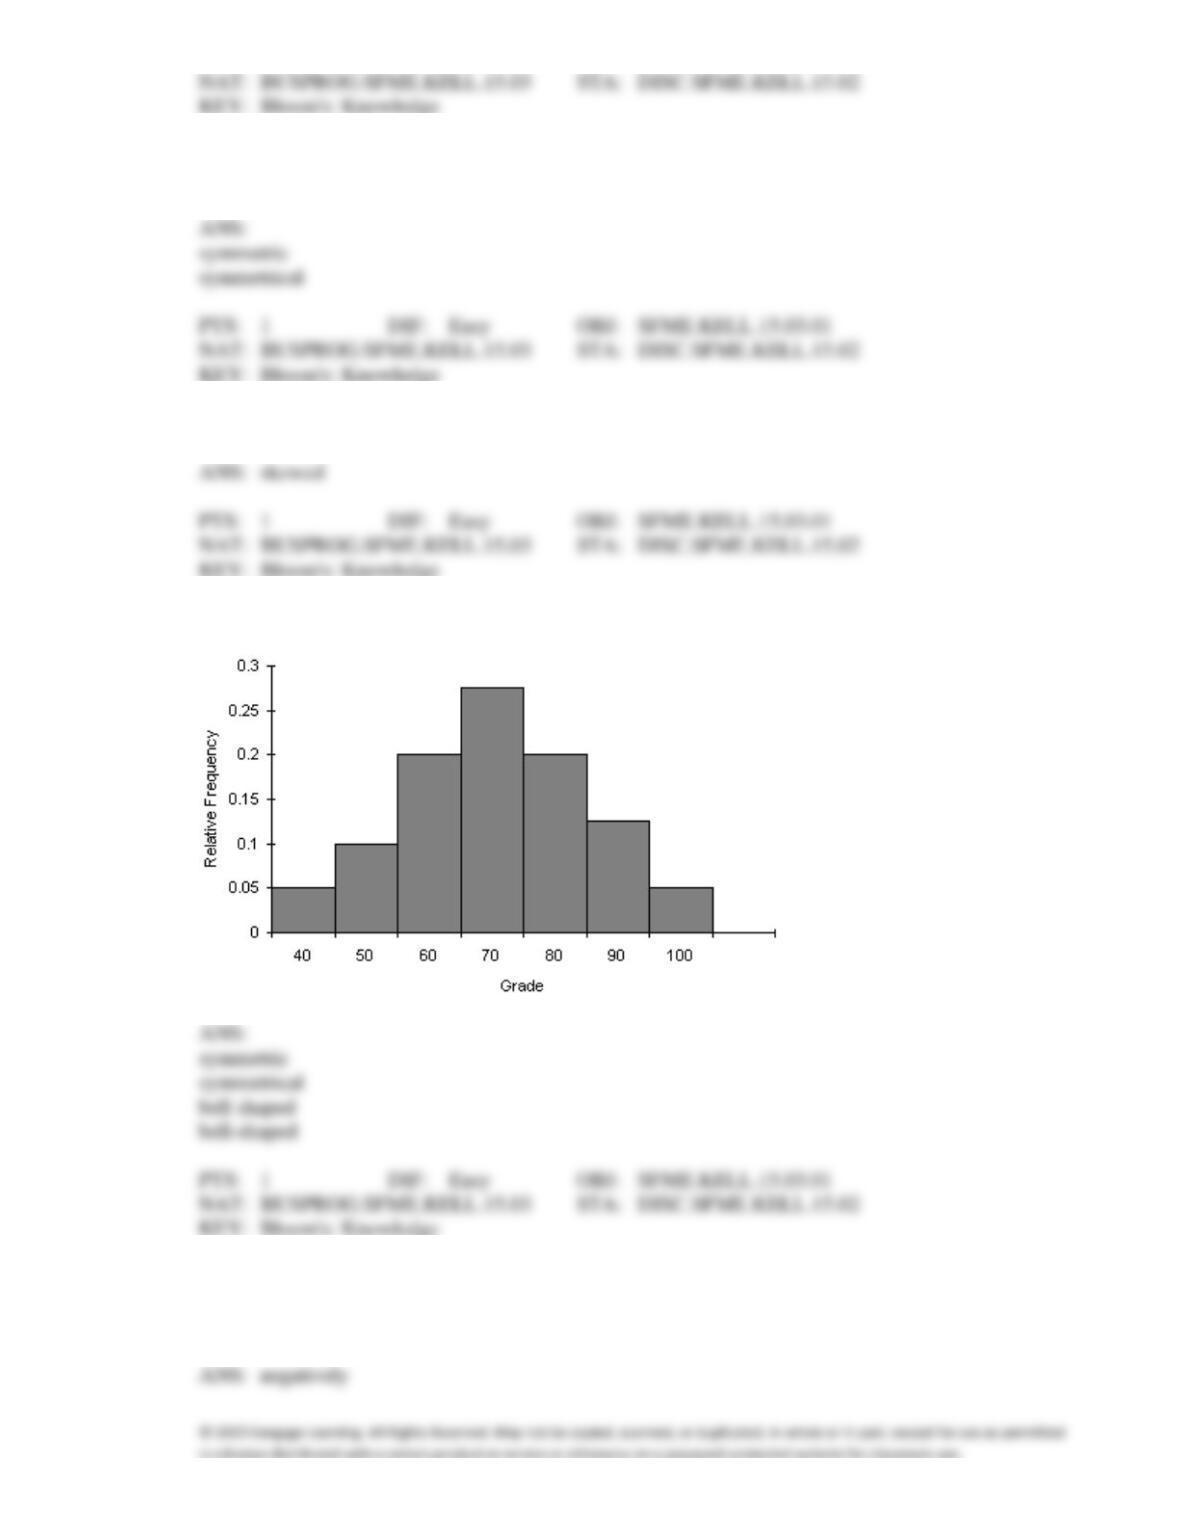
7. The histogram below has a shape that is ____________________.
8. It is typical that when taking an exam, few students hand in their exams early; most prefer to reread
their papers and hand them in near the end of the scheduled exam period. Under this scenario, a
histogram of exam taking times is ____________________ skewed.
9. In a histogram a(n) ____________________ class is the one with the largest number of observations.
10. A(n) ____________________ histogram has two peaks, not necessarily equal in height.
11. The length of each line in a step-and-leaf display represents the ____________________ of that class
interval defined by the stems.
12. A(n) ____________________ is a graphical representation of the cumulative relative frequencies.
13. The largest value of a cumulative relative frequency is ____________________.
14. A(n) ____________________ display shows the actual observations as well as the number of
observations in each class.
ANS:
15. A(n) ____________________ is a table that sorts data into class intervals (categories) and gives the
number of observations in each interval (category).
SHORT ANSWER
1. For what type of data is a histogram appropriate?
2. Thirty voters participating in a recent election exit poll in Alabama were asked to state their political
party affiliation. Coding the data 1 for Republican, 2 for Democrat, and 3 for Independent, the data
collected were as follows: 3, 1, 2, 3, 1, 3, 3, 2, 1, 3, 3, 2, 1, 1, 3, 2, 3, 1, 3, 2, 3, 2, 1, 1, 3, 1, 2, 2, 1, and
3. Develop a frequency distribution and a relative frequency distribution for this data. What does the
data suggest about the strength of the political parties in Alabama?
Republican
Democrat
Teachers Ages
The ages (in years) of a sample of 25 teachers are as follows:
47
21
37
53
28
40
30
32
34
26
34
24
24
35
45
38
35
28
43
45
30
45
31
41
56
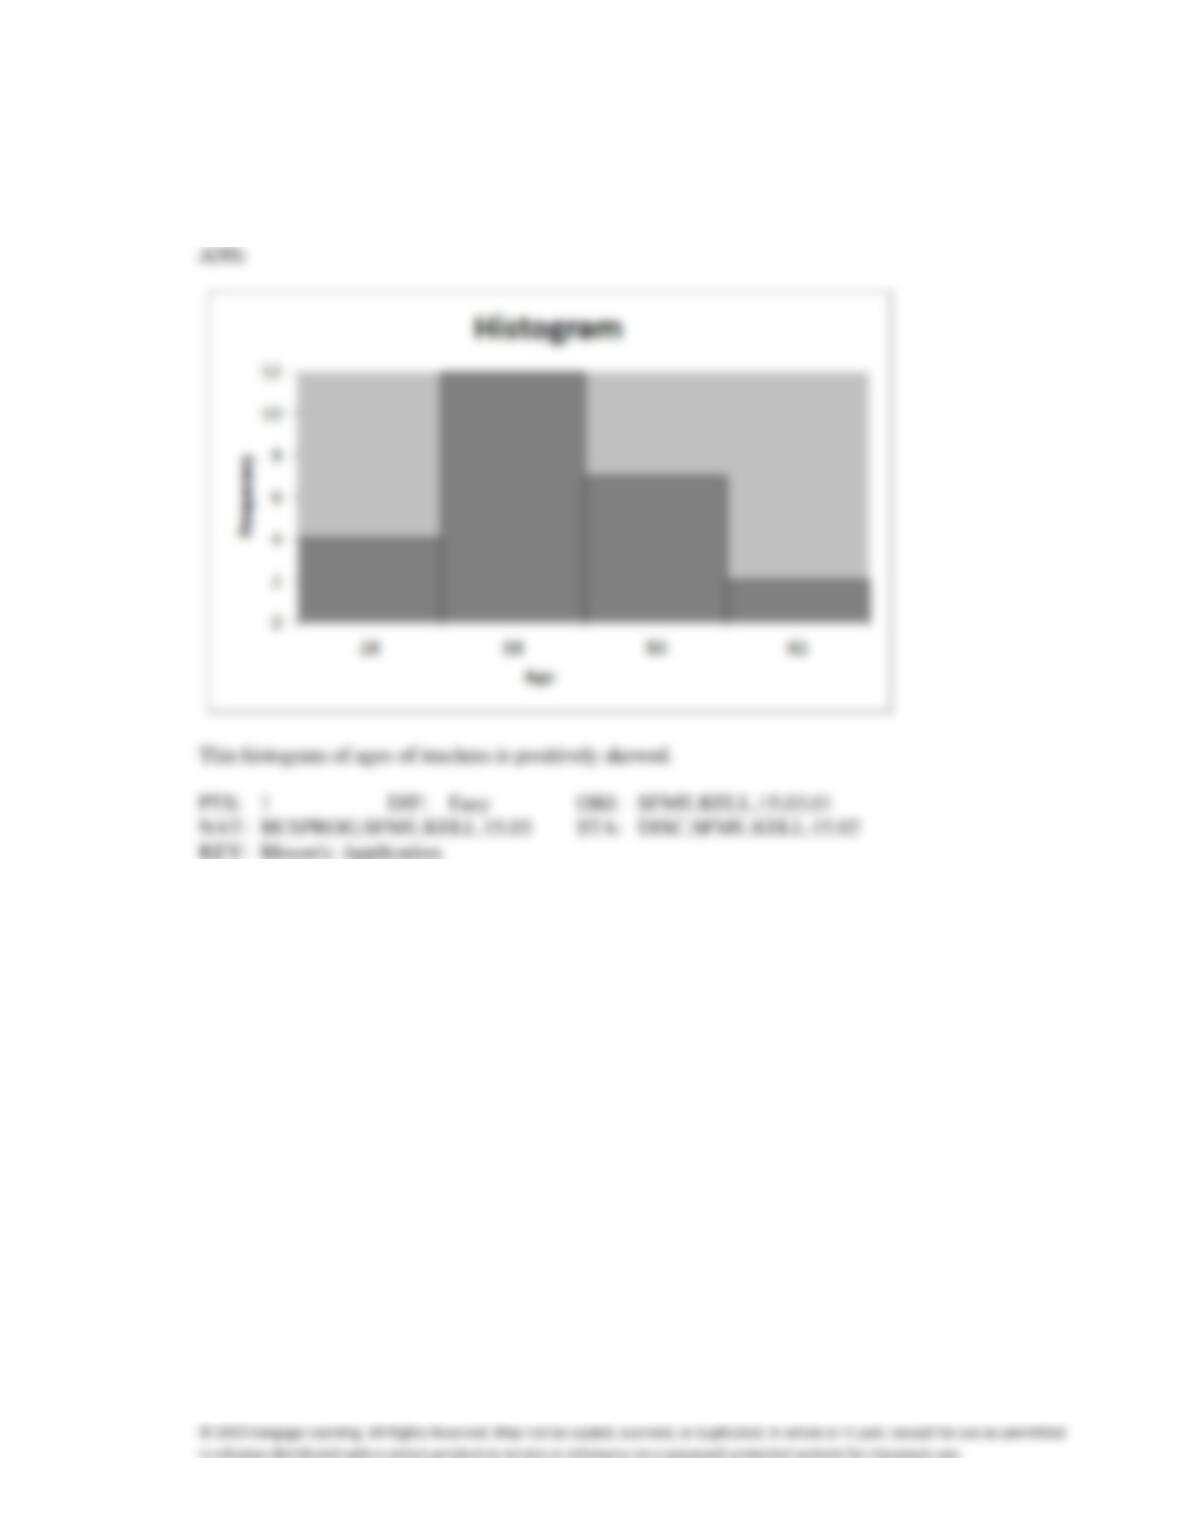
3. {Teachers Ages Narrative} Draw a frequency histogram of this data which contains four classes. What
is the shape of the histogram?
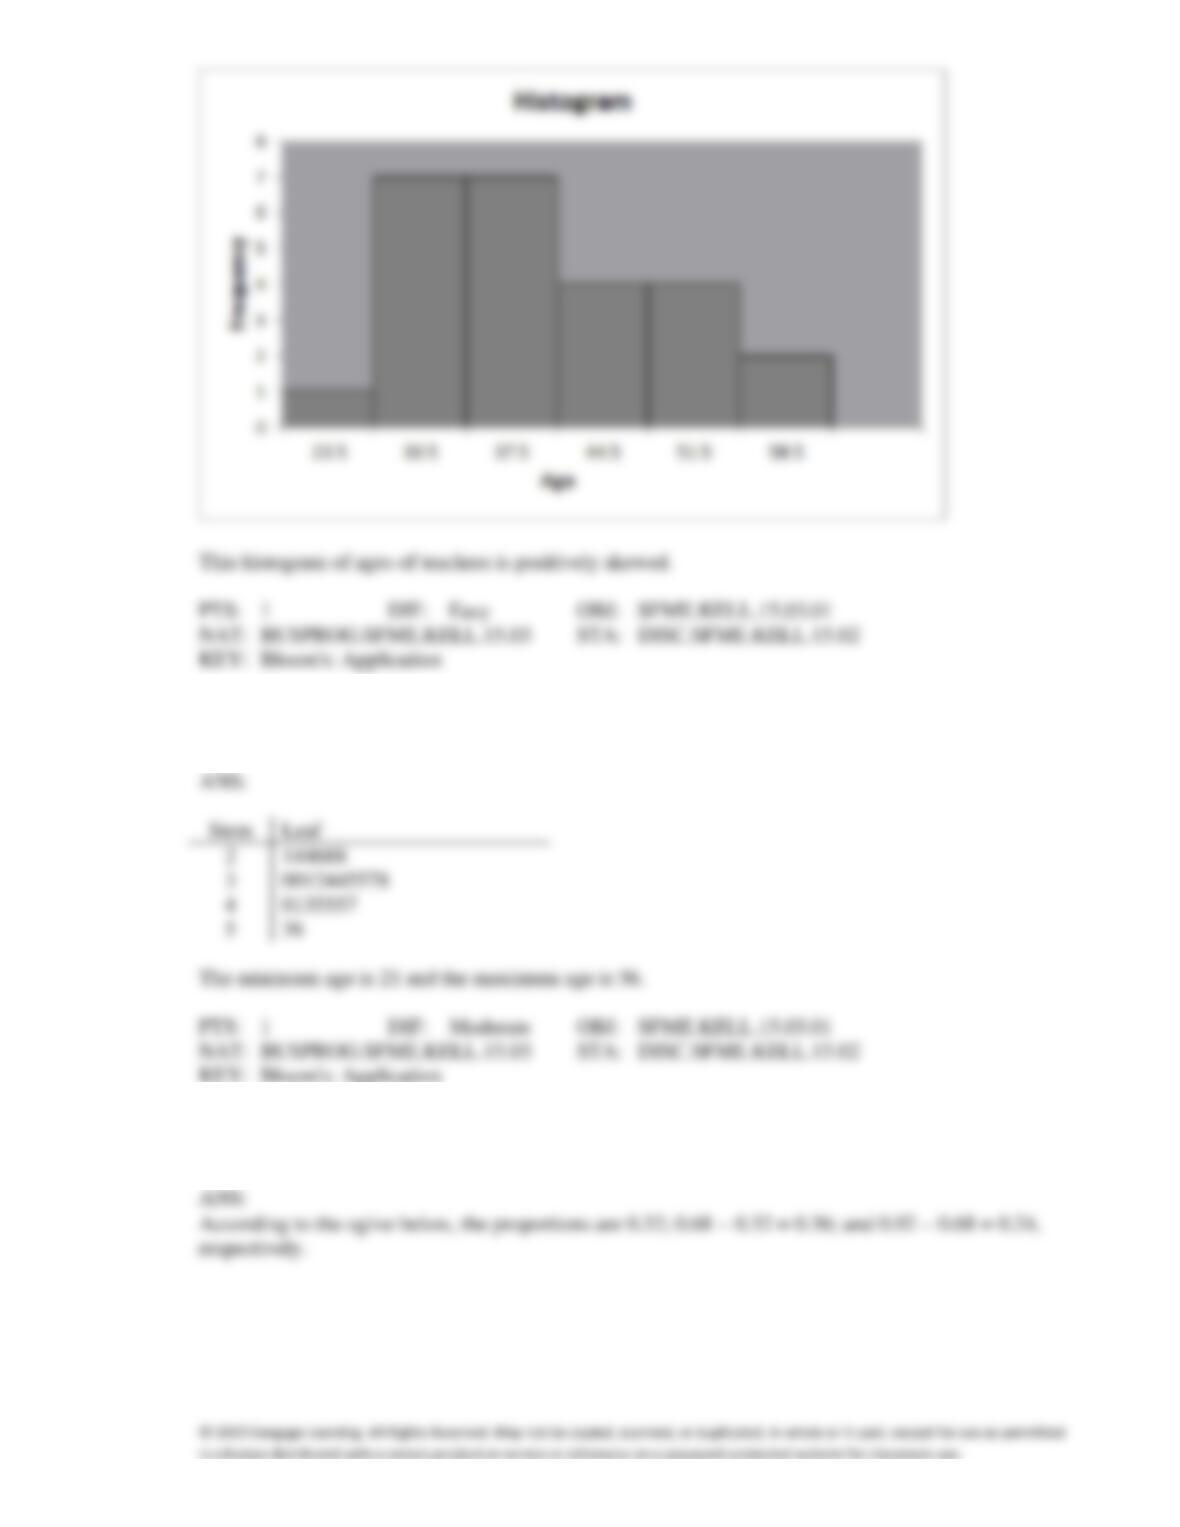
4. {Teachers Ages Narrative} Draw a frequency histogram of this data which contains six classes. What
is the shape of the histogram?
ANS:
5. {Teachers Ages Narrative} Draw a stem-and-leaf display of this data. What is the minimum and
maximum age of the teachers in this data set?
6. {Teachers Ages Narrative} Construct an ogive for this data. Estimate the proportion of salespersons
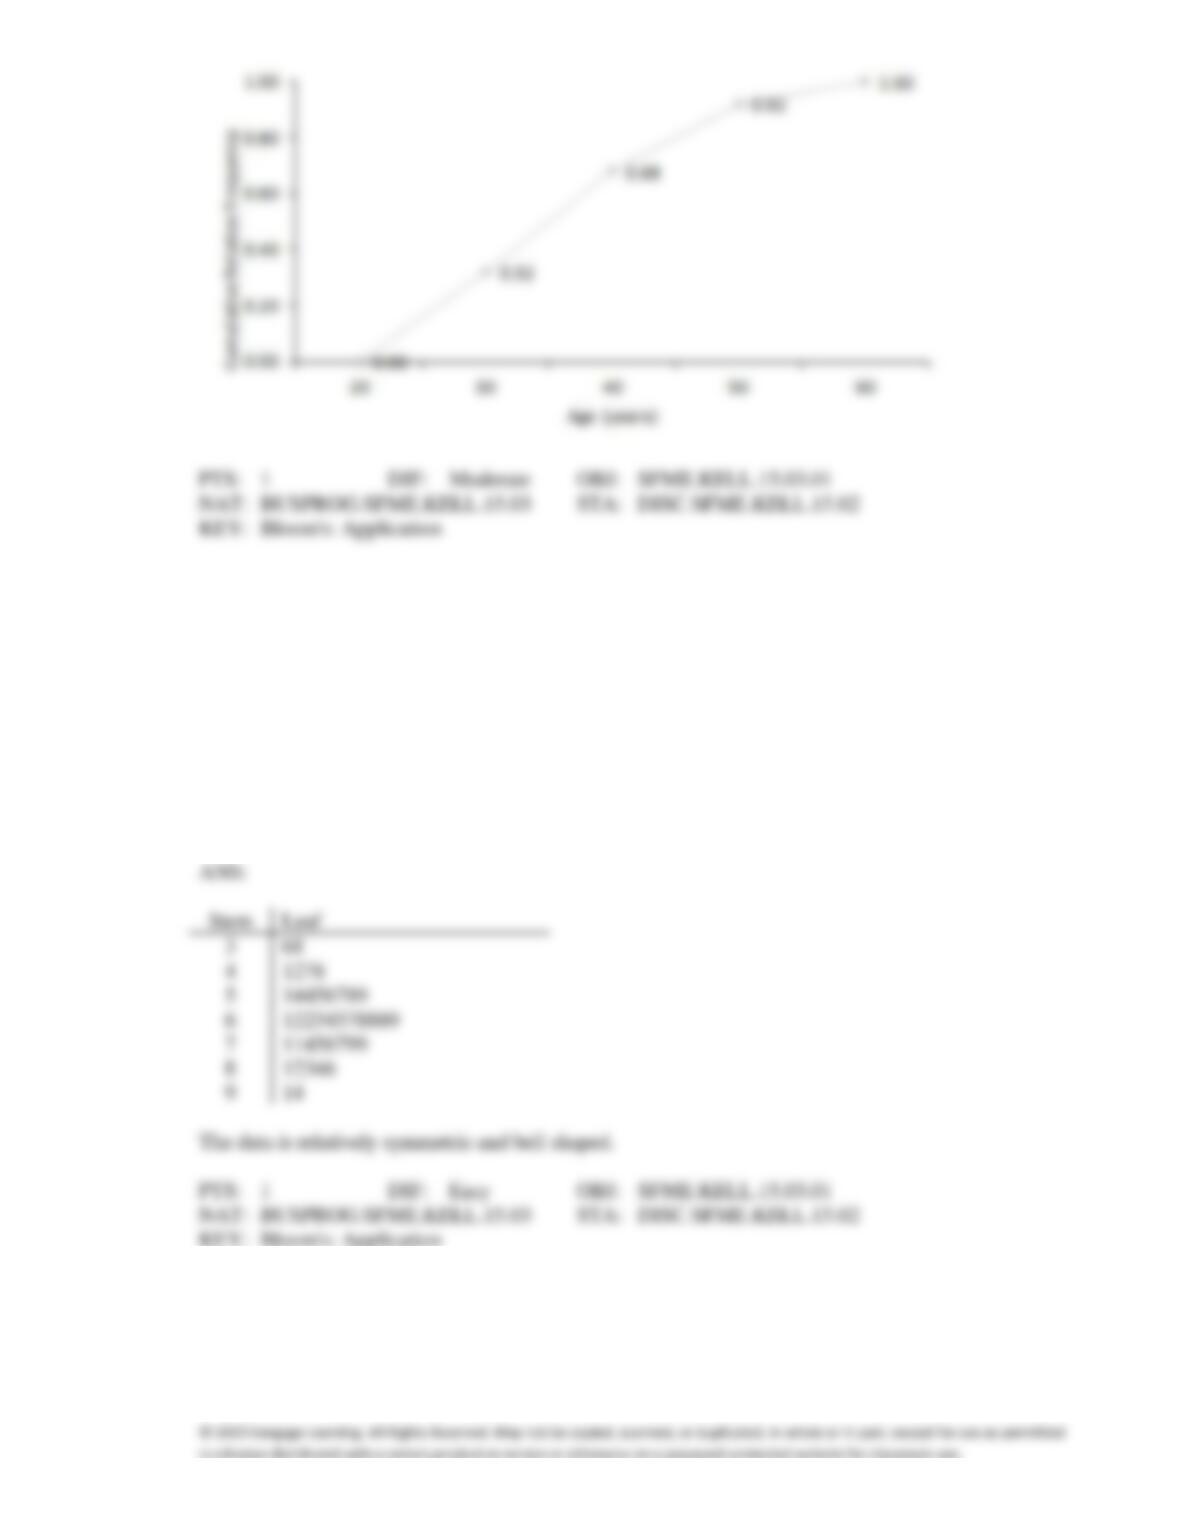
that are: 1) under 30 years of age; 2) 40 years of age or over; and 3) between 40 and 50 years of age.
Test scores
The scores on a calculus test for a random sample of 40 students are as follows:
63
74
42
65
51
54
36
56
68
57
62
64
76
67
79
61
81
77
59
38
84
68
71
94
71
86
69
75
91
55
48
82
83
54
79
62
68
58
41
47
7. {Test Grades Narrative} Construct a stem-and-leaf display for this data set. Describe the shape of the
data.
Leaf
68
1278
14456789
12234578889
11456799
12346
14
8. {Test Grades Narrative} Construct frequency and relative frequency distributions for this data set
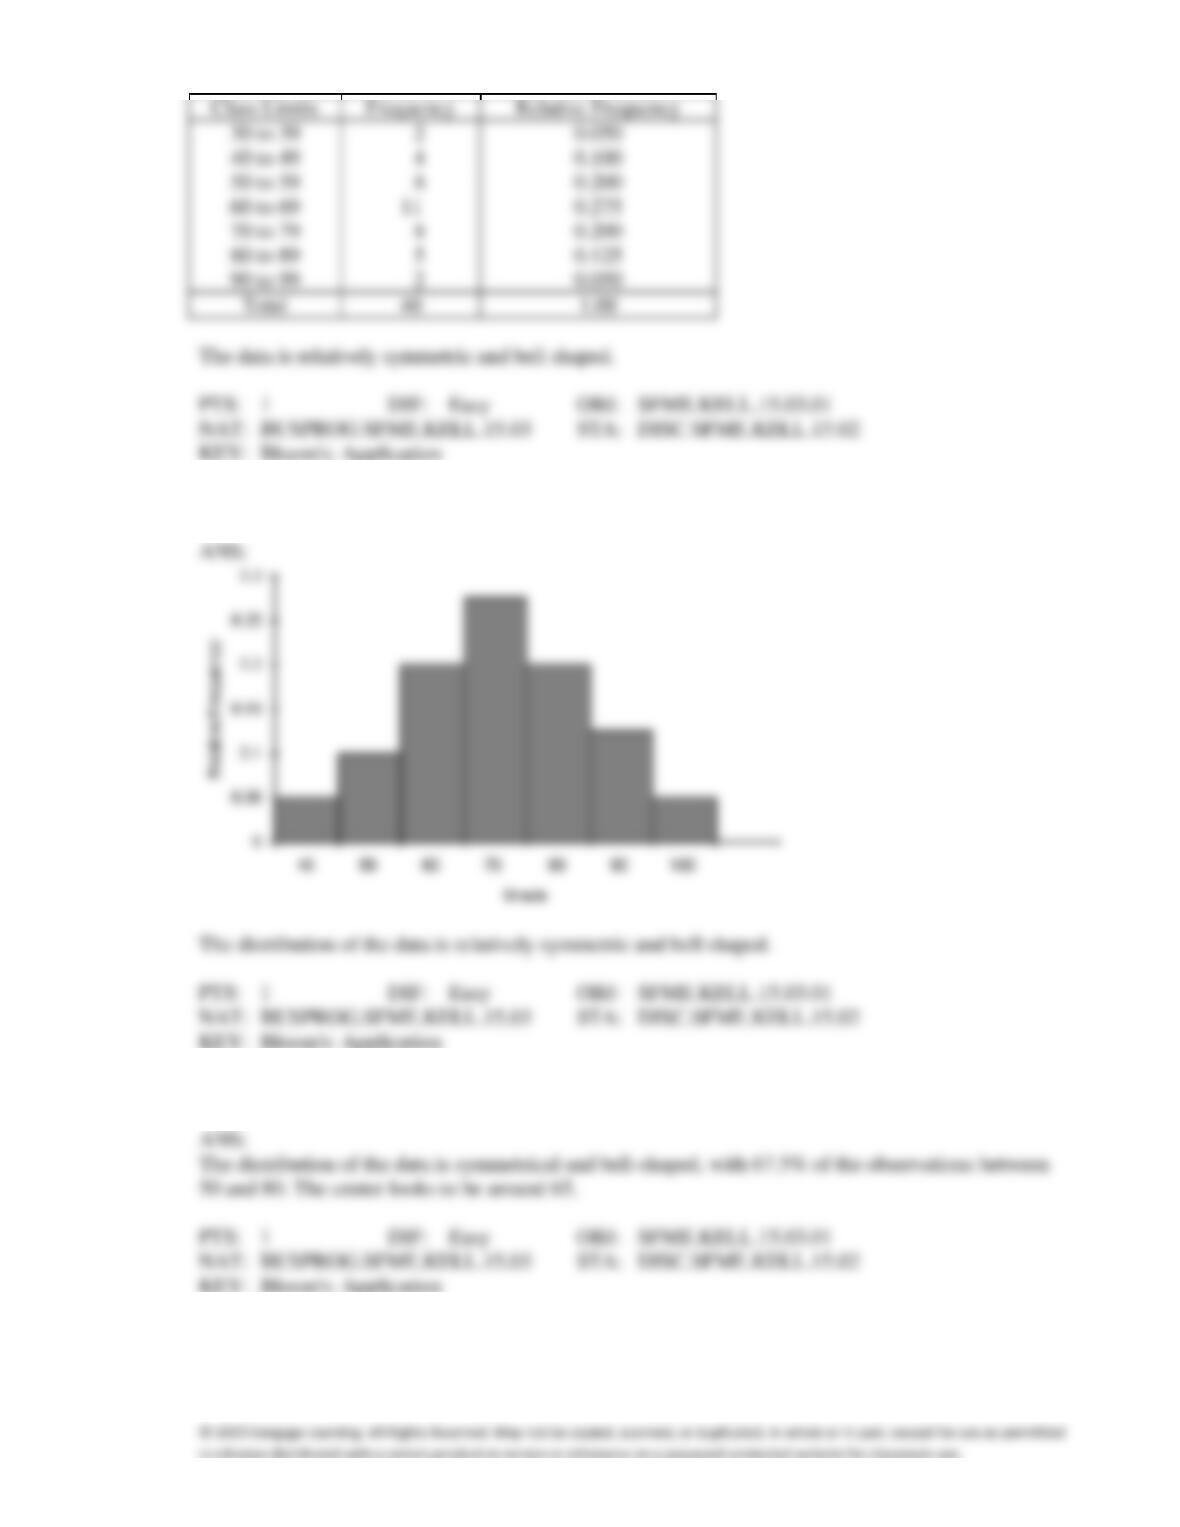
using seven class intervals. Describe the shape of the data set.
ANS:
9. {Test Grade Narrative} Construct a relative frequency histogram for this data set and discuss its shape.
10. {Test Grades Narrative} Describe the distribution of exam scores.
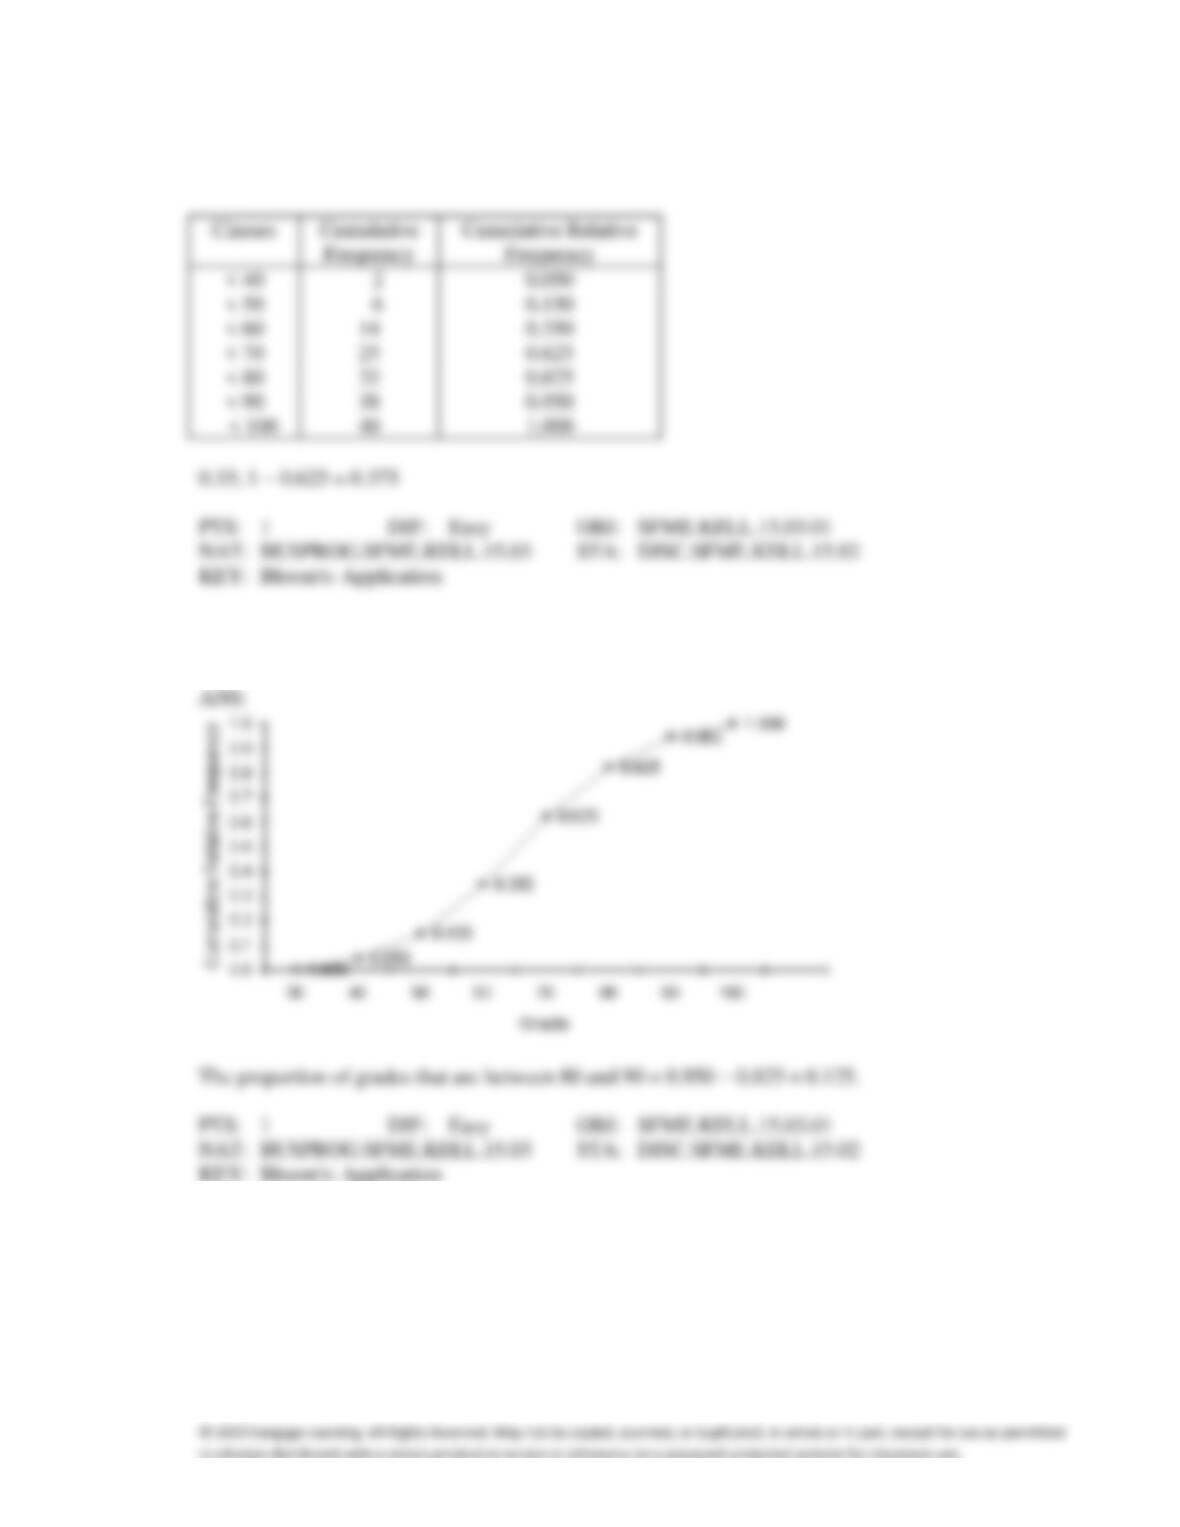
11. {Test Grades Narrative} Construct a cumulative frequency and a cumulative relative frequency
distribution for this data. What proportion of the exam scores are less than 60? What proportion of the
exam scores are 70 or more?
ANS:
12. {Test Grades Narrative) Construct an ogive for this data set. Use the ogive to estimate the proportion
of exam scores that are between 80 and 90.
13. Fifty two truck buyers were asked to indicate the car dealer they believed offered the best overall
service. The four choices were A, B, C, and D as shown below:
A
C
C
C
D
C
B
A
C
D
A
B
C
D
B
C
B
A
C
B
B
C
B
B
A
C
A
C
C
A
D
B
B
C
C
A
C
D
B
A
D
C
D
A
B
B
C
D
A
B
D
A
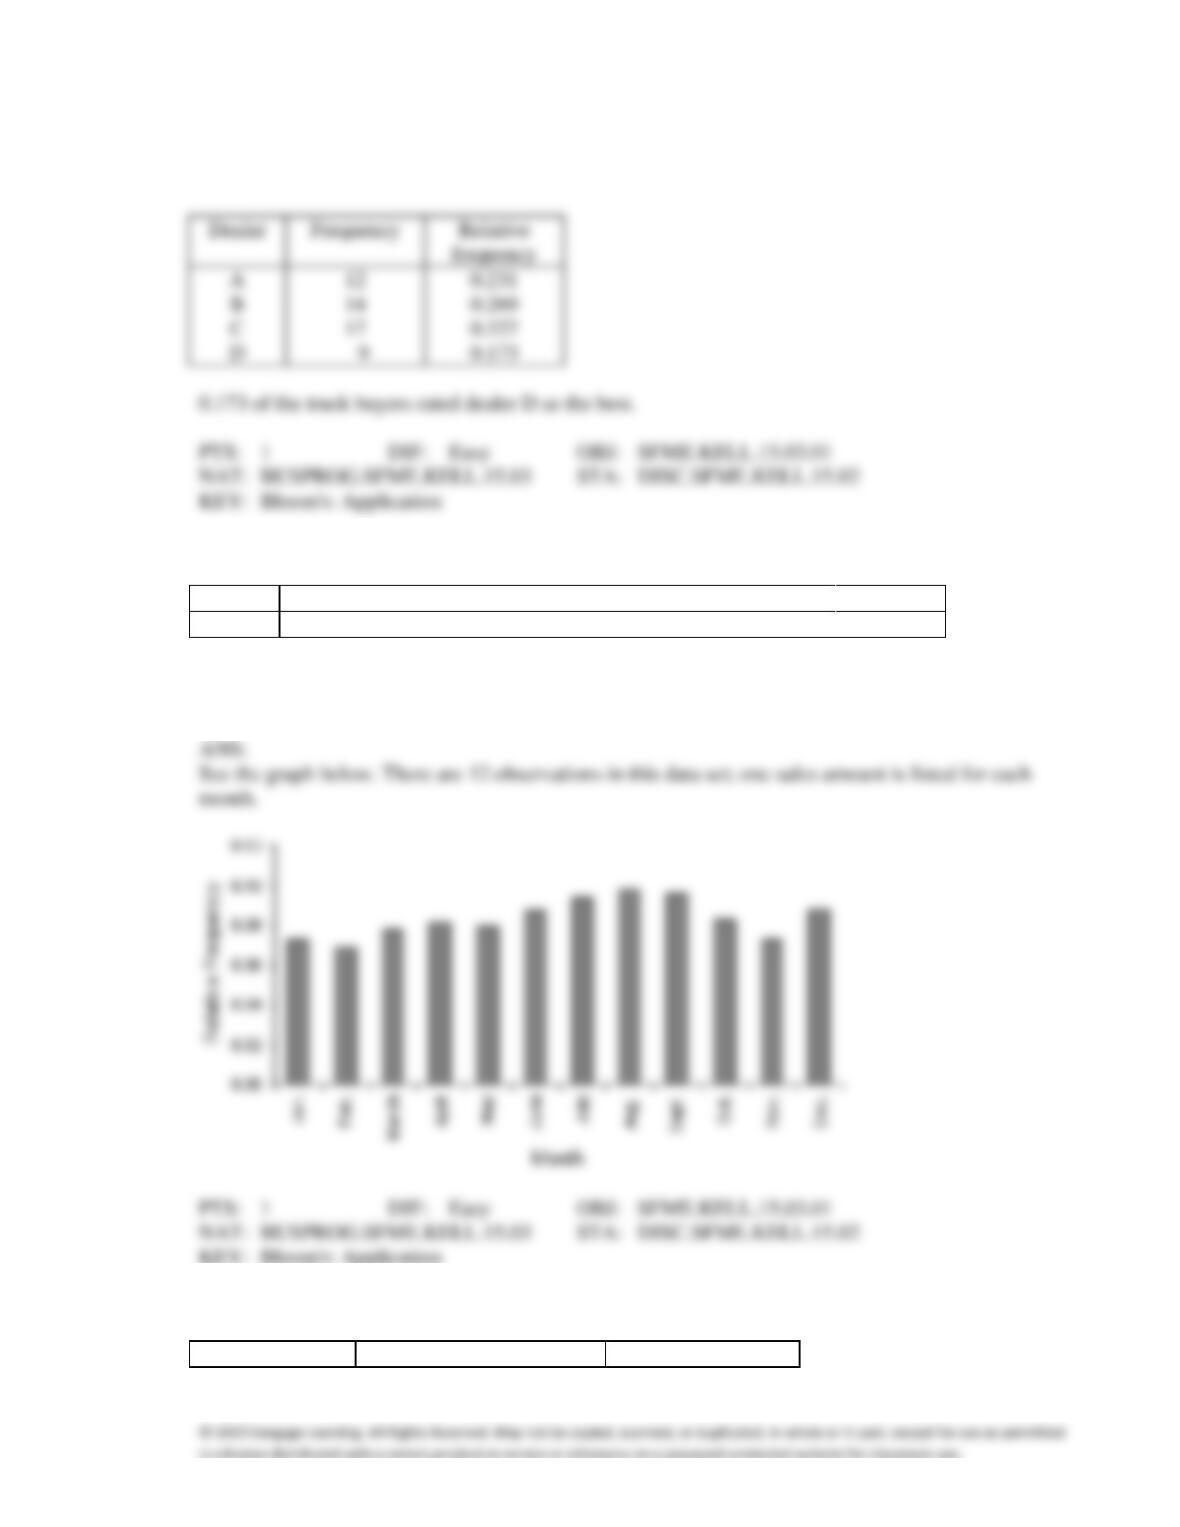
Construct a table showing the frequencies and relative frequencies for this data set. What proportion of
car buyers rated dealer D as the best?
ANS:
Dealer
14. A supermarket’s monthly sales (in thousands of dollars) for the last year were as follows:
Month
1
2
3
4
5
6
7
8
9
10
11
12
Sales
78
74
83
87
85
93
100
105
103
89
78
94
Construct a relative frequency bar chart for this data set. How many observations are there in this data
set?
15. Consider the following cumulative frequency distribution.
Classes Limits
Cumulative Frequency
Frequency