4.73
4.74
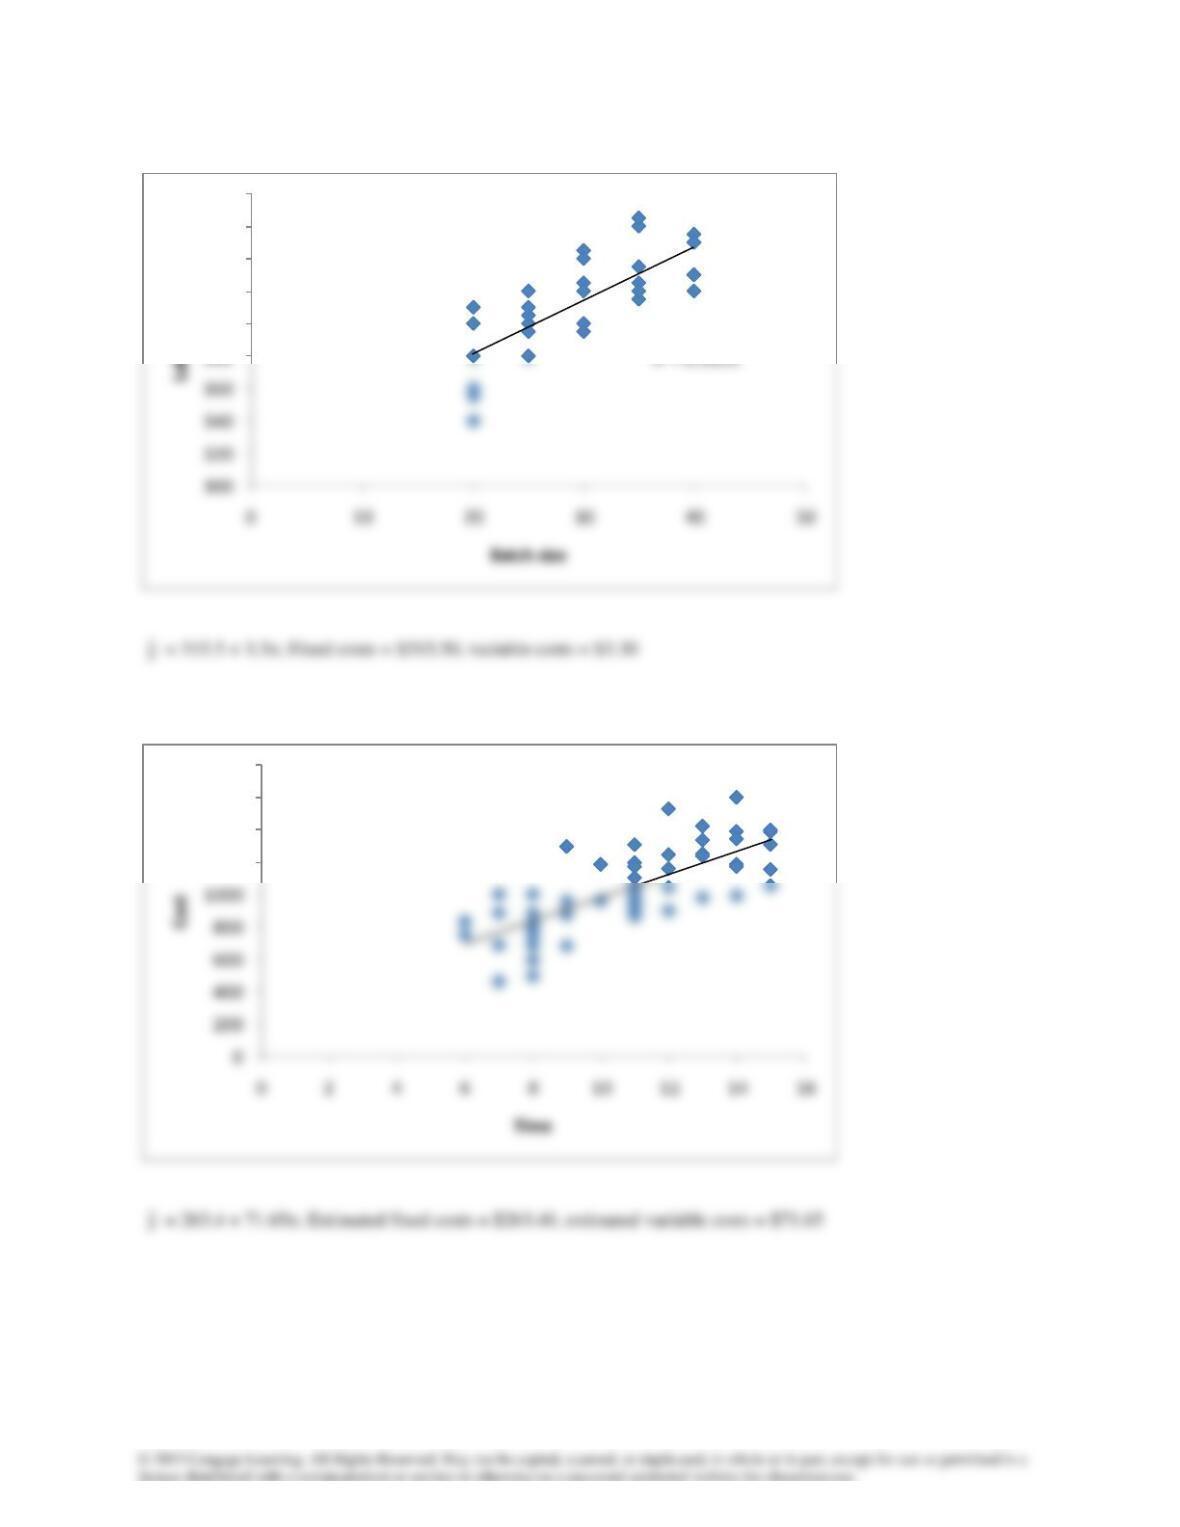
y = 3.3x + 315.5
380
400
420
440
460
480
y = 71.654x + 263.4
R² = 0.5437
1200
1400
1600
1800
4.75a
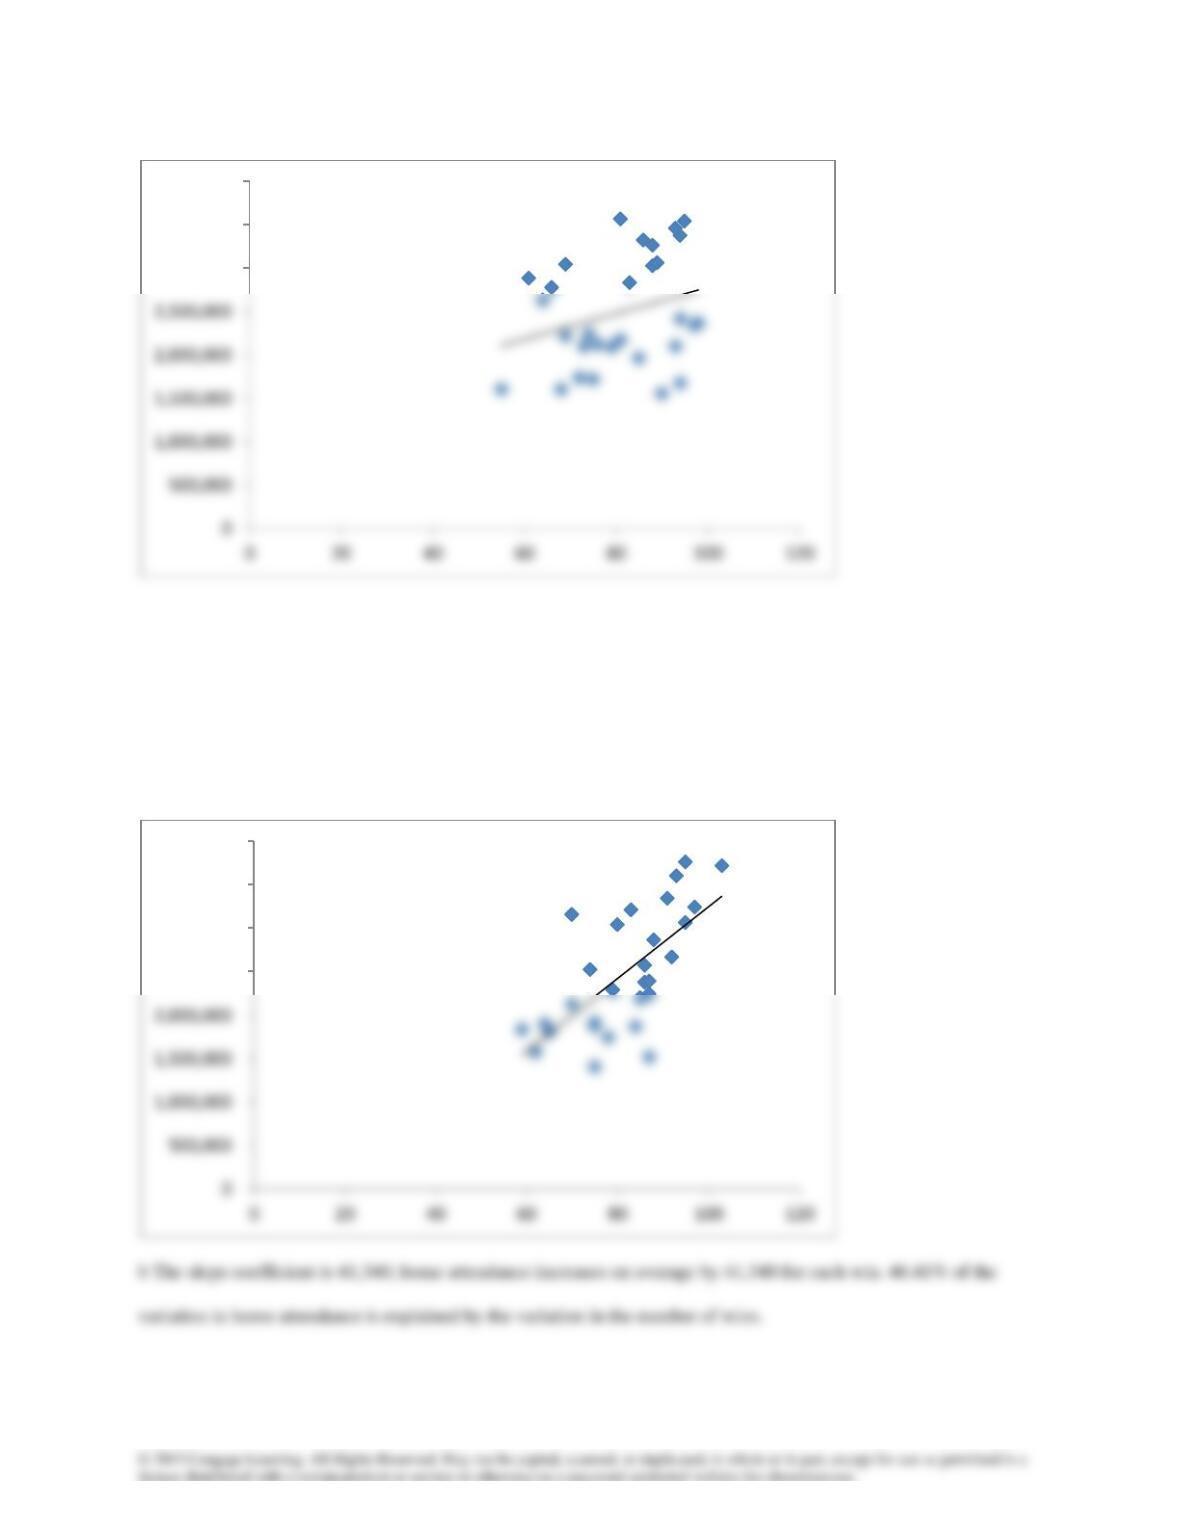
b The slope coefficient is 14,771; home attendance increases on average by 14,771 for each win. 7.53% of the
variation in home attendance is explained by the variation in the number of wins.
4.76a
y = 14771x + 1E+06
R² = 0.0753
3,000,000
3,500,000
4,000,000
y = 41340x – 893288
R² = 0.4641
2,500,000
3,000,000
3,500,000
4,000,000
4.77
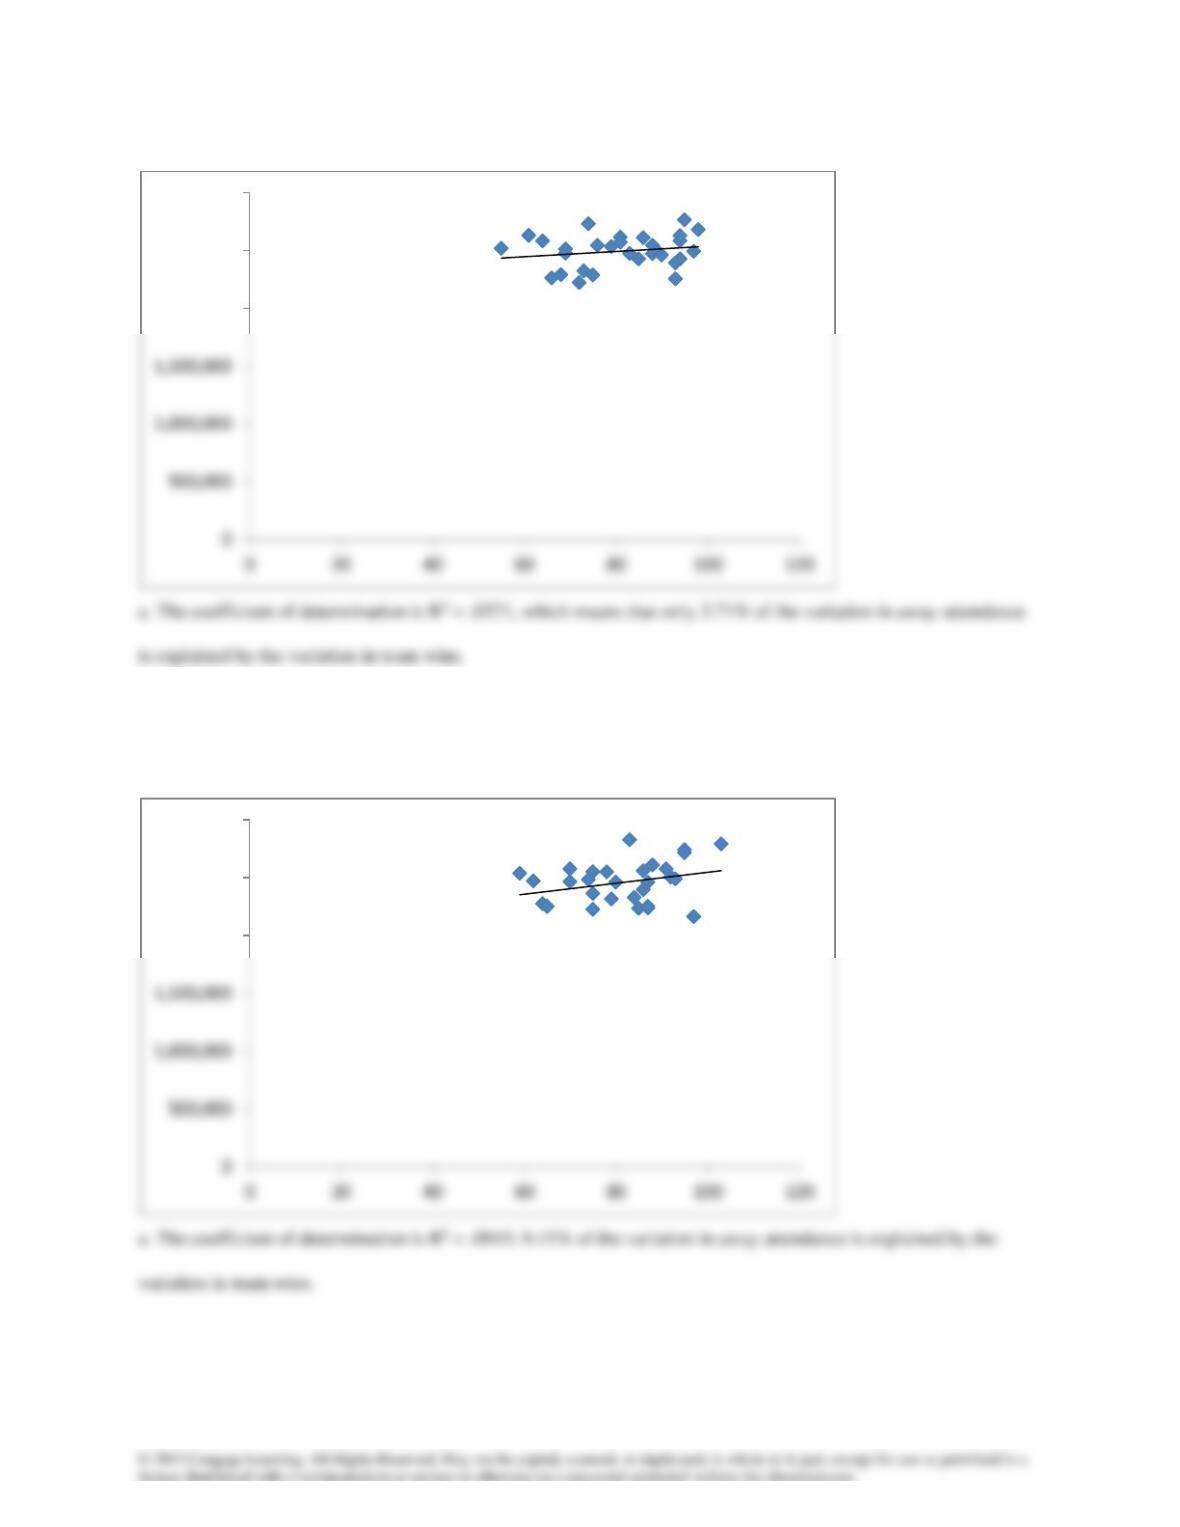
b The slope coefficient is 2278; away attendance increases on average by 2278 for each win.
4.78
b The slope coefficient is 4747; away attendance increases on average by 4746 for each win.
y = 2278.1x + 2E+06
R² = 0.0371
2,000,000
2,500,000
3,000,000
y = 4745.8x + 2E+06
R² = 0.0915
2,000,000
2,500,000
3,000,000
4.79a
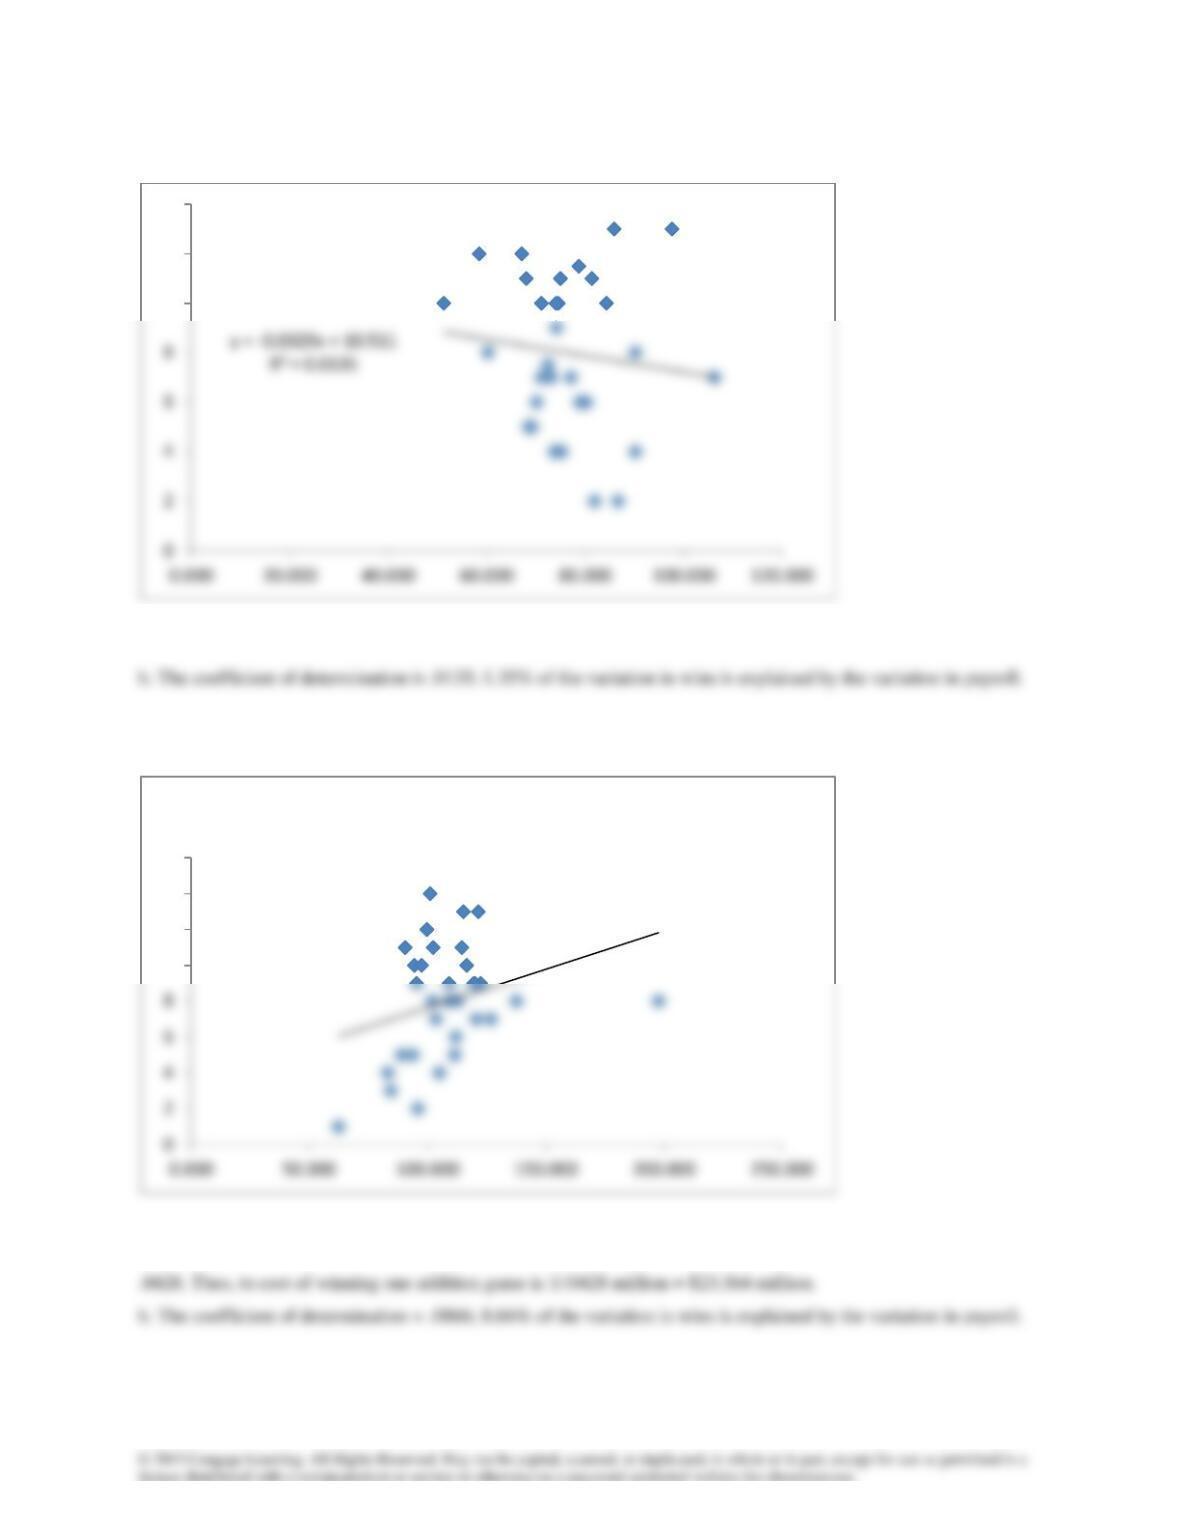
a. The slope coefficient is negative, which means theoretically that the more one spends the fewer the team wins.
4.80
a. The slope coefficient is .0428; for each million dollars in payroll the number of wins increases on average by
10
12
14
y = 0.0428x + 3.3651
R² = 0.0866
10
12
14
16
Wins
4.81a
b
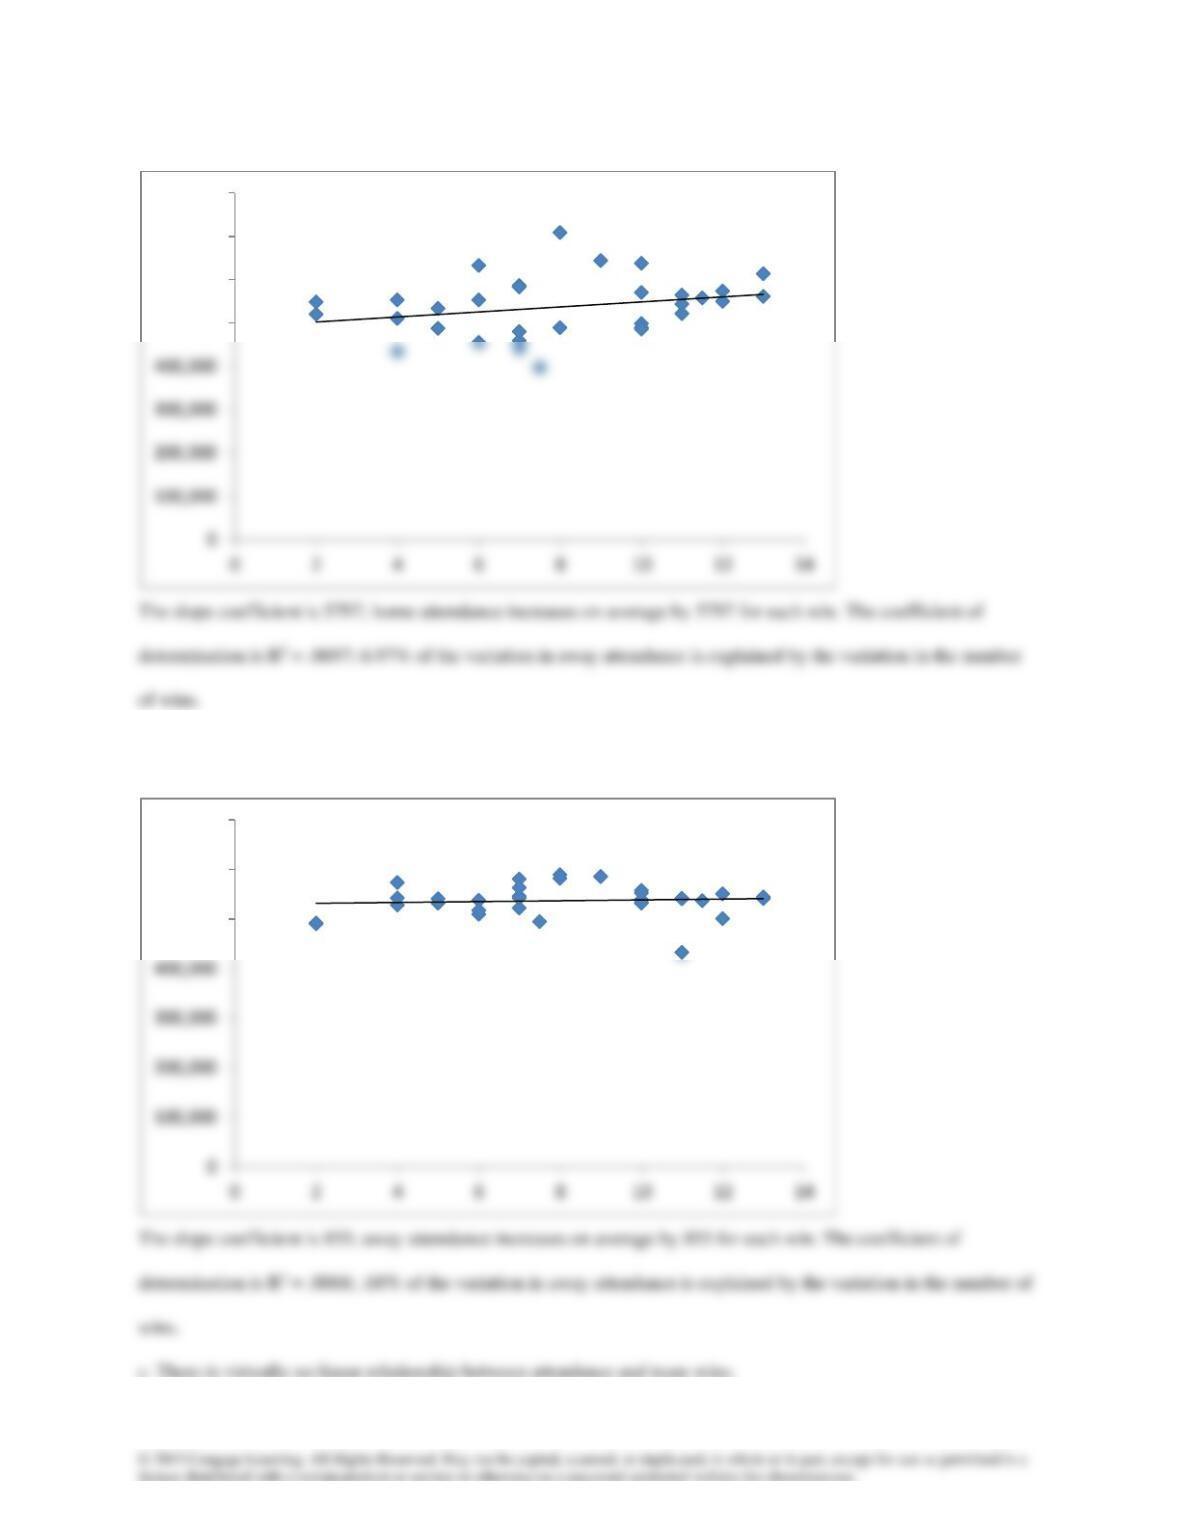
y = 5796.6x + 490457
R² = 0.0697
500,000
600,000
700,000
800,000
y = 855.4x + 529987
R² = 0.0068
500,000
600,000
700,000
4.82a
b
of wins.
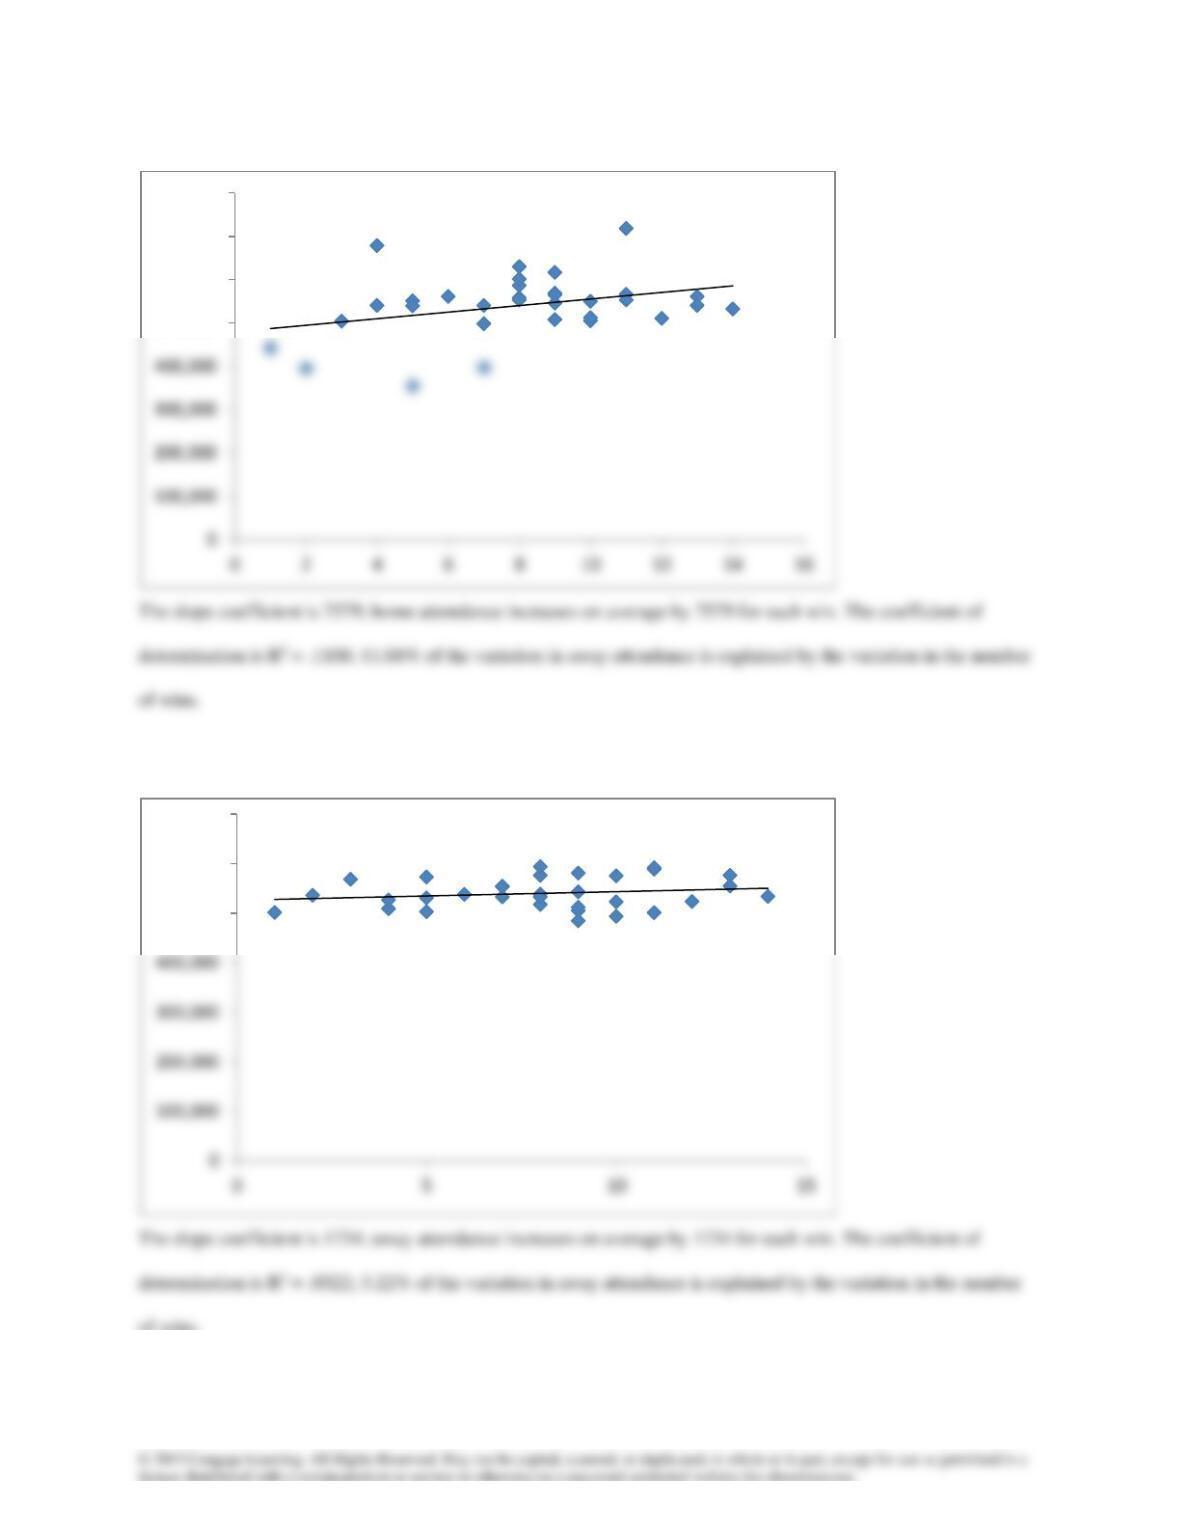
y = 7579x + 479350
R² = 0.1108
500,000
600,000
700,000
800,000
y = 1733.9x + 526199
R² = 0.0322
500,000
600,000
700,000
4.83
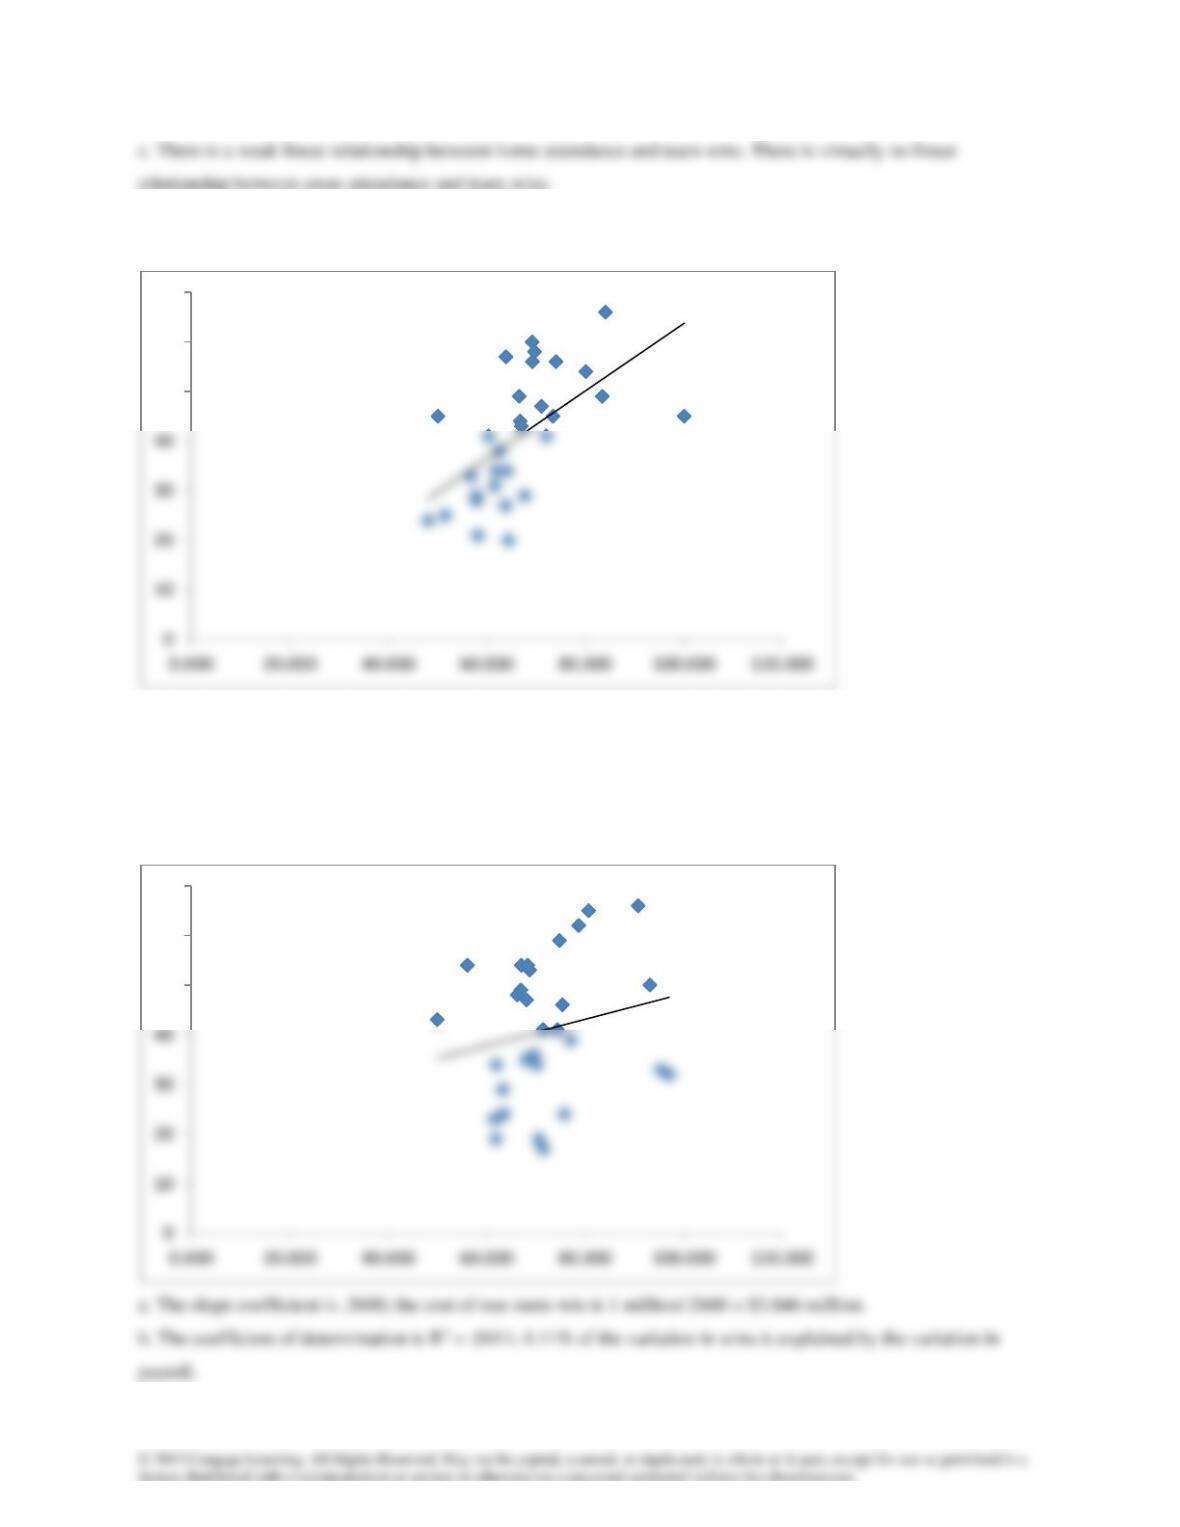
a. The slope coefficient is .6812; the cost of one more win is 1 million/.6812 = $1.468 million.
b. The coefficient of determination is R2 = .3335; 33.35% of the variation in wins is explained by the variation in
payroll.
4.84
y = 0.6812x – 4.4414
R² = 0.3335
50
60
70
y = 0.26x + 22.287
R² = 0.0411
50
60
70
4.85a
b
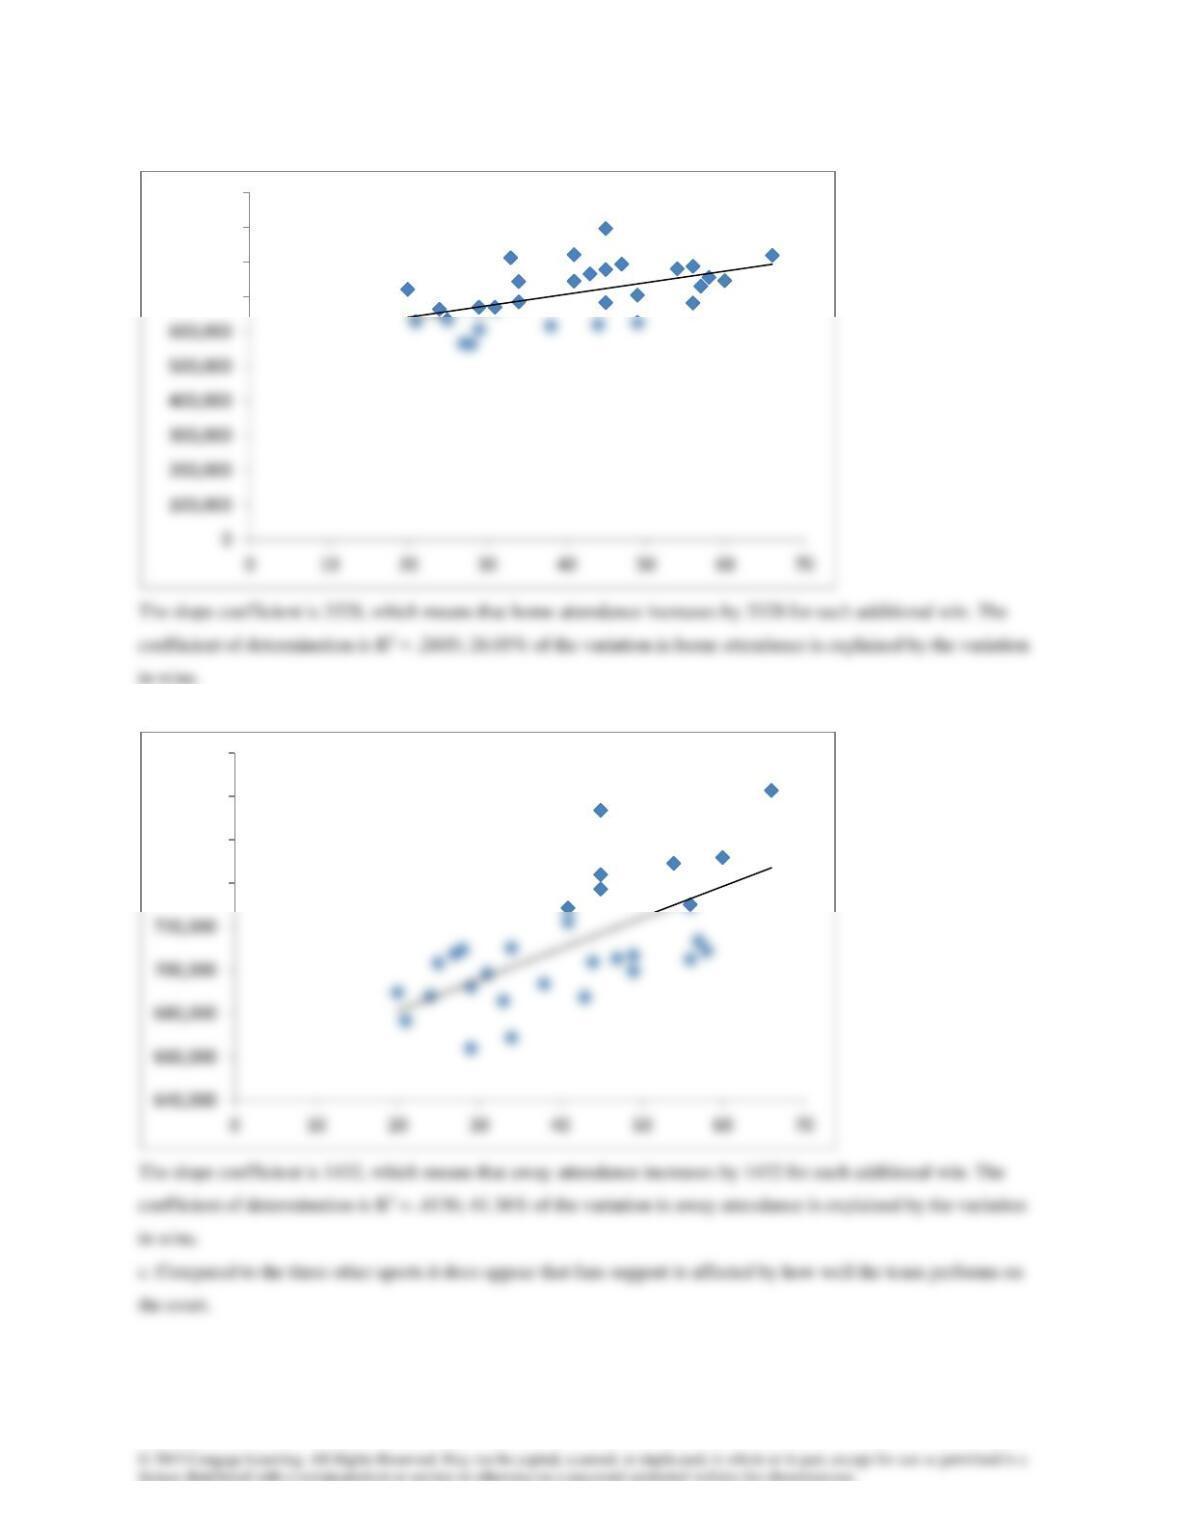
y = 3328.2x + 574331
R² = 0.2605
700,000
800,000
900,000
1,000,000
y = 1432.3x + 652547
R² = 0.4136
740,000
760,000
780,000
800,000
4.86a
b
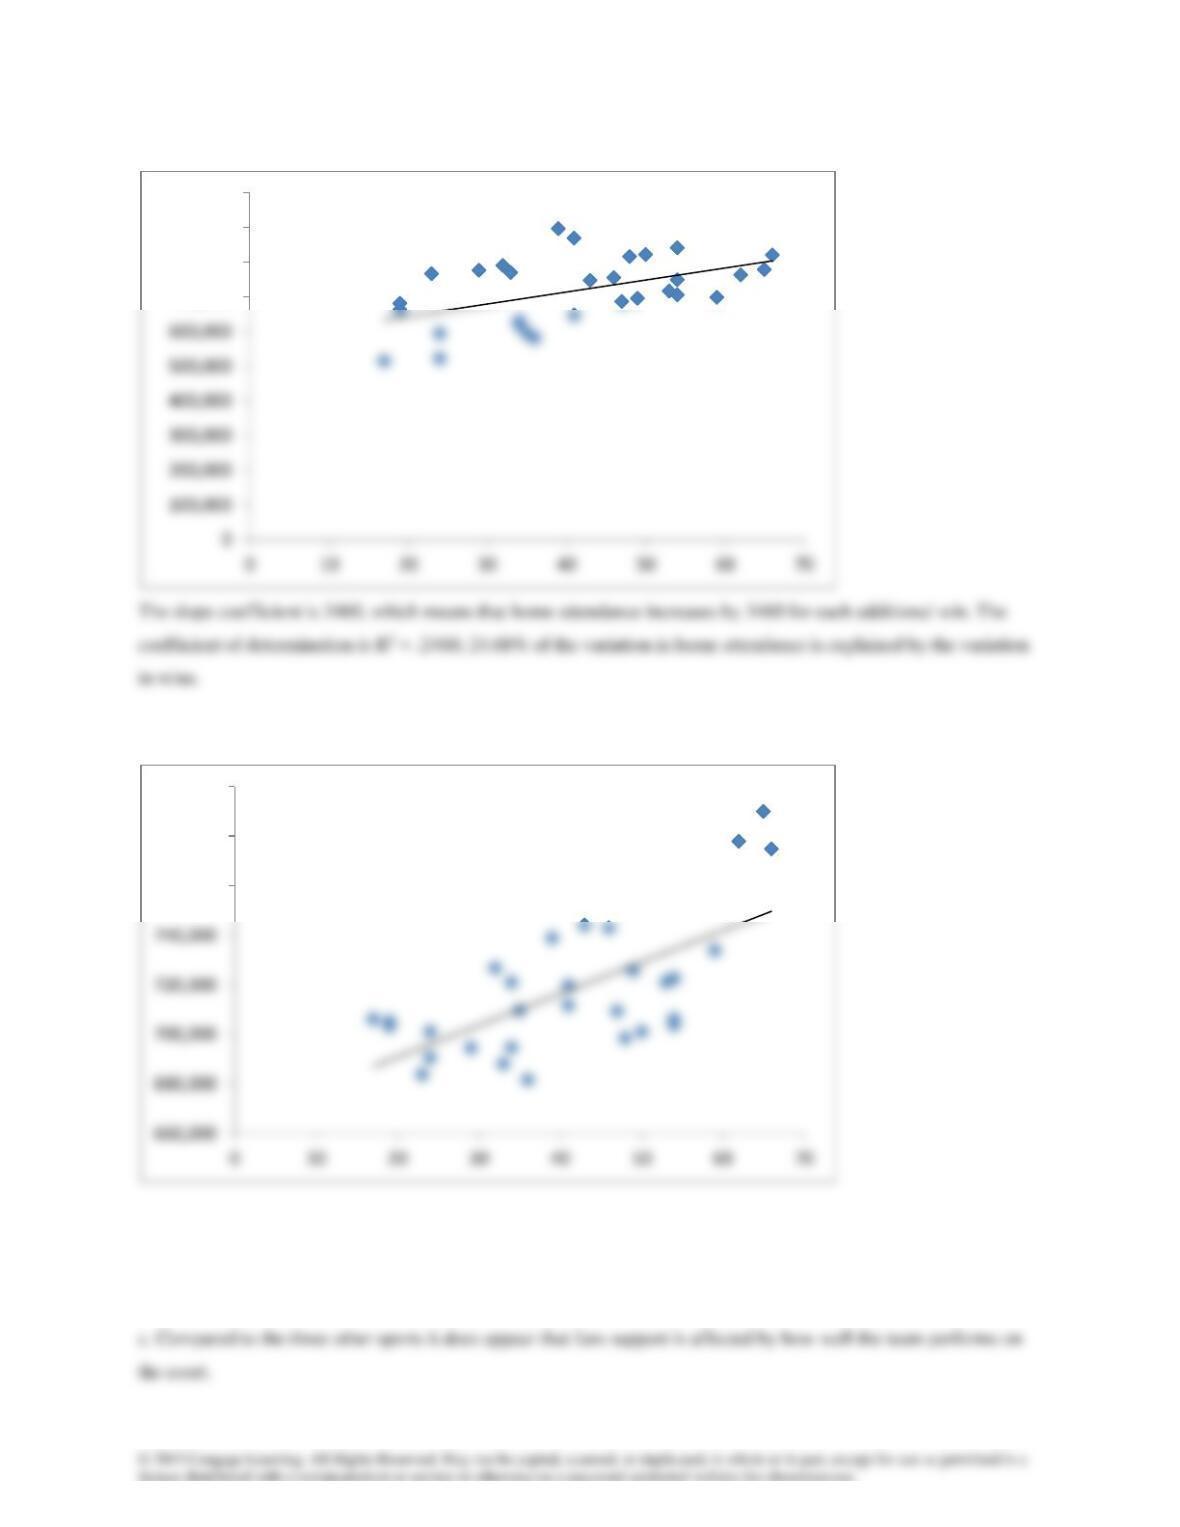
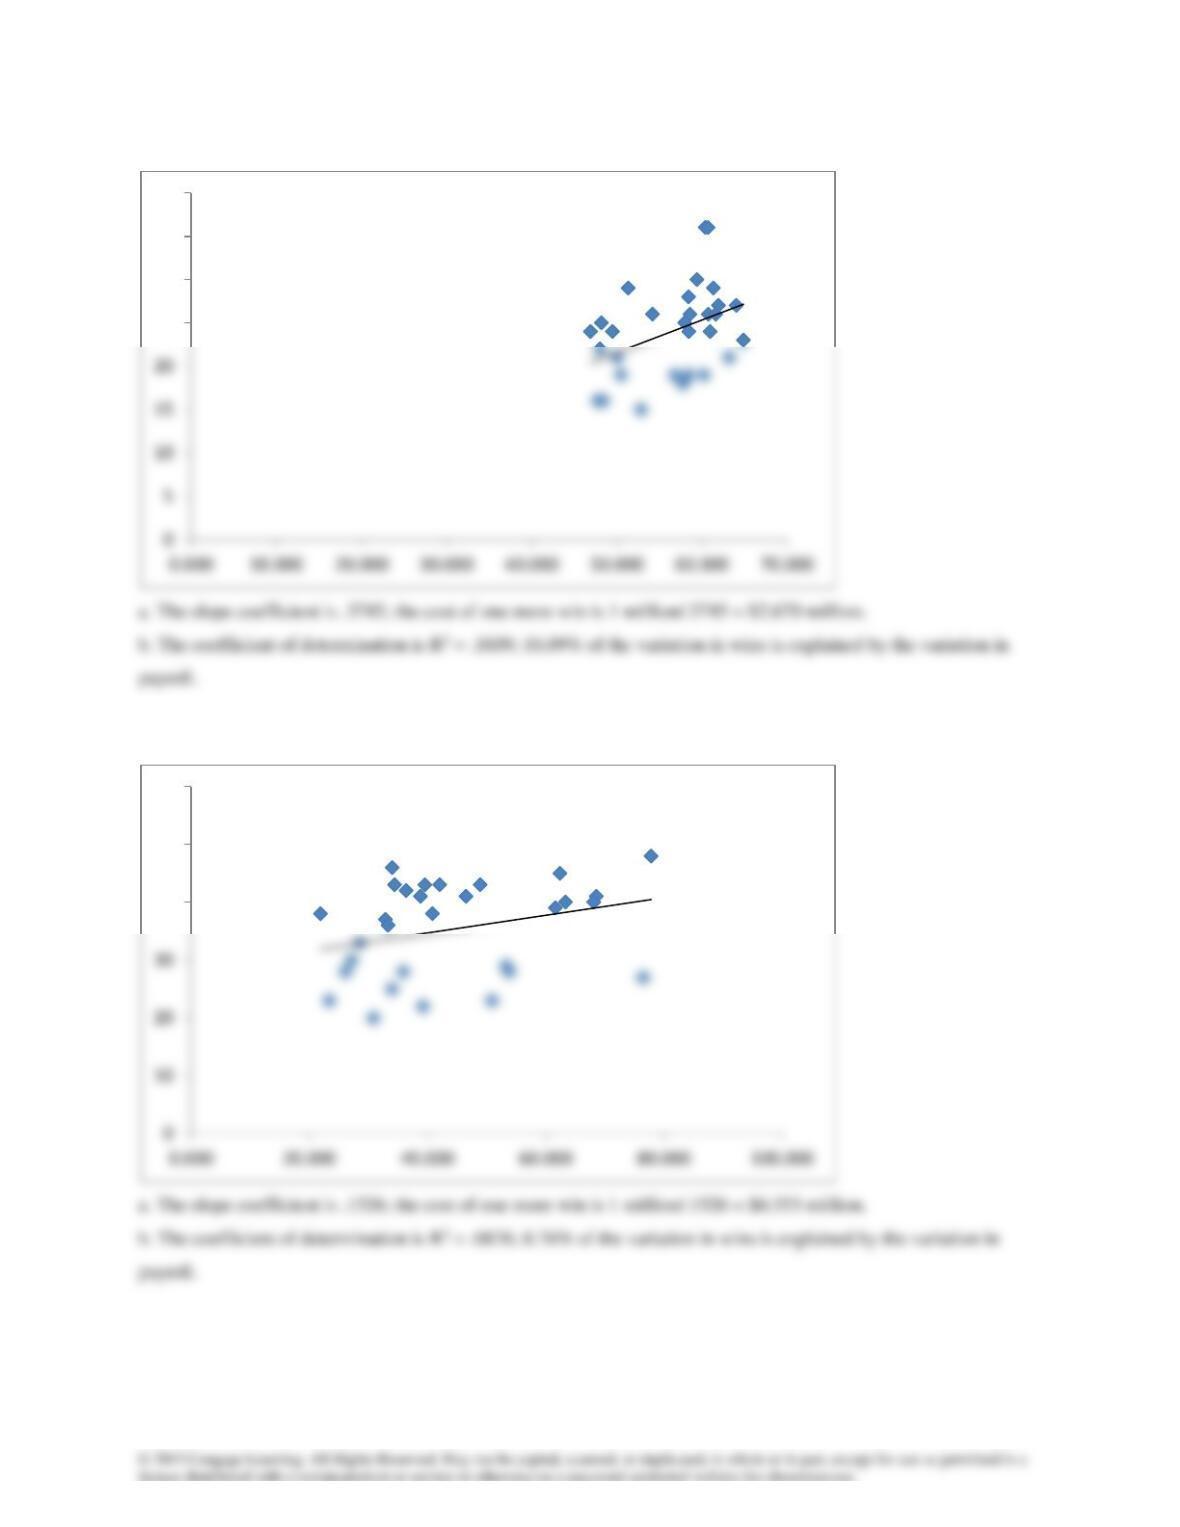
The slope coefficient is 1277, which means that away attendance increases by 1277 for each additional win. The
coefficient of determination is R2 = .4407; 44.07% of the variation in away attendance is explained by the variation
in wins.
y = 3460x + 575505
R² = 0.2468
700,000
800,000
900,000
1,000,000
y = 1277.2x + 665335
R² = 0.4407
760,000
780,000
800,000
4.87
4.88
y = 0.3745x + 2.8509
R² = 0.1609
25
30
35
40
y = 0.1526x + 28.559
R² = 0.0876
40
50
60
4.89a
b
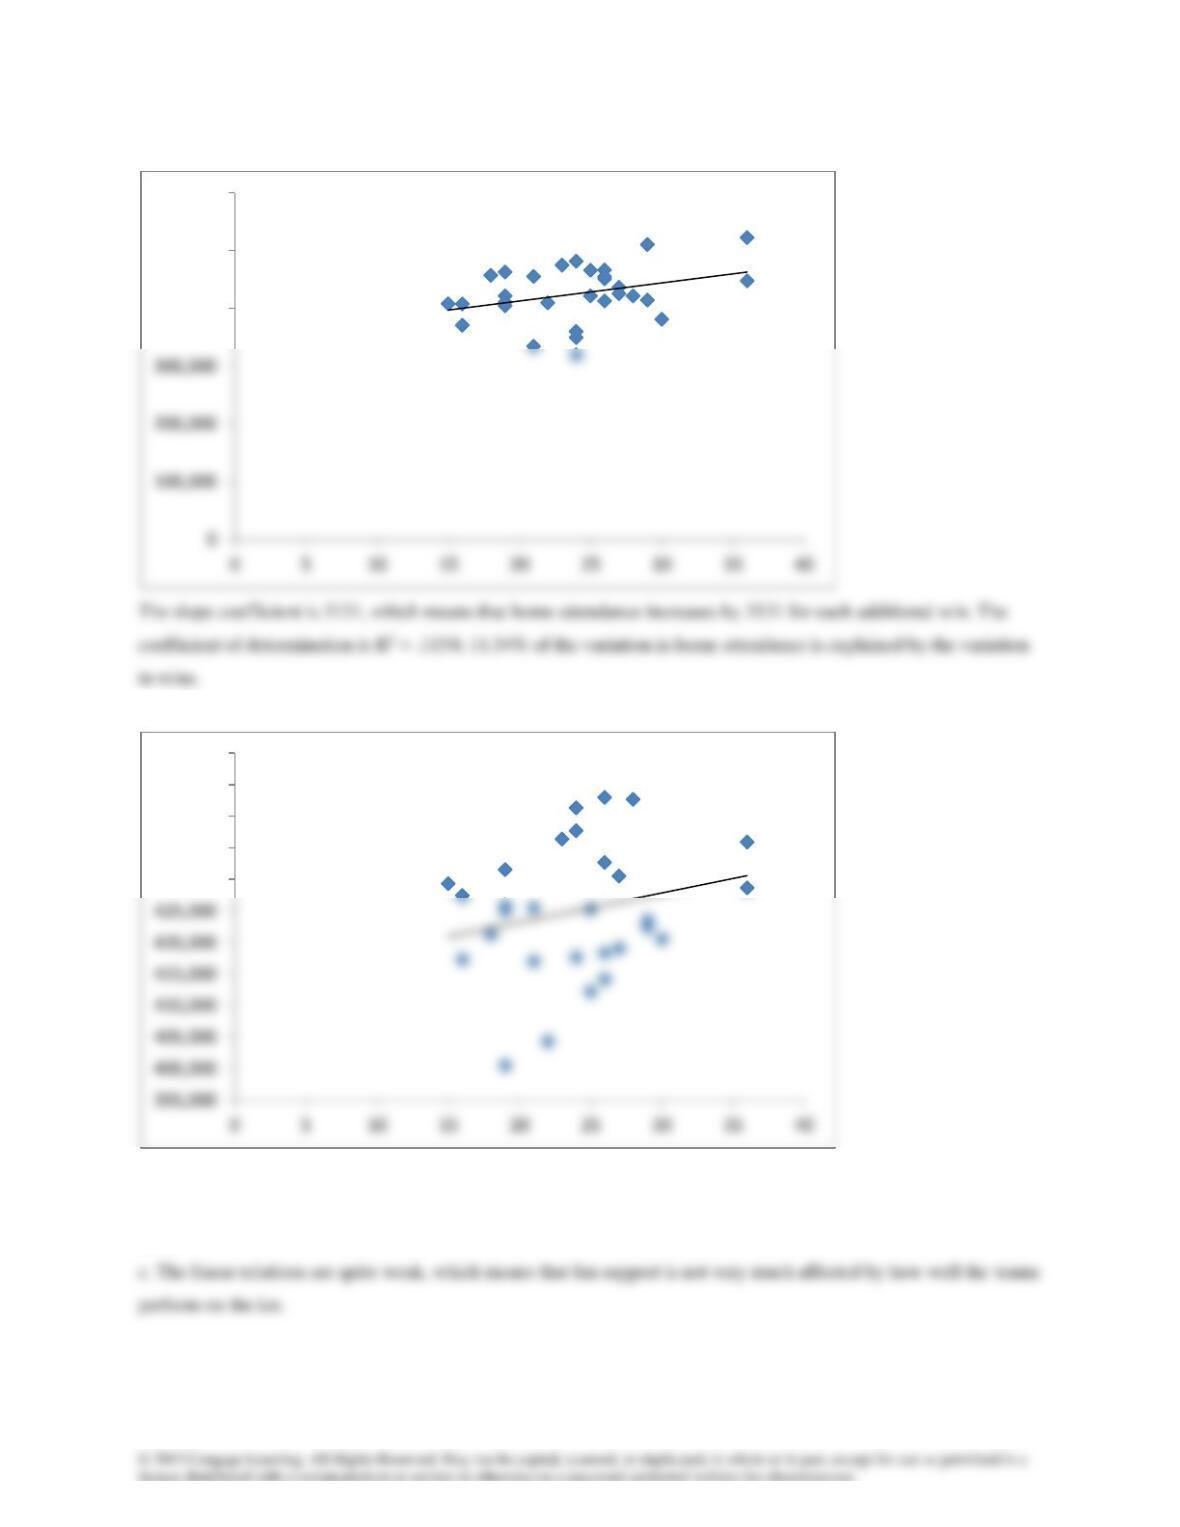
The slope coefficient is 459, which means that away attendance increases by 459 for each additional win. The
coefficient of determination is R2 = .0541; 5.41% of the variation in away attendance is explained by the variation in
wins.
y = 3131.3x + 350143
R² = 0.1154
400,000
500,000
600,000
y = 458.6x + 414055
R² = 0.0541
430,000
435,000
440,000
445,000
450,000
4.90a
b
y = 1509.4x + 663185
R² = 0.0231
700,000
800,000
900,000
1,000,000
y = 216.66x + 708844
R² = 0.0121
750,000
760,000
770,000
780,000
4.91
4.92 Correlation matrix
4.93 Correlation matrix
4.94 AXP: 1.8458, .4470
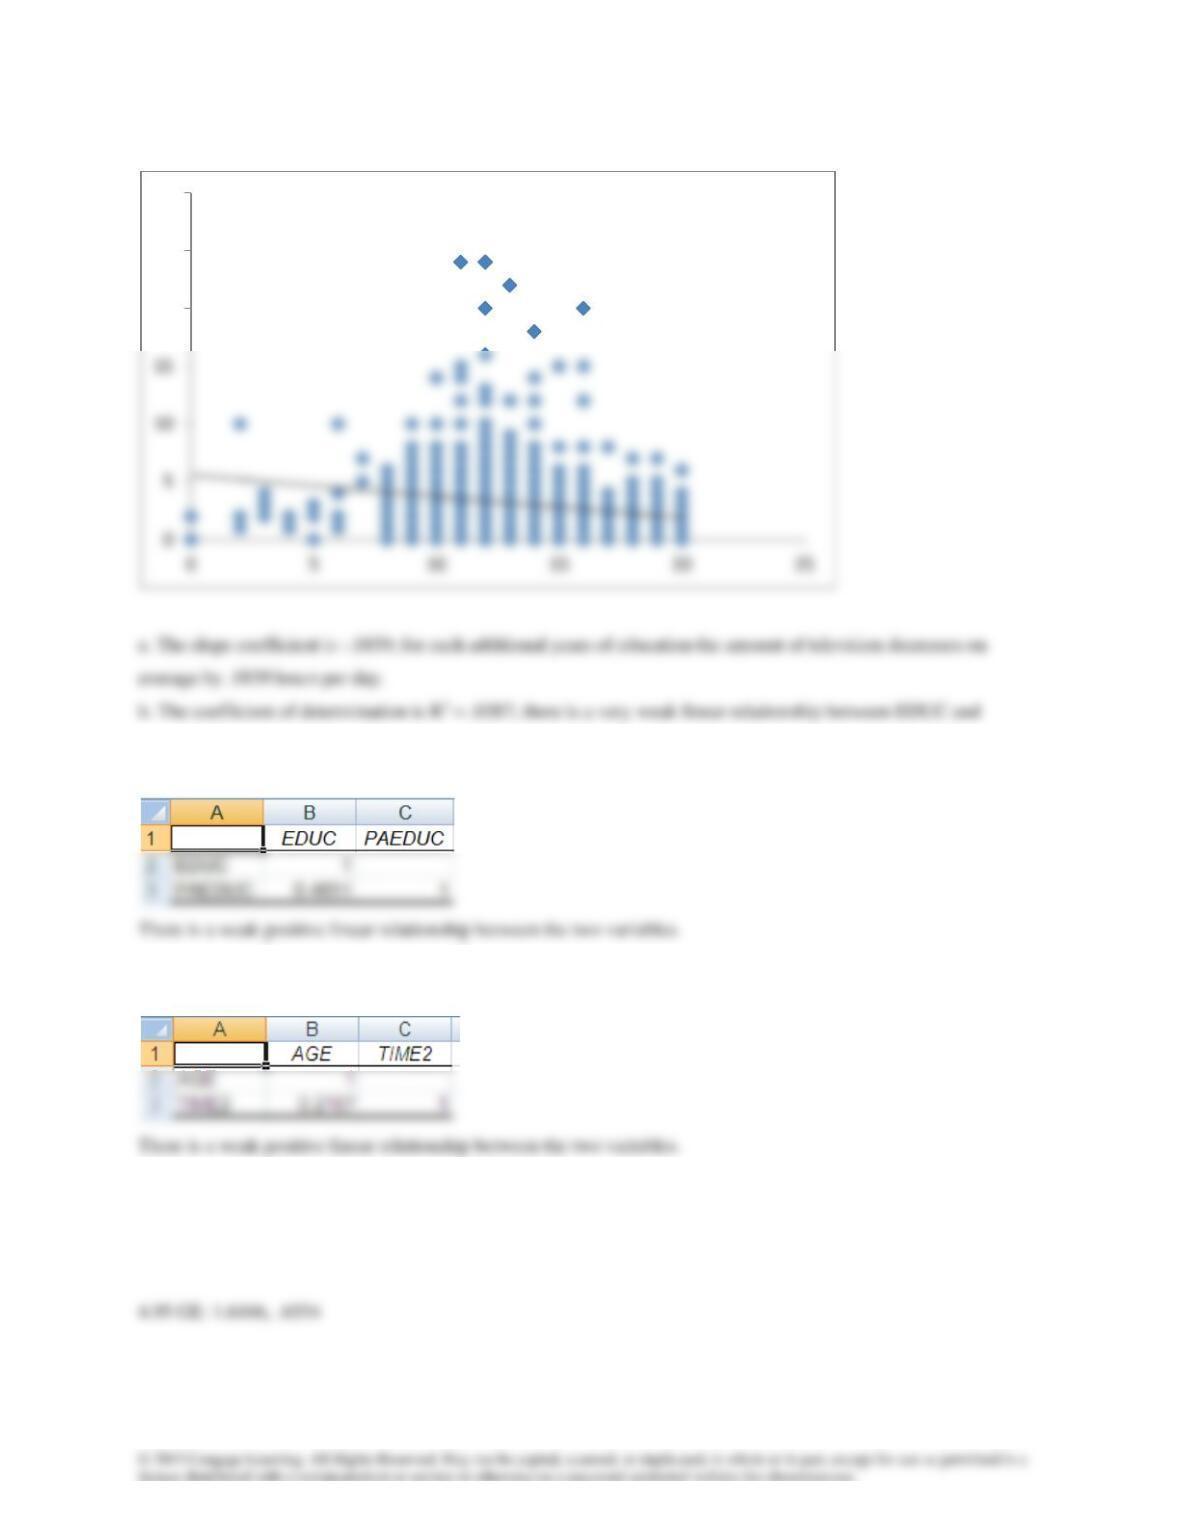
y = -0.1839x + 5.5864
R² = 0.0387
20
25
30
4.96 HD :.8741, .4343
4.97 MSFT: .9643, .5229
4.101 MRK: .5916; PFE: .7097; UNH: .9042; Mean = .7352
4.102ABX: 1.0005, .1604
4.106 ECA: 1.4072; ENB: .7414; SU: 1.7375; Mean = 1.2954
4.107 BCE: .7991; RCL.B: .4403: T: .3757; Mean = .5384
4.108 AMZN: .9488, .3139
4.112 COST: .5766; DLTR: .2858; SPLS: .9162; Mean = .5929
4.113 CSCO: 1.1480; INTC: .9637; ORCL: 1.4069; Mean = 1.1729
4.114
4.115
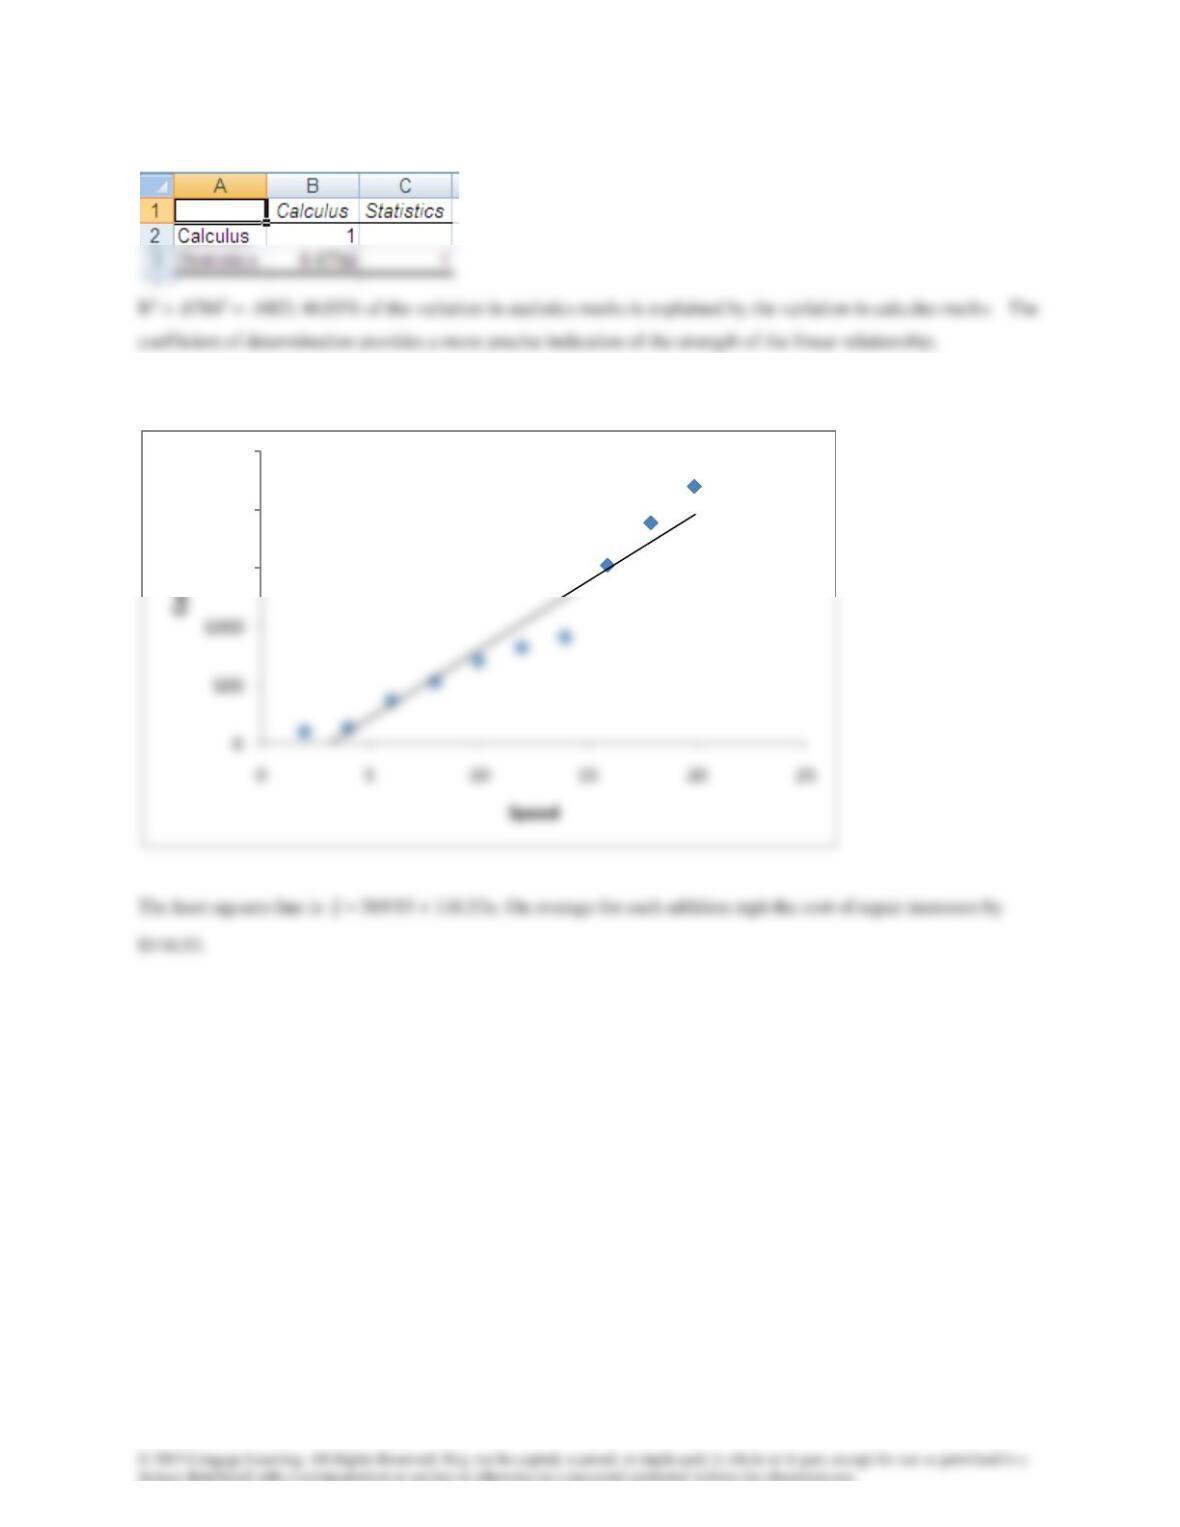
y = 116.53x – 369.93
R² = 0.9334
1500
2000
2500