Chapter 12
12.3 a
n/stx 2/
= 510
2.064(125/
25
) = 510
51.60; LCL = 458.40, UCL = 561.60
n/stx 2/
50
n/stx 2/
100
12.4 a
n/stx 2/
= 1,500
1.984(300/
100
) = 1,500
59.52; LCL = 1,440.48, UCL = 1,559.52
n/stx 2/
100
n/stx 2/
100
12.5 a
n/stx 2/
= 700
1.645(100/
400
) = 700
8.23; LCL = 691.77, UCL = 708.23
n/stx 2/
400
n/stx 2/
400
12.6 a
n/stx 2/
= 10
1.984(1/
100
) = 10
.20; LCL = 9.80, UCL = 10.20
n/stx 2/
100
n/stx 2/
100
12.7 a
n/stx 2/
= 120
2.009(15/
51
) = 120
4.22; LCL = 115.78, UCL = 124.22
n/stx 2/
51
n/stx 2/
51
12.8 a
n/stx 2/
= 63
1.990(8/
81
) = 63
1.77; LCL = 61.23, UCL = 64.77
n/stx 2/
64
d The interval widens.
12.9
:H0
= 20
:H1
> 20
a Rejection region:
9,05.1n, ttt = −
= 1.833
than 20.
c Rejection region:
= − 49,05.1n, ttt
1.676
12.10
:H0
= 180
:H1
180
Rejection region:
972.1ttt 199,025.1n,2/ −−=− −
or
199,025.1n,2/ ttt = −
= 1.972
12.11 Rejection region:
660.1ttt 99,05.1n, −−=− −
a
,00.1
100/50
150145
n/s
x
t−=
−
=
−
=
p-value = .1599. There is not enough evidence to infer that the population mean is
less than 150.
,00.2
100/50
n/s
=
=
than 150.
,00.3
100/50
150135
n/s
x
t−=
−
=
−
=
12.12
:H0
= 50
:H0
50
a Rejection region:
711.1ttt 24,05.1n,2/ −=−=− −
or
711.1ttt 24,05.1n,2/ == −
b Rejection region:
761.1ttt 14,05.1n,2/ −=−=− −
or
761.1ttt 14,05.1n,2/ == −
c Rejection region:
132.2ttt 4,05.1n,2/ −=−=− −
or
132.2ttt 4,05.1n,2/ −== −
d The test statistic decreases and the p-value increases.
12.13 Rejection region:
299.1ttt 49,10.1n, −−=− −
c
,79.
50/45
600595
n/s
x
t−=
−
=
−
=
p-value = .2179. There is not enough evidence to infer that the population mean is
less than 600.
d The test statistic increases and the p-value increases.
12.14 Rejection region:
364.2ttt 99,01.1n, = −
12.15 a
n/stx 2/
= 40
2.365(10/
8
) = 40
8.36; LCL = 31.64, UCL = 48.36
8
n/stx 2/
5
5
12.17 a
n/stx 2/
= 15,500
1.645(9,950/
000,1
) = 15,500
517.59; LCL = 14,982.41, UCL = 16,017.59
12.18 a
n/stx 2/
= 350
2.576(100/
500
) = 350
11.52; LCL = 338.48, UCL = 361.52
500
12.19
:H0
= 70
:H0
> 70
a Rejection region:
10,05.1n, ttt = −
= 1.812
12.20
:H0
= 110
:H0
< 110
a Rejection region:
9,10.1n, ttt −=− −
= –1.383
12.21
:H0
= 15
:H0
< 15
05.
12.22 a. Rejection region:
999,05.1n, ttt = −
= 1.645
b Rejection region:
05.
zzz =
= 1.645
,58.1
000,1/100
400405
n/s
x
t=
−
=
−
=
p-value = P( Z > 1.58) = 1 – .9429 = .0571. There is not enough evidence to infer
12.23
:H0
= 6
:H0
< 6
12.24
n/stx 2/
= 24,051
2.145(17,386/
15
) = 24,051
9,628; LCL = 14,422, UCL = 33,680
12.25
:H0
= 20
:H0
> 20
:H0
12.27
n/stx 2/
= 18.13
2.145(9.75/
15
) = 18.13
5.40; LCL = 12.73, UCL =23.53
n/stx 2/
n/stx 2/
12.30
:H0
= 10
:H0
< 10
12.31
n/stx 2/
= 7.15
1.972(1.65/
200
) = 7.15
.23; LCL = 6.92, UCL = 7.38
n/stx 2/
240
12.33
n/stx 2/
=17.00
1.975(4.31/
162
= 17.00
.67; LCL = 16.33, UCL = 17.67
Total number: LCL = 50 million (16.33) = 816.5 million, UCL = 50 million (17.67) = 883.5 million
n/stx 2/
n/stx 2/
12.36
n/stx 2/
= 2.67
1.973(2.50/
188
) = 2.67
.36; LCL = 2.31, UCL = 3.03
n/stx 2/
475
n/stx 2/
205
12.39
n/stx 2/
= 3.79
1.960(4.25/
564
) = 3.79
.35; LCL = 3.44, UCL = 4.14
Package of 10: LCL = 13.65(10) = 136.5 days, UCL = 14.23(10) = 142.3 days.
12.41
n/stx 2/
= 4.34
1.960(4.22/
950
) = 4.34
.27; LCL = 4.07, UCL = 4.61
Total number of visits: LCL = 307,439,000(4.07) = 1,251,276,730 UCL = 307,439,000 (4.61) = 1,417,293,790
12.43
n/stx 2/
= 15.02
1.990(8.31/
83
) = 15.02
1.82; LCL = 13.20, UCL = 16.84
n/stx 2/
12.45
n/stx 2/
= 1.507
1.645(.640/
473
) = 1.507
.048; LCL = 1.459, UCL = 1.555
12.46
12.47 H0: μ = 12
H1: μ > 12
12.48
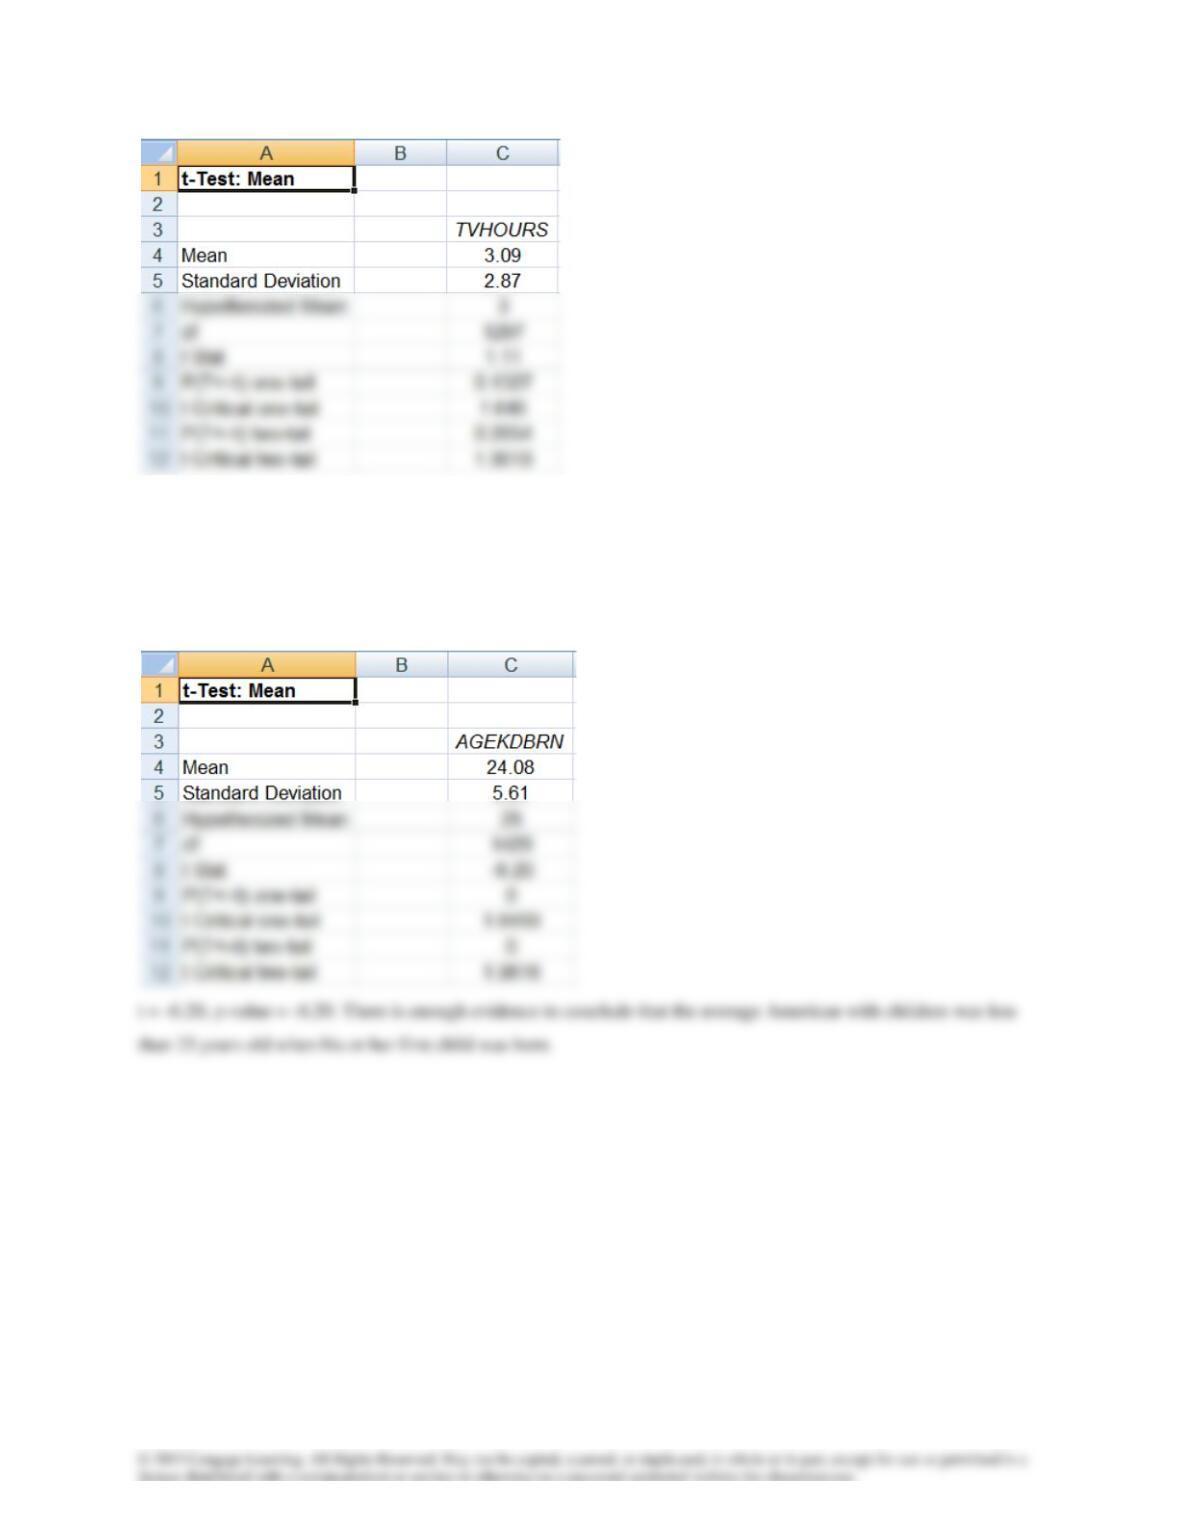
12.49 H0: μ = 40
H1: μ > 40
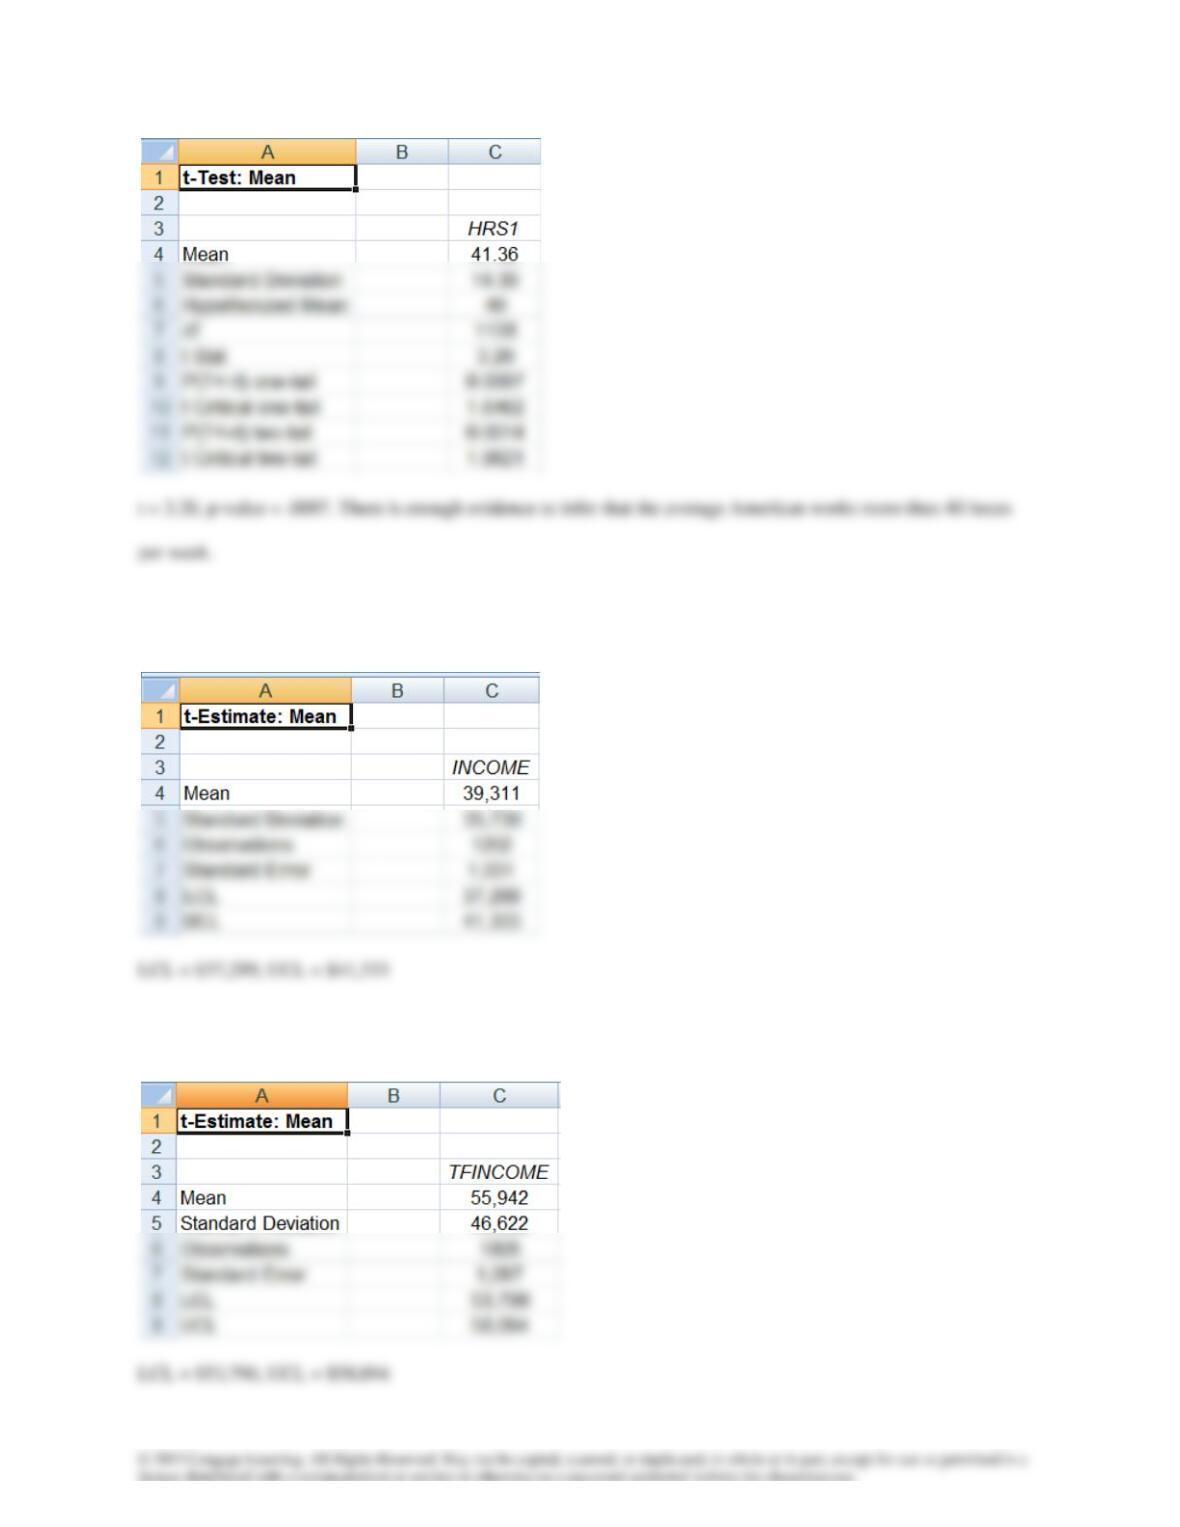
t = .6012, p-value = .2739. There is not enough evidence to infer that the mean number of hours worked (HRS1)
among those working full or part time is greater than 40.
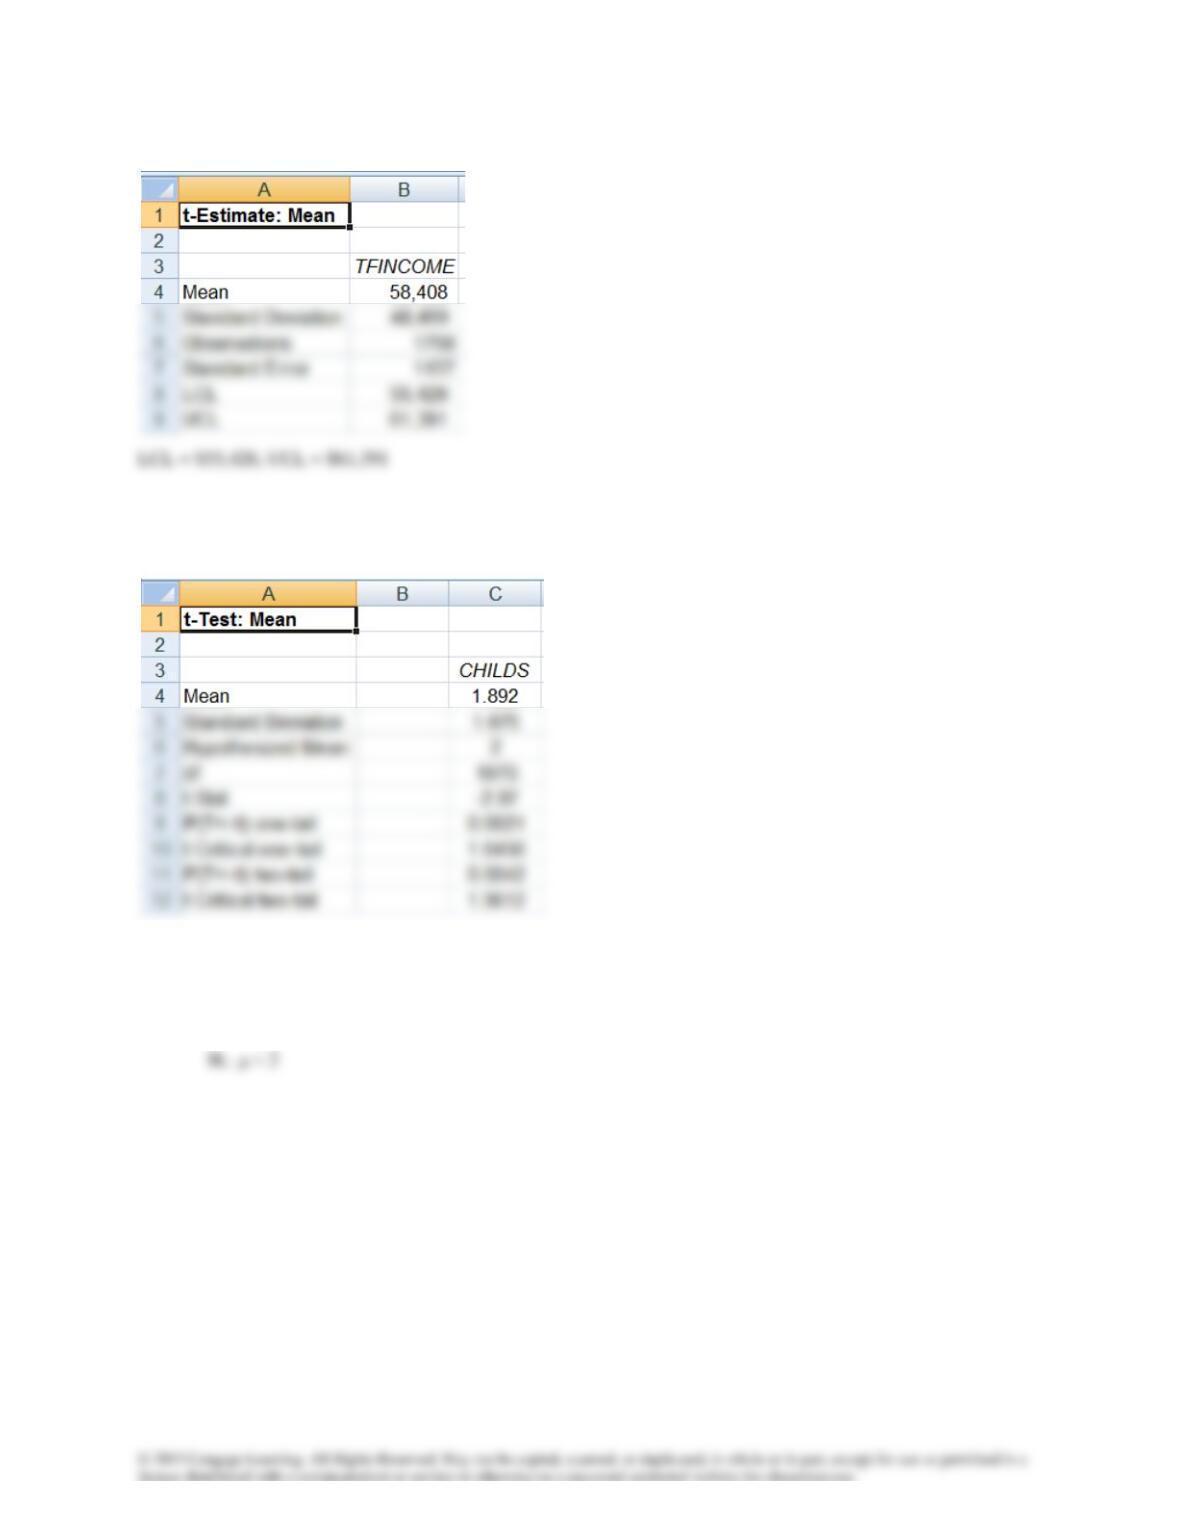
t = 1.11, p-value = .1327. There is not sufficient evidence to infer that the average American watches more than 24
hours per week, which is 3 hours per day.
12.51 H0: μ = 25
H1: μ < 25
12.52
12.53 H0: μ = 2
H1: μ < 2
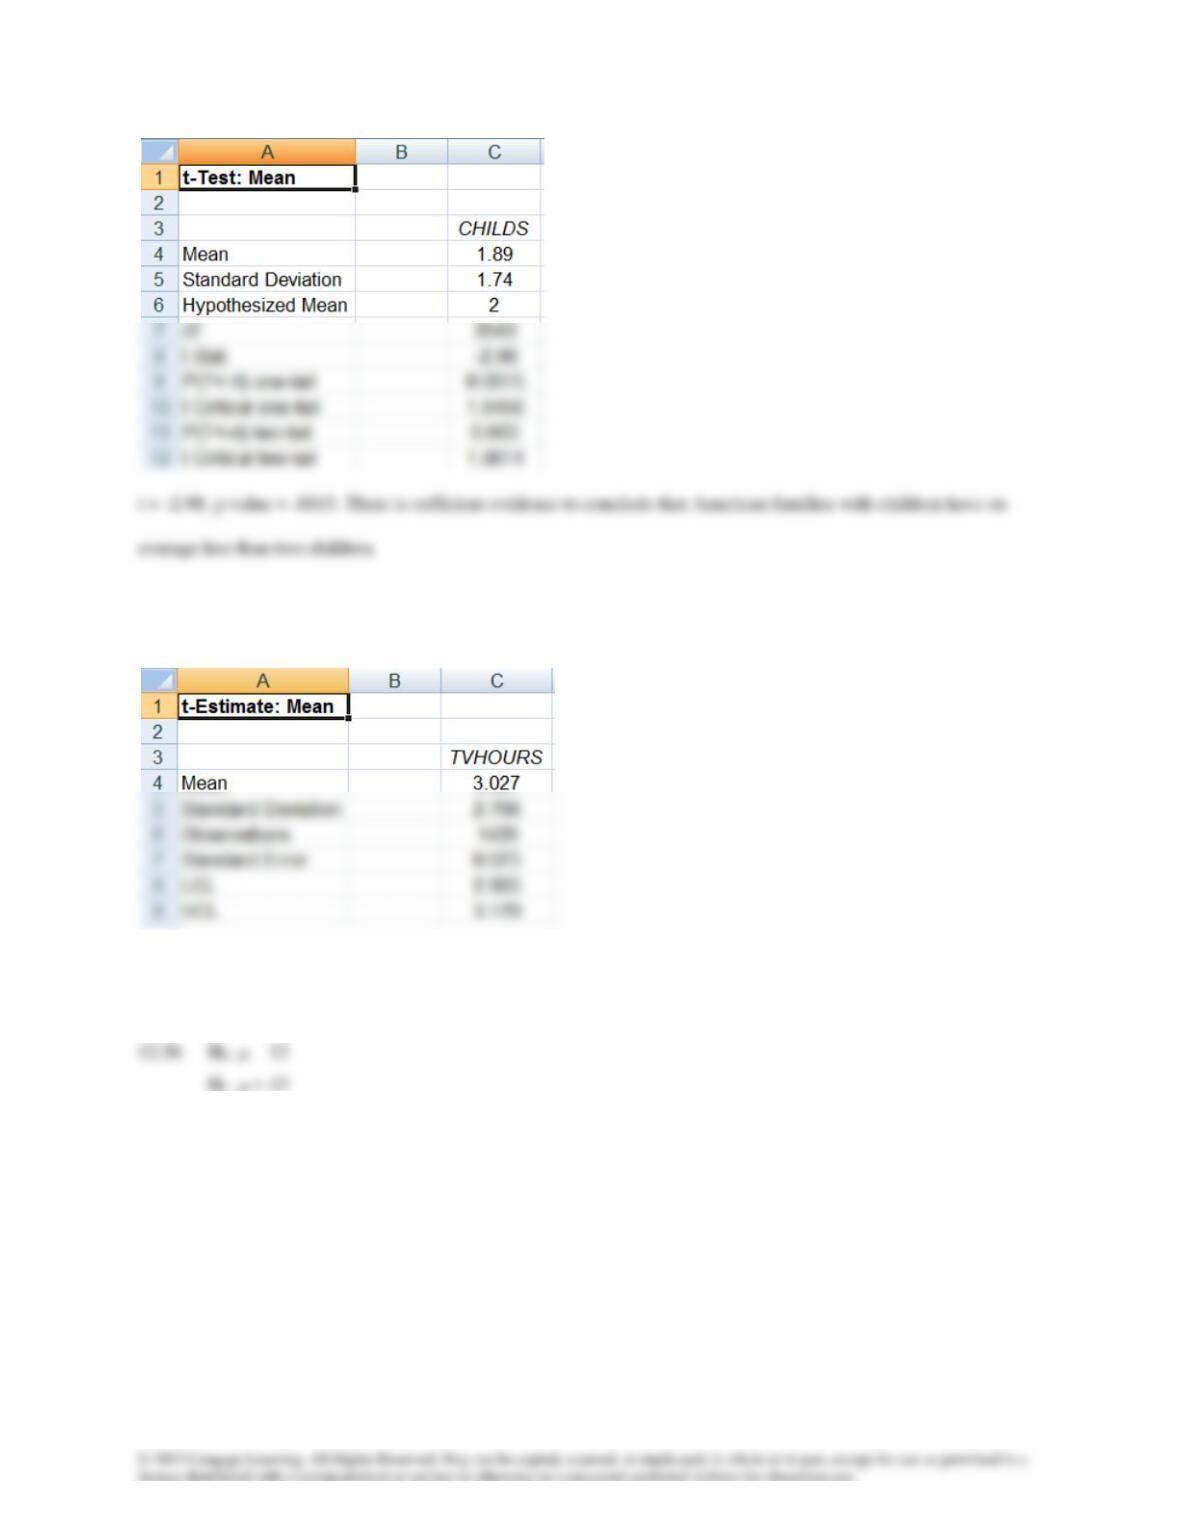
t = -2.87, p-value = .0021. There is enough evidence to infer that Americans have on average less than two children.
12.54 H0: μ = 2
12.55
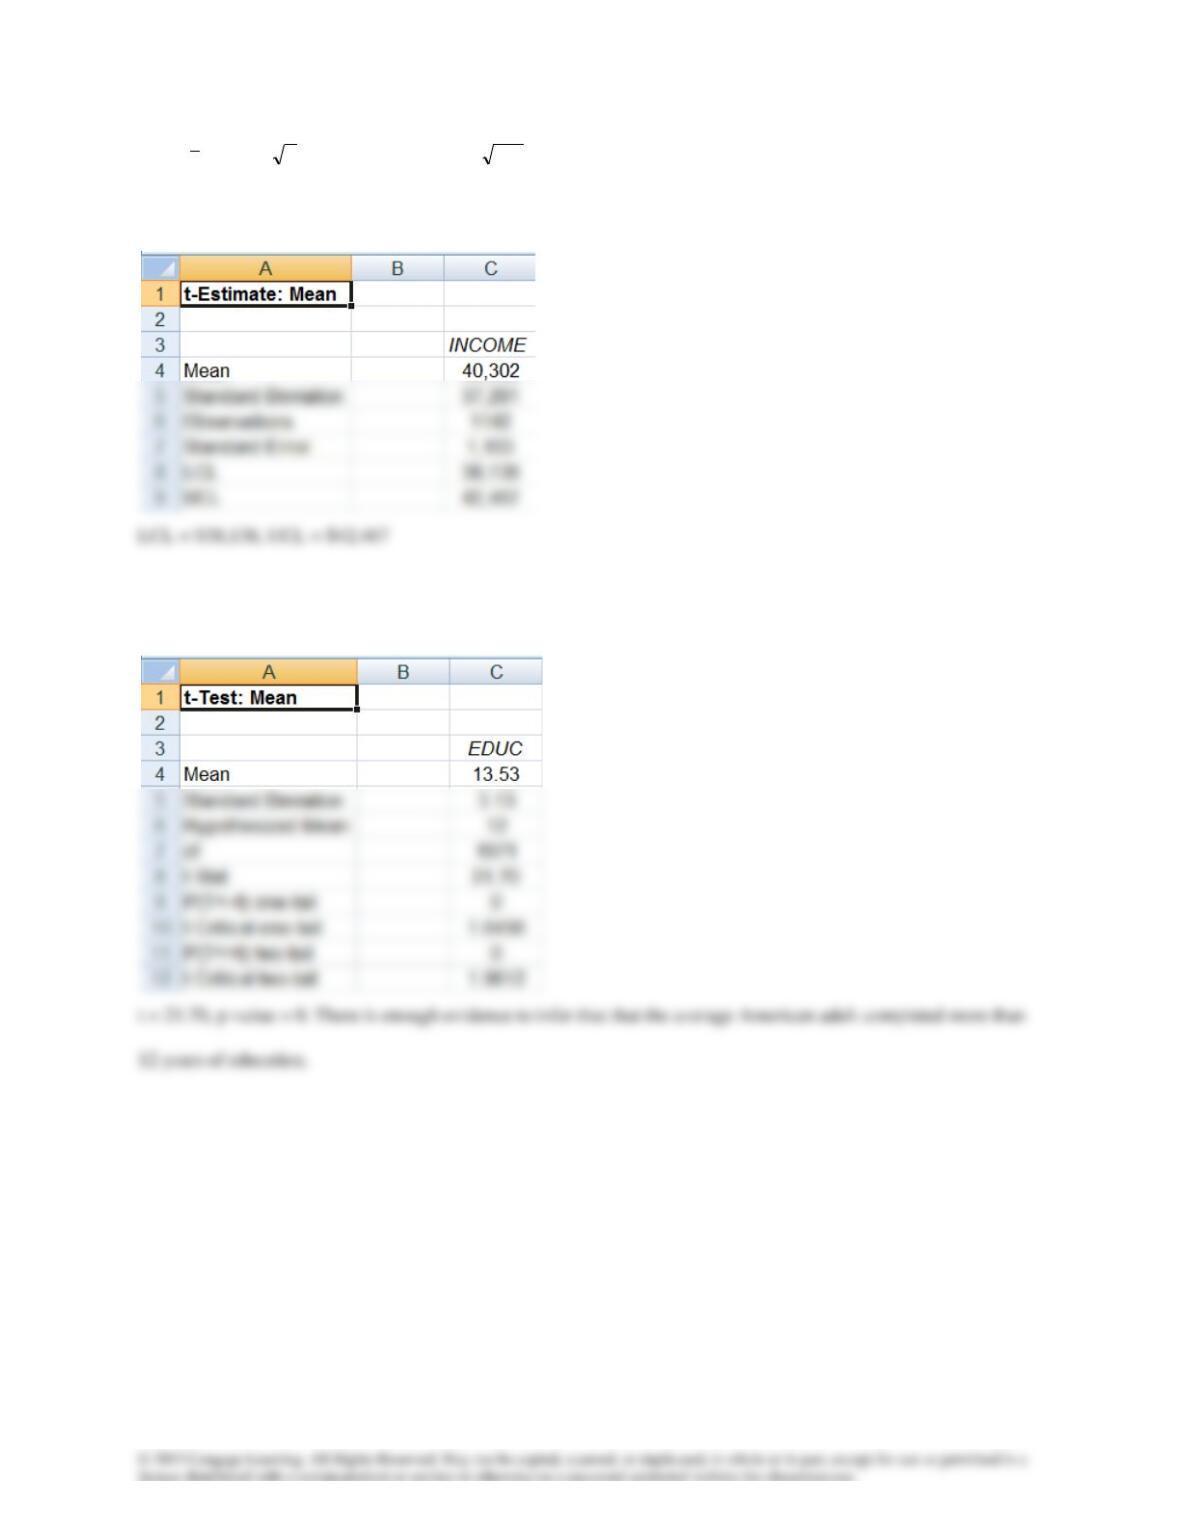
LCL = 2.883, UCL = 3.170
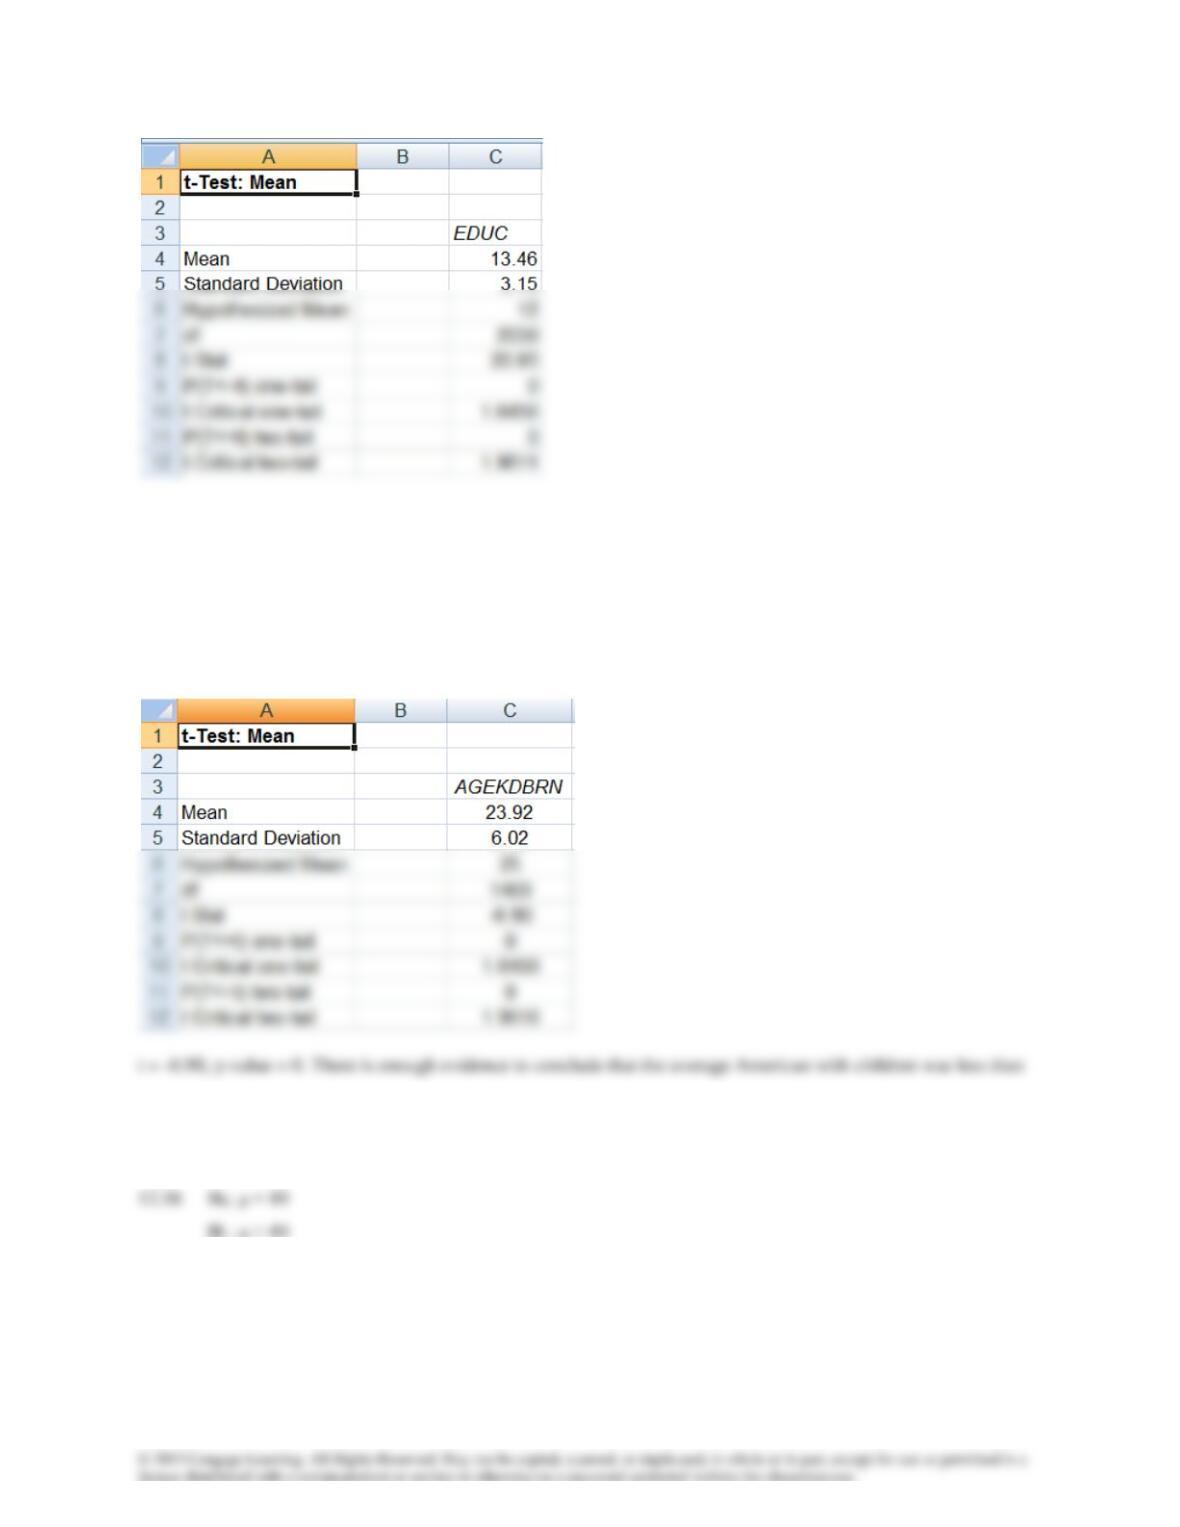
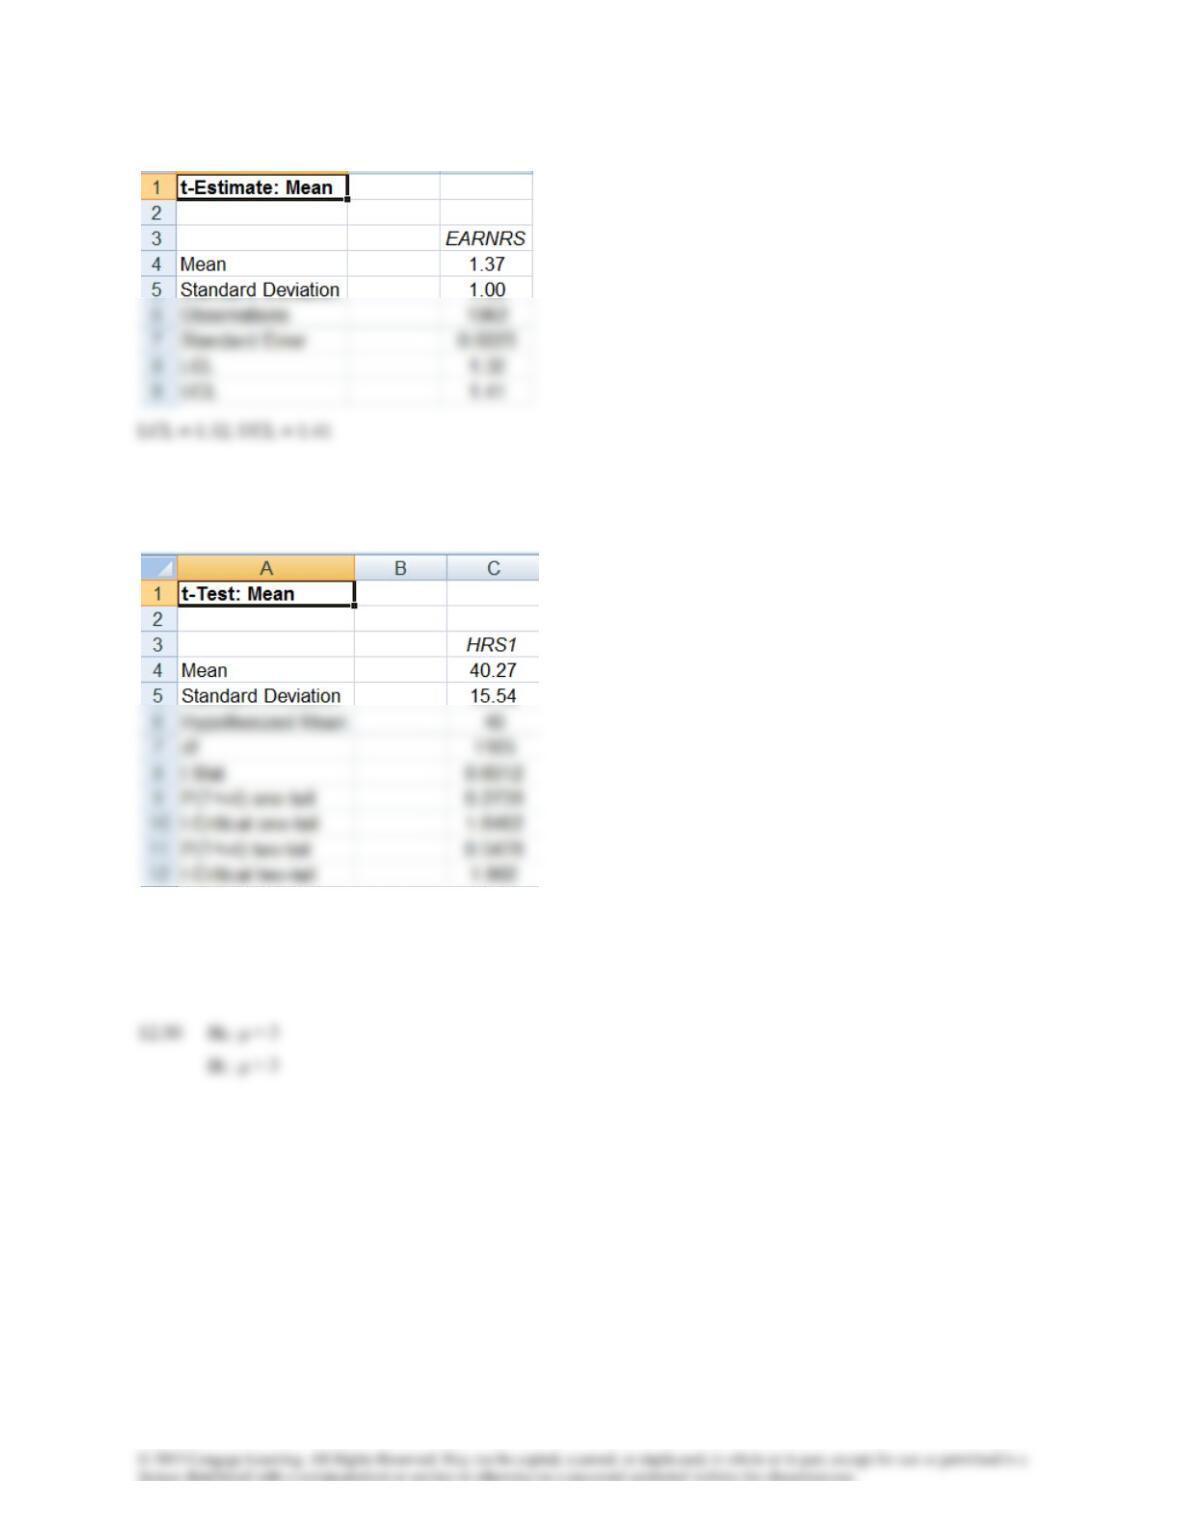
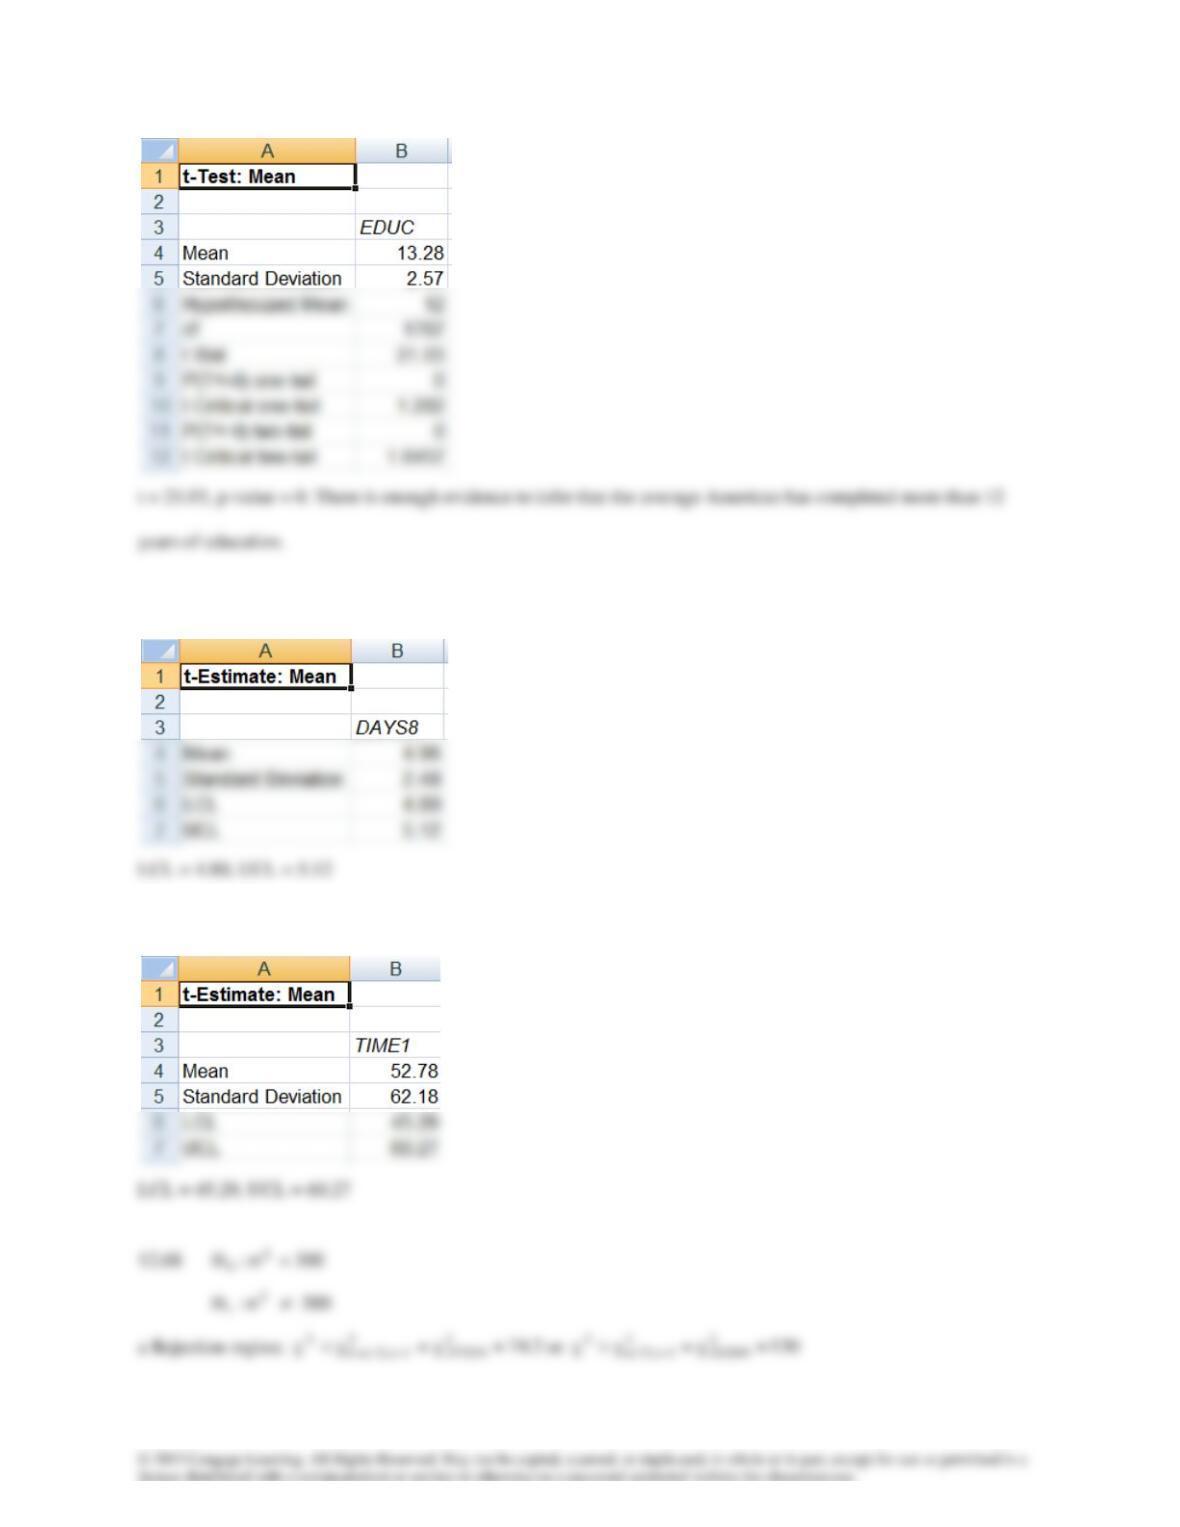
t = 20.95, p-value = 0. There is sufficient evidence to infer that the average American has more than 12 years of
education.
12.57 H0: μ = 25
H1: μ < 25
25 years old when his or her first child was born.
12.59
12.60
12.61
12.62 H0: μ = 2
H1: μ < 2
12.63 H0: μ = 12
H1: μ > 12
12.64
12.65
2
2
2s)1n(
−
=
=
300
)220)(1100( −
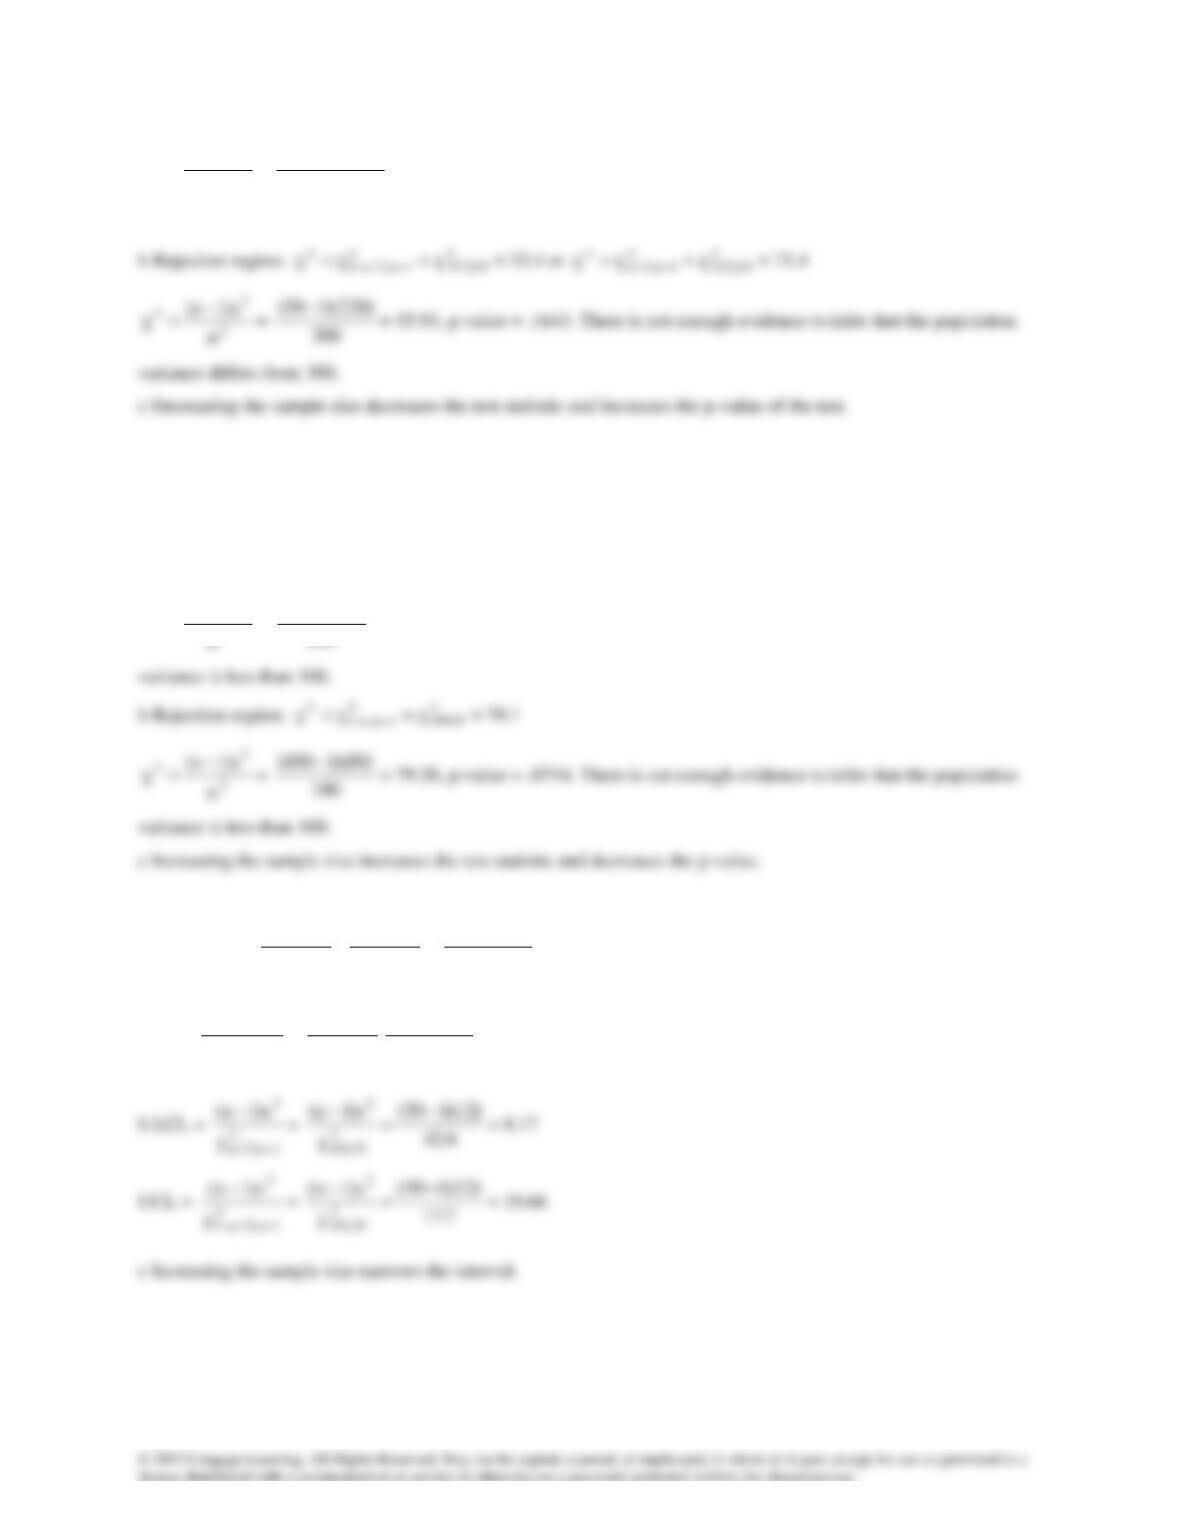
= 72.60, p-value = .0427. There is enough evidence to infer that the population
variance differs from 300.
2
2
2s)1n(
−
=
12.69
2
0:H
= 100
2
1:H
< 100
a Rejection region:
7.29
2
49,99.
2
1n,1
2= −−
2
2
2s)1n(
−
=
2
2
2s)1n(
−
=
=
100
)80)(150(−
= 39.20, p-value = .1596. There is not enough evidence to infer that the population
12.70 a LCL =
2
1n,2/
2
s)1n(
−
−
=
2
14,05.
2
s)1n(
−
=
7.23
)12)(115(−
= 7.09
UCL =
2
1n,2/1
2
s)1n(
−−
−
=
2
14,95.
2
s)1n(
−
57.6
)12)(115(−
= 25.57
2
1n,2/1
2
s)1n(
−−
−
2
29,95.
2
s)1n(
−
12.71 LCL =
2
1n,2/
2
s)1n(
−
−
=
2
7,05.
2
s)1n(
−
=
1.14
)00093)(.18( −
= .00046,
2
1n,2/1
2
s)1n(
−−
−
2
7,95.
2
s)1n(
−
)00093)(.18( −
2
2
2s)1n(
−
=
=
,57.7
250
)22.210)(110(=
−
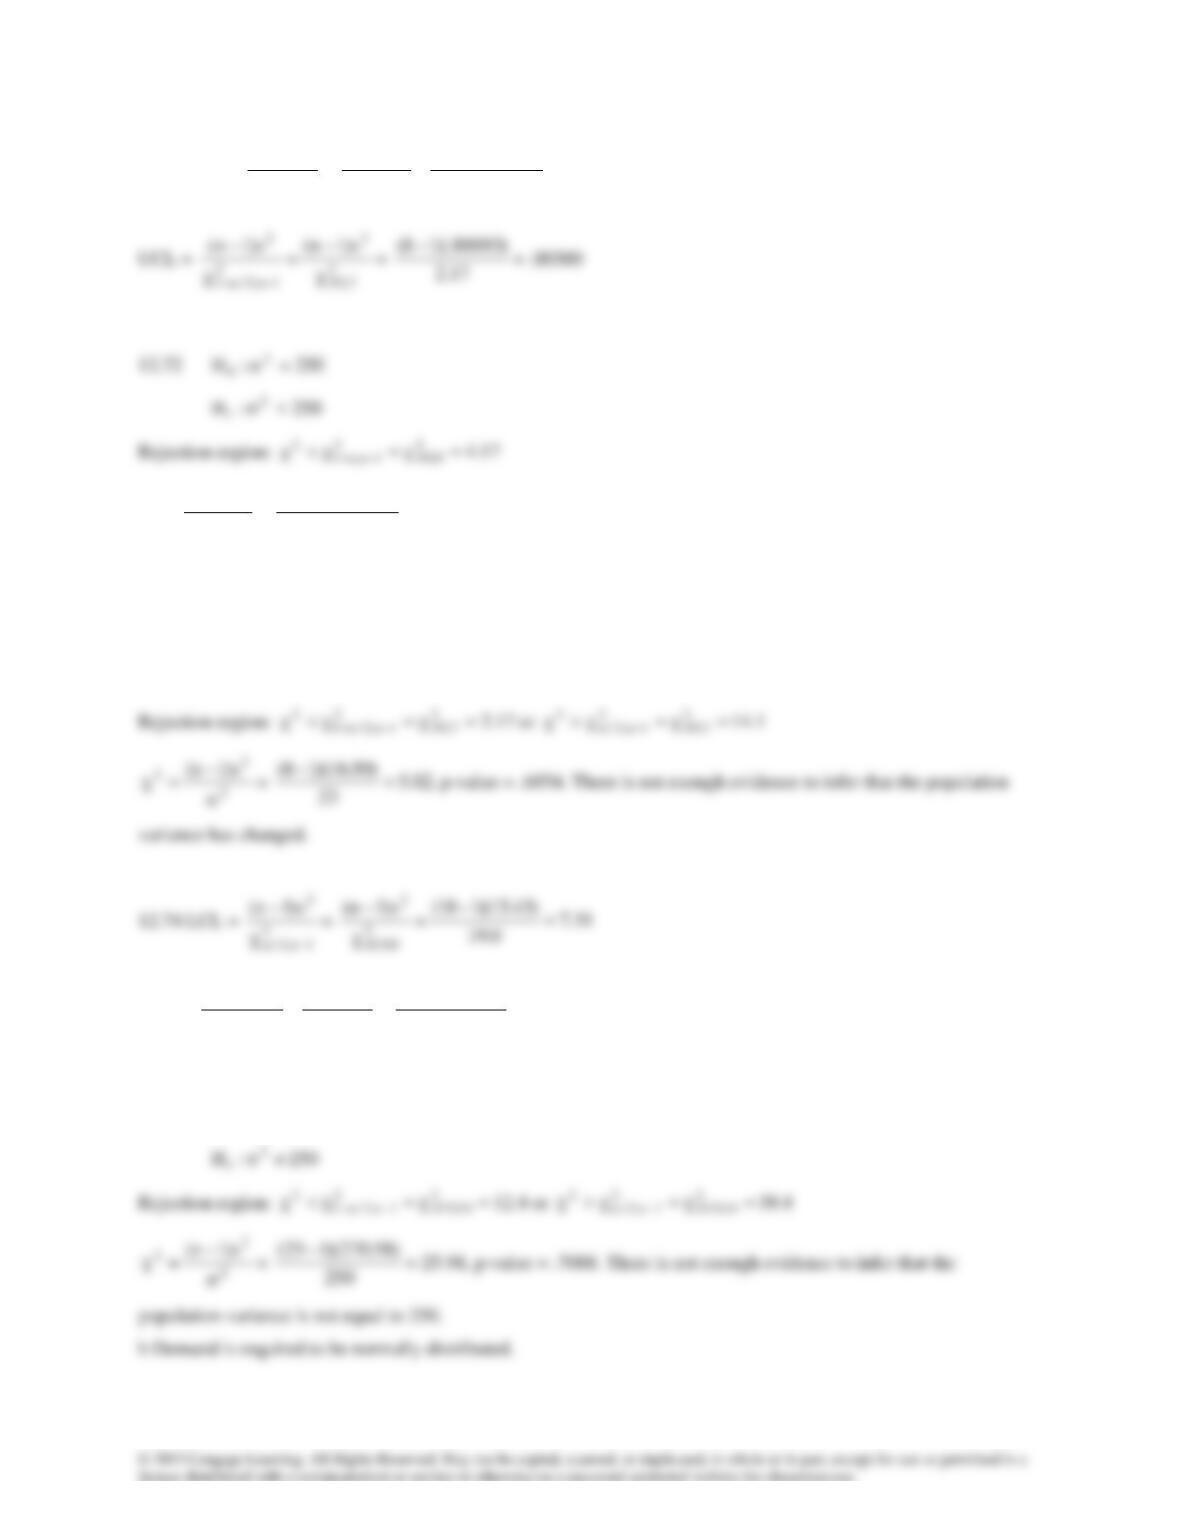
p-value = .4218. There is not enough evidence to infer that the population
variance has decreased.
12.73
2
0:H
= 23
2
1:H
23
2
1n,2/
2
s)1n(
−
−
2
9,025.
2
s)1n(
−
UCL =
2
1n,2/1
2
s)1n(
−−
−
=
2
9,975.
2
s)1n(
−
=
43.51
70.2
)43.15)(110(=
−
12.75 a
2
0:H
= 250
c The histogram (not shown here) is approximately bell shaped.
12.76
2
0:H
= 18
2
1:H
18
12.77 LCL =
2
1n,2/
2
s)1n(
−
−
=
2
89,05.
2
s)1n(
−
=
72.3
113
)72.4)(190(=
−
2
89,95.
2
s)1n(
−
12.78
2
0:H
= 200
2
1:H
200
12.79 LCL =
2
1n,2/
2
s)1n(
−
−
=
2
24,025.
2
s)1n(
−
=
99.11
4.39
)68.19)(125(=
−
2
s)1n(
−