Archives: Quiz
EMBA 366
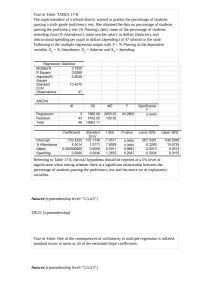
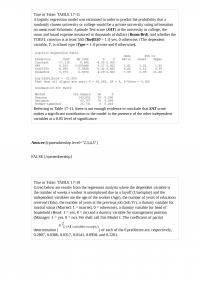
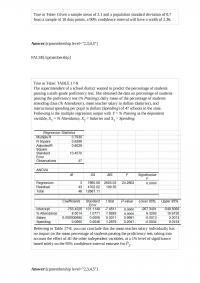
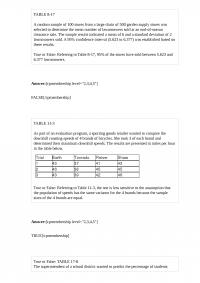
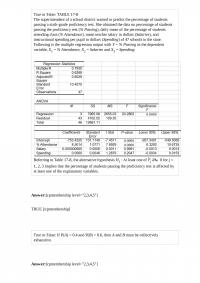
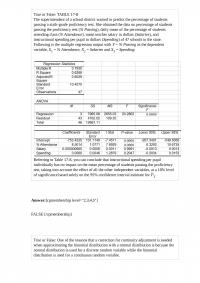
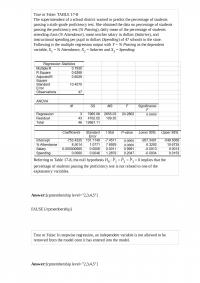
True or False: TABLE 17-8 The superintendent of a school district wanted to predict the percentage of students passing a sixth-grade proficiency test. She obtained the data on percentage of students passing the proficiency test (% Passing), daily mean of […]
MGT 353 Midterm 2
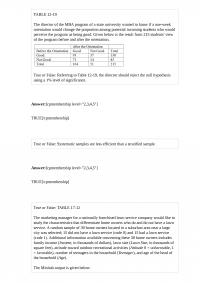
TABLE 12-19 The director of the MBA program of a state university wanted to know if a one-week orientation would change the proportion among potential incoming students who would perceive the program as being good. Given below is the result […]
BUS 105 Midterm
True or False: Selection bias occurs more frequently in systematic samples than in simple random samples. True or False: Suppose, in testing a hypothesis about a mean, the Z test statistic is computed to be 2.04. The null hypothesis should […]
MGMT 236
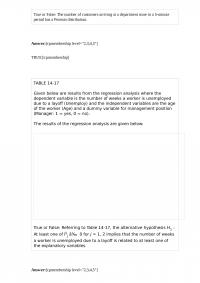
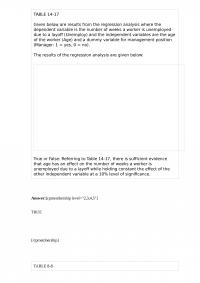
True or False: The number of customers arriving at a department store in a 5-minute period has a Poisson distribution. TABLE 14-17 Given below are results from the regression analysis where the dependent variable is the number of weeks a […]
BUA 811
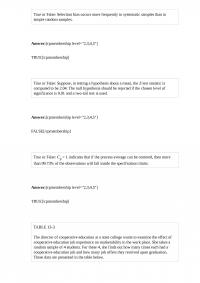
TABLE 9-9 The president of a university claimed that the entering class this year appeared to be larger than the entering class from previous years but their mean SAT score is lower than previous years. He took a sample of […]

PRST 674 Quiz 1
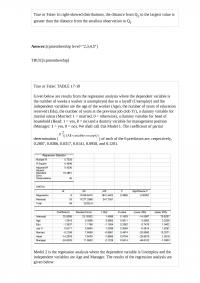
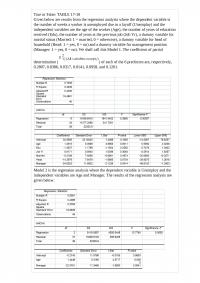
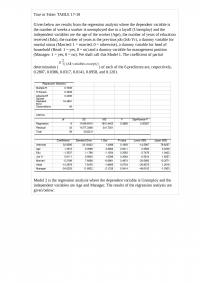
True or False: TABLE 17-10 Given below are results from the regression analysis where the dependent variable is the number of weeks a worker is unemployed due to a layoff (Unemploy) and the independent variables are the age of the […]
EMBA 257 Quiz
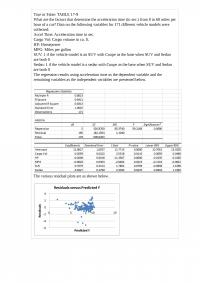
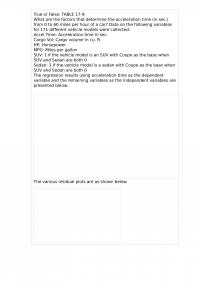
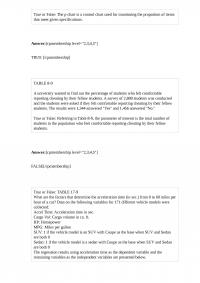
True or False: TABLE 17-9 What are the factors that determine the acceleration time (in sec.) from 0 to 60 miles per hour of a car? Data on the following variables for 171 different vehicle models were collected: Accel Time: […]
BUS 851 Quiz 1
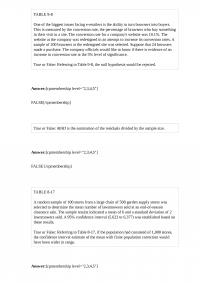
TABLE 9-8 One of the biggest issues facing e-retailers is the ability to turn browsers into buyers. This is measured by the conversion rate, the percentage of browsers who buy something in their visit to a site. The conversion rate […]
BUA 439 Quiz 3
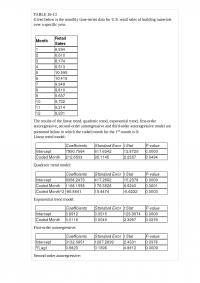
TABLE 16-13 Given below is the monthly time-series data for U.S. retail sales of building materials over a specific year. The results of the linear trend, quadratic trend, exponential trend, first-order autoregressive, second-order autoregressive and third-order autoregressive model are presented […]
BUA 189 Midterm 2
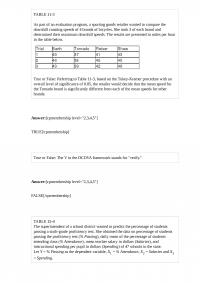
TABLE 11-3 As part of an evaluation program, a sporting goods retailer wanted to compare the downhill coasting speeds of 4 brands of bicycles. She took 3 of each brand and determined their maximum downhill speeds. The results are presented […]
MGT 398 Quiz 2
True or False: TABLE 17-11 A logistic regression model was estimated in order to predict the probability that a randomly chosen university or college would be a private university using information on mean total Scholastic Aptitude Test score (SAT) at […]
MHR 693 Final
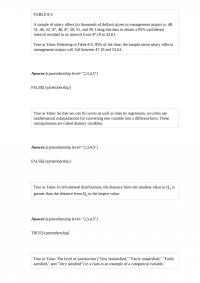
TABLE 8-5 A sample of salary offers (in thousands of dollars) given to management majors is: 48, 51, 46, 52, 47, 48, 47, 50, 51, and 59. Using this data to obtain a 95% confidence interval resulted in an interval […]
PRST 855
True or False: In right-skewed distributions, the distance from Q3 to the largest value is greater than the distance from the smallest observation to Q1. True or False: TABLE 17-10 Given below are results from the regression analysis where the […]
BUS 680 Homework
True or False: Given a sample mean of 2.1 and a population standard deviation of 0.7 from a sample of 10 data points, a 90% confidence interval will have a width of 2.36. True or False: TABLE 17-8 The superintendent […]
MHR 231 Midterm 2
True or False: A worker earns $15 per hour at a plant in China and is told that only 2.5% of all workers make a higher wage. If the wage is assumed to be normally distributed and the standard deviation […]
MHR 289 Final
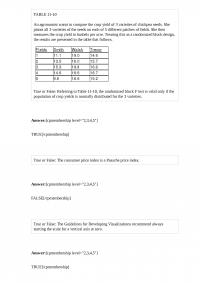
TABLE 11-10 An agronomist wants to compare the crop yield of 3 varieties of chickpea seeds. She plants all 3 varieties of the seeds on each of 5 different patches of fields. She then measures the crop yield in bushels […]
Management 611 Test 2
True or False: TABLE 17-10 Given below are results from the regression analysis where the dependent variable is the number of weeks a worker is unemployed due to a layoff (Unemploy) and the independent variables are the age of the […]
Management 752 Quiz 1
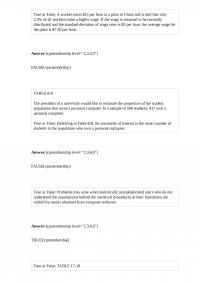
TABLE 8-17 A random sample of 100 stores from a large chain of 500 garden supply stores was selected to determine the mean number of lawnmowers sold at an end-of-season clearance sale. The sample results indicated a mean of 6 […]
OBHR 428 Test 2
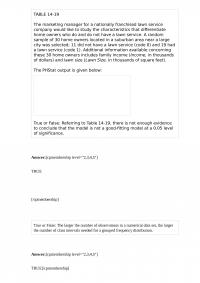
TABLE 14-19 The marketing manager for a nationally franchised lawn service company would like to study the characteristics that di erentiate home owners who do and do not have a lawn service. A random sample of 30 home owners located […]
BUA 781 Homework
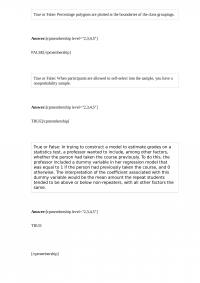
True or False: Percentage polygons are plotted at the boundaries of the class groupings. True or False: When participants are allowed to self-select into the sample, you have a nonprobability sample. Answer: TRUE True or False: In trying to construct […]
BUS 583 TABLE 1311A computer
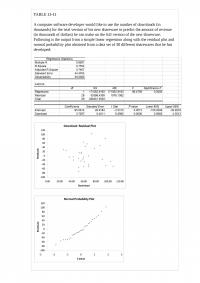
TABLE 13-11 A computer software developer would like to use the number of downloads (in thousands) for the trial version of his new shareware to predict the amount of revenue (in thousands of dollars) he can make on the full […]
BUS 874 Test 2
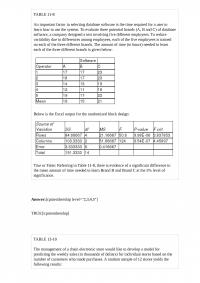
True or False: The t distribution allows the calculation of confidence intervals for means for small samples when the population variance is not known, regardless of the shape of the distribution in the population. True or False: Referring to Table […]
MHR 287 Quiz
True or False: A boxplot is a graphical representation of a five-number summary. True or False: Suppose = 50 and = 10 for a population. In a sample where n = 100 is randomly taken, 90% of all possible sample […]
OBHR 548 Test
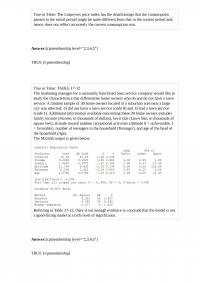
True or False: The Laspeyres price index has the disadvantage that the consumption pattern in the initial period might be quite different from that in the current period and, hence, does not reflect accurately the current consumption cost. True or […]
OBHR 285 Quiz 3
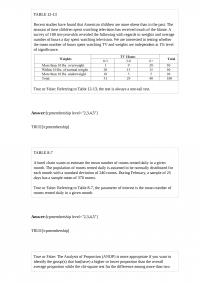
TABLE 12-13 Recent studies have found that American children are more obese than in the past. The amount of time children spent watching television has received much of the blame. A survey of 100 ten-year-olds revealed the following with regards […]
PRST 623
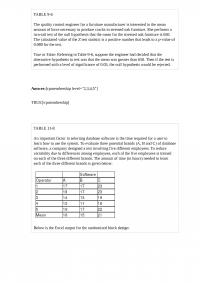
TABLE 9-6 The quality control engineer for a furniture manufacturer is interested in the mean amount of force necessary to produce cracks in stressed oak furniture. She performs a two-tail test of the null hypothesis that the mean for the […]
MGT 428 Test 1
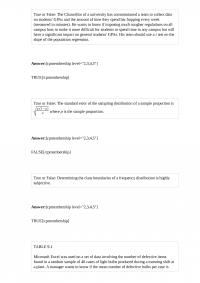
True or False: The Chancellor of a university has commissioned a team to collect data on students’ GPAs and the amount of time they spend bar hopping every week (measured in minutes). He wants to know if imposing much tougher […]
BUA 665 Quiz 3
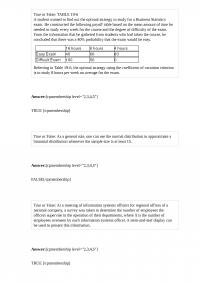
True or False: TABLE 19-6 A student wanted to find out the optimal strategy to study for a Business Statistics exam. He constructed the following payoff table based on the mean amount of time he needed to study every week […]
PRST 895 Quiz 1
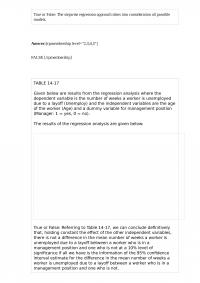
True or False: The stepwise regression approach takes into consideration all possible models. TABLE 14-17 Given below are results from the regression analysis where the dependent variable is the number of weeks a worker is unemployed due to a layo! […]
MHR 878 Quiz 1
True or False: If the covariance between two investments is zero, the variance of the sum of the two investments will be equal to the sum of the variances of the investments. True or False: As a general rule, a […]
Management 457
TABLE 8-7 A hotel chain wants to estimate the mean number of rooms rented daily in a given month. The population of rooms rented daily is assumed to be normally distributed for each month with a standard deviation of 240 […]
OBHR 343 Test 2
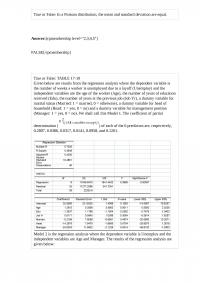
True or False: In a Poisson distribution, the mean and standard deviation are equal. True or False: TABLE 17-10 Given below are results from the regression analysis where the dependent variable is the number of weeks a worker is unemployed […]
MGMT 836 Quiz 3
True or False: “Big data” are data being collected in huge volumes and at very fast rates, and they typically arrive in a variety of forms, organized and unorganized. True or False: The amount of calories contained in a 12-ounce […]
PRST 831 Midterm
TABLE 14-17 Given below are results from the regression analysis where the dependent variable is the number of weeks a worker is unemployed due to a layo! (Unemploy) and the independent variables are the age of the worker (Age) and […]
EMBA 546 Quiz 3
True or False: Apple Computer, Inc. collected information on the age of their customers. Suppose the youngest customer was 12 and the oldest was 72. To study the distribution of the age among its customers, it can use a percentage […]
OBHR 680 Quiz 3
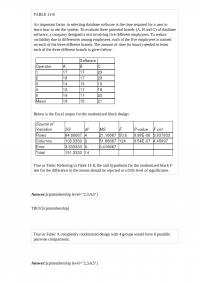
TABLE 11-8 An important factor in selecting database software is the time required for a user to learn how to use the system. To evaluate three potential brands (A, B and C) of database software, a company designed a test […]
MGT 424 Test 1
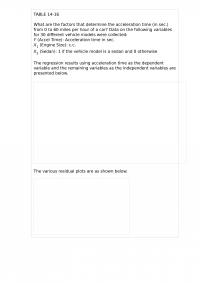
TABLE 14-16 What are the factors that determine the acceleration time (in sec.) from 0 to 60 miles per hour of a car? Data on the following variables for 30 different vehicle models were collected: Y (Accel Time): Acceleration time […]
MGMT 835
True or False: The value of r is always positive. True or False: The Paasche price index is a form of unweighted aggregate price index. Answer: FALSE True or False: The sampling error can either be positive or negative. Answer: […]
MGMT 622 Quiz 3
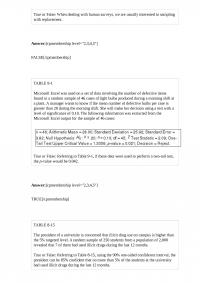
True or False: When dealing with human surveys, we are usually interested in sampling with replacement. TABLE 9-1 Microsoft Excel was used on a set of data involving the number of defective items found in a random sample of 46 […]
Management 746 Test
True or False: TABLE 17-8 The superintendent of a school district wanted to predict the percentage of students passing a sixth-grade proficiency test. She obtained the data on percentage of students passing the proficiency test (% Passing), daily mean of […]
MHR 118 Quiz 2
True or False: Regression analysis is used for prediction, while correlation analysis is used to measure the strength of the association between two numerical variables. True or False: The sample proportion is an unbiased estimate of the population proportion. Answer: […]
OBHR 701 Midterm
True or False: The principle of parsimony indicates that the simplest model that gets the job done adequately should be used. True or False: A regression had the following results: SST = 82.55, SSE = 29.85. It can be said […]
MGMT 146 Final
True or False: TABLE 17-9 What are the factors that determine the acceleration time (in sec.) from 0 to 60 miles per hour of a car? Data on the following variables for 171 different vehicle models were collected: Accel Time: […]
MGT 164
True or False: The procedure for the Wilcoxon rank sum test requires that you rank each group separately rather than together. True or False: The method of least squares may be used to estimate both linear and curvilinear trends. Answer: […]
OBHR 117
True or False: TABLE 17-8 The superintendent of a school district wanted to predict the percentage of students passing a sixth-grade proficiency test. She obtained the data on percentage of students passing the proficiency test (% Passing), daily mean of […]
MGMT 331 Quiz 3
TABLE 11-8 An important factor in selecting database software is the time required for a user to learn how to use the system. To evaluate three potential brands (A, B and C) of database software, a company designed a test […]
Management 484 Test 1
True or False: TABLE 17-10 Given below are results from the regression analysis where the dependent variable is the number of weeks a worker is unemployed due to a layoff (Unemploy) and the independent variables are the age of the […]
OBHR 545 Quiz
True or False: TABLE 17-8 The superintendent of a school district wanted to predict the percentage of students passing a sixth-grade proficiency test. She obtained the data on percentage of students passing the proficiency test (% Passing), daily mean of […]
EMBA 876 Final
True or False: The p chart is a control chart used for monitoring the proportion of items that meet given specifications. TABLE 8-9 A university wanted to find out the percentage of students who felt comfortable reporting cheating by their […]

BUS 122
True or False: TABLE 17-10 Given below are results from the regression analysis where the dependent variable is the number of weeks a worker is unemployed due to a layoff (Unemploy) and the independent variables are the age of the […]