Archives: Quiz
MHR 648 Final
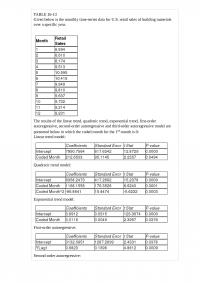
TABLE 16-13 Given below is the monthly time-series data for U.S. retail sales of building materials over a specific year. The results of the linear trend, quadratic trend, exponential trend, first-order autoregressive, second-order autoregressive and third-order autoregressive model are presented […]
MHR 462 Quiz 3
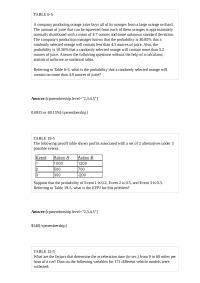
TABLE 6-5 A company producing orange juice buys all of its oranges from a large orange orchard. The amount of juice that can be squeezed from each of these oranges is approximately normally distributed with a mean of 4.7 ounces […]
PRST 784
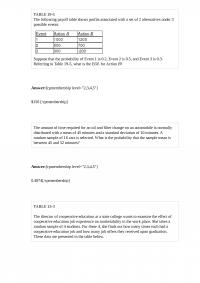
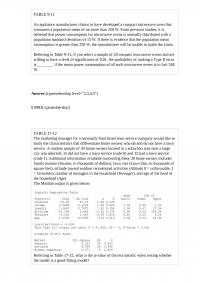
TABLE 19-5 The following payoff table shows profits associated with a set of 2 alternatives under 3 possible events. Suppose that the probability of Event 1 is 0.2, Event 2 is 0.5, and Event 3 is 0.3. Referring to Table […]

BUS 578 Midterm 2
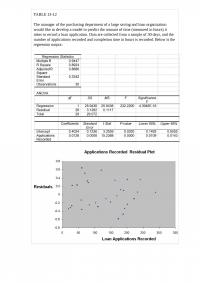
TABLE 13-12 The manager of the purchasing department of a large saving and loan organization would like to develop a model to predict the amount of time (measured in hours) it takes to record a loan application. Data are collected […]
BUA 844 Quiz 2
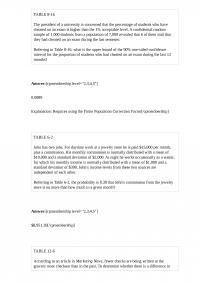
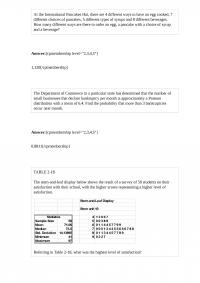
TABLE 8-16 The president of a university is concerned that the percentage of students who have cheated on an exam is higher than the 1% acceptable level. A confidential random sample of 1,000 students from a population of 7,000 revealed […]
OBHR 103 Quiz 1
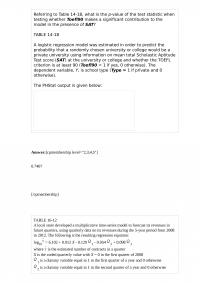
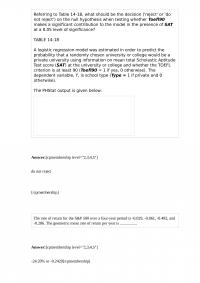
Referring to Table 14-18, what is the p-value of the test statistic when testing whether Toe90 makes a signiticant contribution to the model in the presence of SAT? TABLE 14-18 A logistic regression model was estimated in order to predict […]
MHR 562 Midterm 2
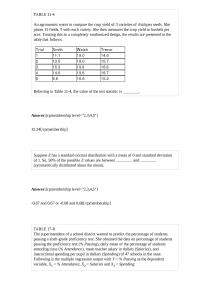
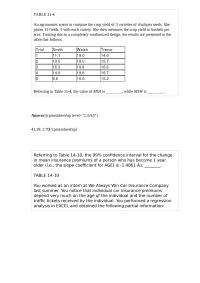
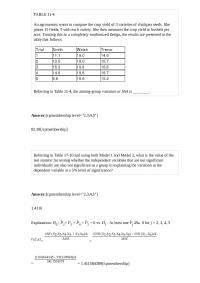
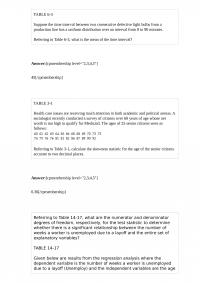
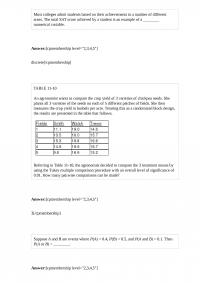
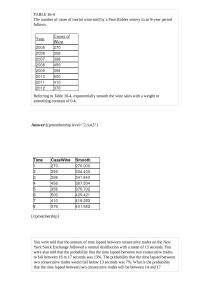
TABLE 11-4 An agronomist wants to compare the crop yield of 3 varieties of chickpea seeds. She plants 15 fields, 5 with each variety. She then measures the crop yield in bushels per acre. Treating this as a completely randomized […]

MHR 851 Quiz 1
TABLE 16-13 Given below is the monthly time-series data for U.S. retail sales of building materials over a specific year. The results of the linear trend, quadratic trend, exponential trend, first-order autoregressive, second-order autoregressive and third-order autoregressive model are presented […]
BUA 345 Quiz
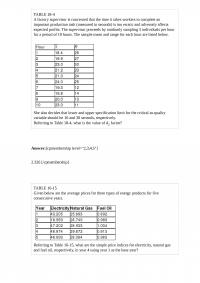
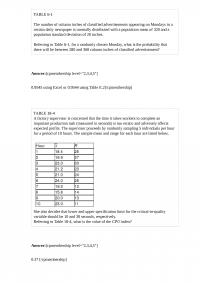
TABLE 18-4 A factory supervisor is concerned that the time it takes workers to complete an important production task (measured in seconds) is too erratic and adversely affects expected profits. The supervisor proceeds by randomly sampling 5 individuals per hour […]
MGT 729 Test
TABLE 6-1 The number of column inches of classified advertisements appearing on Mondays in a certain daily newspaper is normally distributed with a population mean of 320 and a population standard deviation of 20 inches. Referring to Table 6-1, for […]
MGT 731 Test
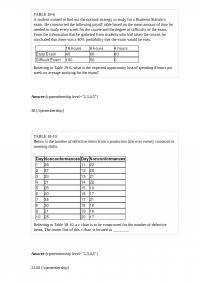
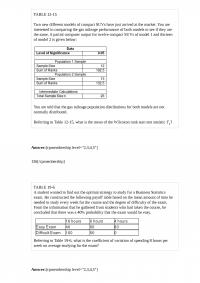
TABLE 19-6 A student wanted to find out the optimal strategy to study for a Business Statistics exam. He constructed the following payoff table based on the mean amount of time he needed to study every week for the course […]
PRST 800 Quiz 2
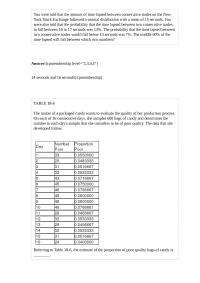
You were told that the amount of time lapsed between consecutive trades on the New York Stock Exchange followed a normal distribution with a mean of 15 seconds. You were also told that the probability that the time lapsed between […]
MGMT 533 Test
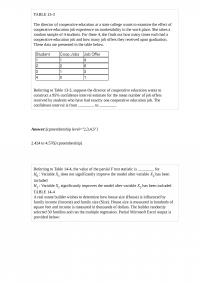
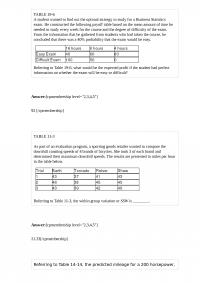
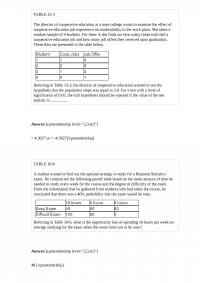
TABLE 13-3 The director of cooperative education at a state college wants to examine the effect of cooperative education job experience on marketability in the work place. She takes a random sample of 4 students. For these 4, she finds […]
BUS 574 Test
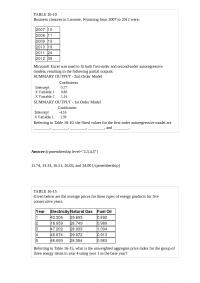
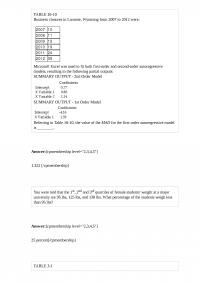
TABLE 16-10 Business closures in Laramie, Wyoming from 2007 to 2012 were: Microsoft Excel was used to fit both first-order and second-order autoregressive models, resulting in the following partial outputs: SUMMARY OUTPUT – 2nd Order Model SUMMARY OUTPUT – 1st […]
PRST 413 Final
TABLE 11-4 An agronomist wants to compare the crop yield of 3 varieties of chickpea seeds. She plants 15 fields, 5 with each variety. She then measures the crop yield in bushels per acre. Treating this as a completely randomized […]
MHR 497
The oranges grown in corporate farms in an agricultural state were damaged by some unknown fungi a few years ago. Suppose the manager of a large farm wanted to study the impact of the fungi on the orange crops on […]
BUS 186 Midterm 2 TABLE 214The
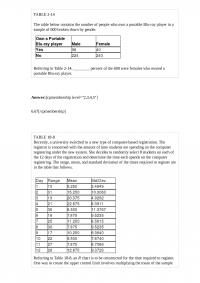
TABLE 2-14 The table below contains the number of people who own a portable Blu-ray player in a sample of 600 broken down by gender. Referring to Table 2-14, ________ percent of the 600 were females who owned a portable […]
BUA 706 Homework
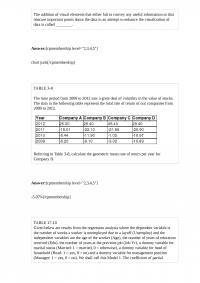
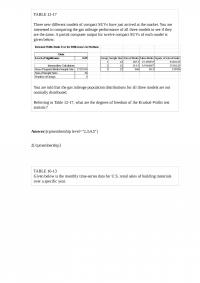
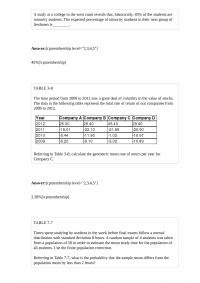
The addition of visual elements that either fail to convey any useful information or that obscure important points about the data in an attempt to enhance the visualization of data is called ________. TABLE 3-8 The time period from 2009 […]
PRST 134
TABLE 9-11 An appliance manufacturer claims to have developed a compact microwave oven that consumes a population mean of no more than 250 W. From previous studies, it is believed that power consumption for microwave ovens is normally distributed with […]
OBHR 599 Quiz 2
TABLE 19-6 A student wanted to find out the optimal strategy to study for a Business Statistics exam. He constructed the following payoff table based on the mean amount of time he needed to study every week for the course […]
PRST 461 TABLE 114An agronomist
TABLE 11-4 An agronomist wants to compare the crop yield of 3 varieties of chickpea seeds. She plants 15 fields, 5 with each variety. She then measures the crop yield in bushels per acre. Treating this as a completely randomized […]
OBHR 113 Test
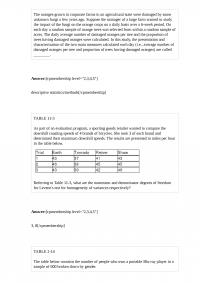
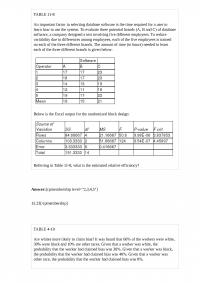
TABLE 11-8 An important factor in selecting database software is the time required for a user to learn how to use the system. To evaluate three potential brands (A, B and C) of database software, a company designed a test […]
OBHR 757 Midterm 2
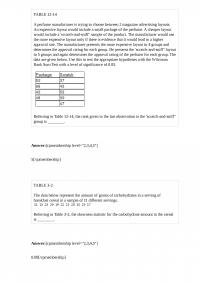
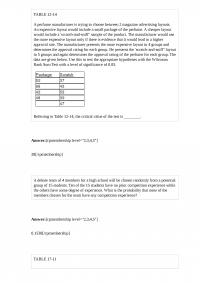
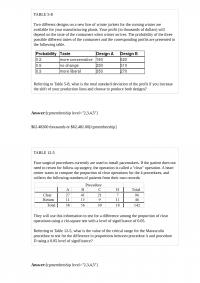
TABLE 12-14 A perfume manufacturer is trying to choose between 2 magazine advertising layouts. An expensive layout would include a small package of the perfume. A cheaper layout would include a ‘scratch-and-sniff” sample of the product. The manufacturer would use […]
PRST 749
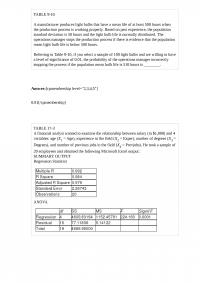
TABLE 12-17 Three new different models of compact SUVs have just arrived at the market. You are interested in comparing the gas mileage performance of all three models to see if they are the same. A partial computer output for […]
MHR 836 Homework
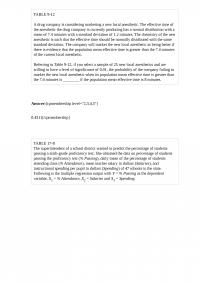
TABLE 9-10 A manufacturer produces light bulbs that have a mean life of at least 500 hours when the production process is working properly. Based on past experience, the population standard deviation is 50 hours and the light bulb life […]
OBHR 734 Quiz 1
TABLE 9-12 A drug company is considering marketing a new local anesthetic. The effective time of the anesthetic the drug company is currently producing has a normal distribution with a mean of 7.4 minutes with a standard deviation of 1.2 […]
MHR 745
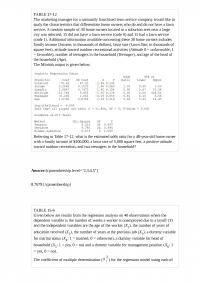
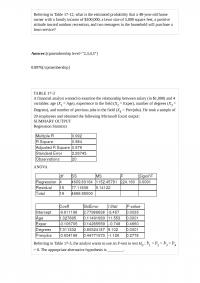
TABLE 17-12 The marketing manager for a nationally franchised lawn service company would like to study the characteristics that differentiate home owners who do and do not have a lawn service. A random sample of 30 home owners located in […]
EMBA 343
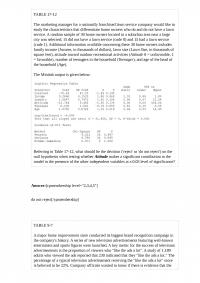
TABLE 17-12 The marketing manager for a nationally franchised lawn service company would like to study the characteristics that differentiate home owners who do and do not have a lawn service. A random sample of 30 home owners located in […]
OBHR 574 Homework
TABLE 12-15 Two new different models of compact SUVs have just arrived at the market. You are interested in comparing the gas mileage performance of both models to see if they are the same. A partial computer output for twelve […]
BUS 242 TABLE 63Suppose the time
TABLE 6-3 Suppose the time interval between two consecutive defective light bulbs from a production line has a uniform distribution over an interval from 0 to 90 minutes. Referring to Table 6-3, what is the mean of the time interval? […]
BUS 699 Quiz
Most colleges admit students based on their achievements in a number of different areas. The total SAT score achieved by a student is an example of a ________ numerical variable. TABLE 11-10 An agronomist wants to compare the crop yield […]
OBHR 201 Test 2
TABLE 16-4 The number of cases of merlot wine sold by a Paso Robles winery in an 8-year period follows. Referring to Table 16-4, exponentially smooth the wine sales with a weight or smoothing constant of 0.4. You were told […]
EMBA 853 Midterm 1
Referring to Table 14-18, what should be the decision (‘reject’ or ‘do not reject’) on the null hypothesis when testing whether Toe90 makes a signi”cant contribution to the model in the presence of SAT at a 0.05 level of signi”cance? […]
MGT 822
At the International Pancakes Hut, there are 4 different ways to have an egg cooked, 7 different choices of pancakes, 5 different types of syrups and 8 different beverages. How many different ways are there to order an egg, a […]
MHR 327 Test 2
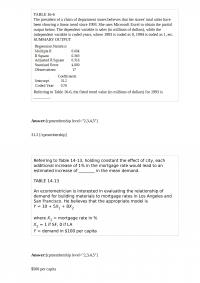
TABLE 16-6 The president of a chain of department stores believes that her stores’ total sales have been showing a linear trend since 1993. She uses Microsoft Excel to obtain the partial output below. The dependent variable is sales (in […]
BUA 752 Quiz 3
TABLE 12-14 A perfume manufacturer is trying to choose between 2 magazine advertising layouts. An expensive layout would include a small package of the perfume. A cheaper layout would include a ‘scratch-and-sniff” sample of the product. The manufacturer would use […]
BUA 100 Quiz
TABLE 13-3 The director of cooperative education at a state college wants to examine the effect of cooperative education job experience on marketability in the work place. She takes a random sample of 4 students. For these 4, she finds […]
PRST 765
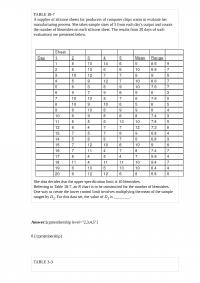
TABLE 18-7 A supplier of silicone sheets for producers of computer chips wants to evaluate her manufacturing process. She takes sample sizes of 5 from each day’s output and counts the number of blemishes on each silicone sheet. The results […]
MGMT 570 Midterm 1
TABLE 5-8 Two different designs on a new line of winter jackets for the coming winter are available for your manufacturing plants. Your profit (in thousands of dollars) will depend on the taste of the consumers when winter arrives. The […]
OBHR 383 Test 2
Referring to Table 17-12, what is the estimated probability that a 48-year-old home owner with a family income of $100,000, a lawn size of 5,000 square feet, a positive attitude toward outdoor recreation, and two teenagers in the household will […]
EMBA 114
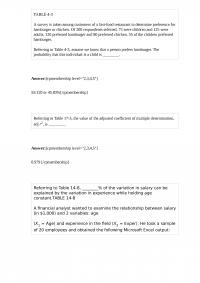
TABLE 4-3 A survey is taken among customers of a fast-food restaurant to determine preference for hamburger or chicken. Of 200 respondents selected, 75 were children and 125 were adults. 120 preferred hamburger and 80 preferred chicken. 55 of the […]
MGT 500 Test 1
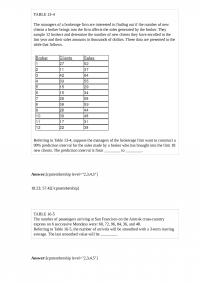
TABLE 13-4 The managers of a brokerage firm are interested in finding out if the number of new clients a broker brings into the firm affects the sales generated by the broker. They sample 12 brokers and determine the number […]
MHR 510
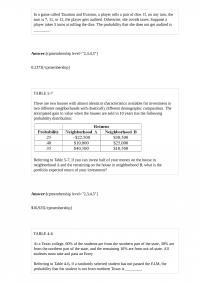
In a game called Taxation and Evasion, a player rolls a pair of dice. If, on any turn, the sum is 7, 11, or 12, the player gets audited. Otherwise, she avoids taxes. Suppose a player takes 5 turns at […]
PRST 734
A study at a college in the west coast reveals that, historically, 45% of the students are minority students. The expected percentage of minority students in their next group of freshmen is ________. TABLE 3-8 The time period from 2009 […]
EMBA 178
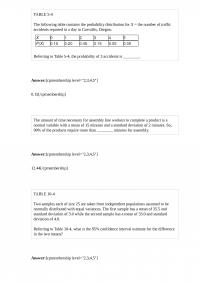
TABLE 5-4 The following table contains the probability distribution for X = the number of traffic accidents reported in a day in Corvallis, Oregon. Referring to Table 5-4, the probability of 3 accidents is ________. The amount of time necessary […]
MHR 622 Quiz 3
TABLE 16-10 Business closures in Laramie, Wyoming from 2007 to 2012 were: Microsoft Excel was used to fit both first-order and second-order autoregressive models, resulting in the following partial outputs: SUMMARY OUTPUT – 2nd Order Model SUMMARY OUTPUT – 1st […]
PRST 781
TABLE 13-12 The manager of the purchasing department of a large saving and loan organization would like to develop a model to predict the amount of time (measured in hours) it takes to record a loan application. Data are collected […]
OBHR 341
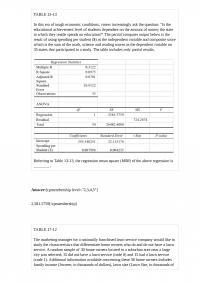
TABLE 13-13 In this era of tough economic conditions, voters increasingly ask the question: “Is the educational achievement level of students dependent on the amount of money the state in which they reside spends on education?” The partial computer output […]
MHR 187 Midterm 2
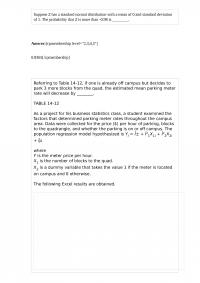
Suppose Z has a standard normal distribution with a mean of 0 and standard deviation of 1. The probability that Z is more than -0.98 is ________. Referring to Table 14-12, if one is already o campus but decides to […]
BUS 531 Quiz 3
The amount of time necessary for assembly line workers to complete a product is a normal variable with a mean of 15 minutes and a standard deviation of 2 minutes. So, 15% of the products require more than ________ minutes […]