Archives: Quiz
OBHR 248 Quiz
TABLE 9-8 One of the biggest issues facing e-retailers is the ability to turn browsers into buyers. This is measured by the conversion rate, the percentage of browsers who buy something in their visit to a site. The conversion rate […]
Management 681
TABLE 7-7 Times spent studying by students in the week before final exams follow a normal distribution with standard deviation 8 hours. A random sample of 4 students was taken from a population of 50 in order to estimate the […]

MHR 196 Quiz 1
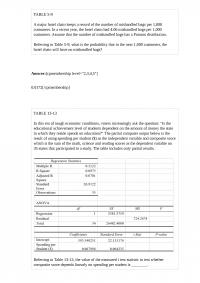
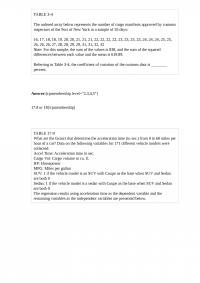
TABLE 17-10 Given below are results from the regression analysis where the dependent variable is the number of weeks a worker is unemployed due to a layoff (Unemploy) and the independent variables are the age of the worker (Age), the […]
MGT 842 Quiz 2
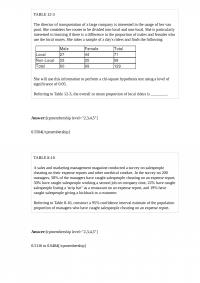
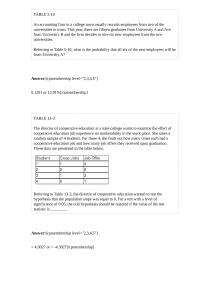
TABLE 12-3 The director of transportation of a large company is interested in the usage of her van pool. She considers her routes to be divided into local and non-local. She is particularly interested in learning if there is a […]

OBHR 349 Midterm 2
TABLE 8-9 A university wanted to find out the percentage of students who felt comfortable reporting cheating by their fellow students. A survey of 2,800 students was conducted and the students were asked if they felt comfortable reporting cheating by […]
Management 121 Final
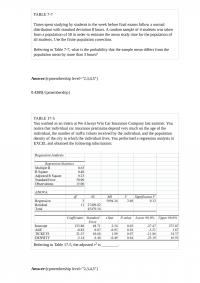
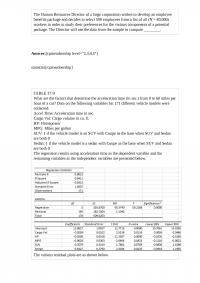
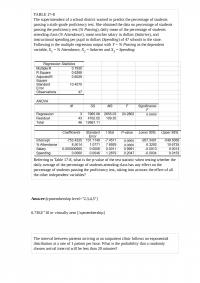
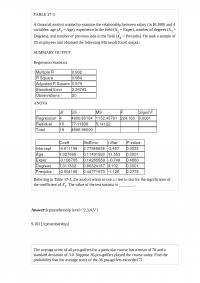
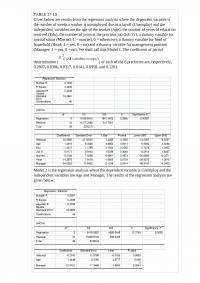
TABLE 17-3 A financial analyst wanted to examine the relationship between salary (in $1,000) and 4 variables: age (X1 = Age), experience in the field (X2 = Exper), number of degrees (X3 = Degrees), and number of previous jobs in […]
MGT 744 Quiz
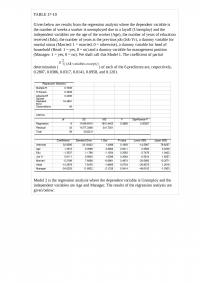
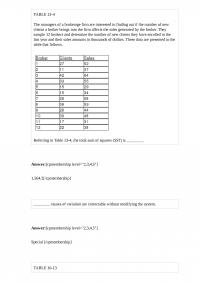
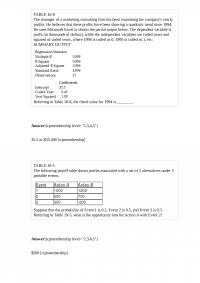
TABLE 13-4 The managers of a brokerage firm are interested in finding out if the number of new clients a broker brings into the firm affects the sales generated by the broker. They sample 12 brokers and determine the number […]
EMBA 772 Quiz 1
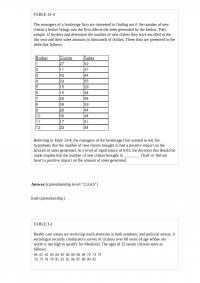
Referring to Table 14-9, what is the value of the coefficient of multiple determination? TABLE 14-9 You decide to predict gasoline prices in different cities and towns in the United States for your term project. Your dependent variable is price […]
MGT 324 Test
TABLE 5-5 From an inventory of 48 new cars being shipped to local dealerships, corporate reports indicate that 12 have defective radios installed. Referring to Table 5-5, what is the probability out of the 8 new cars it just received […]
OBHR 209 Quiz 3
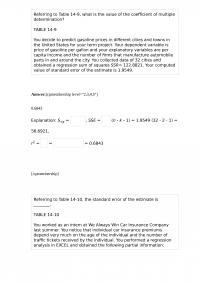
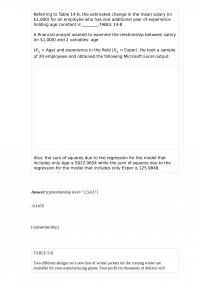
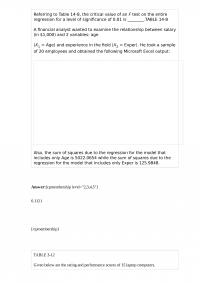
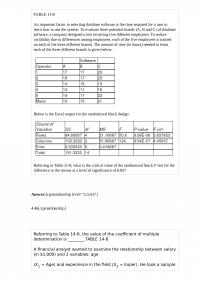
Referring to Table 14-8, the estimated change in the mean salary (in $1,000) for an employee who has one additional year of experience holding age constant is ________.TABLE 14-8 A financial analyst wanted to examine the relationship between salary (in […]
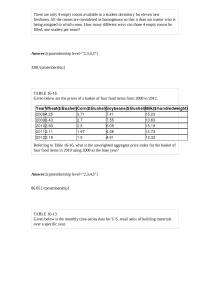
EMBA 107
There are only 4 empty rooms available in a student dormitory for eleven new freshmen. All the rooms are considered as homogenous so that it does not matter who is being assigned to which room. How many different ways can […]
Management 119 Midterm 2
TABLE 6-5 A company producing orange juice buys all of its oranges from a large orange orchard. The amount of juice that can be squeezed from each of these oranges is approximately normally distributed with a mean of 4.7 ounces […]
MGT 742 Midterm
TABLE 17-10 Given below are results from the regression analysis where the dependent variable is the number of weeks a worker is unemployed due to a layoff (Unemploy) and the independent variables are the age of the worker (Age), the […]
MGMT 702
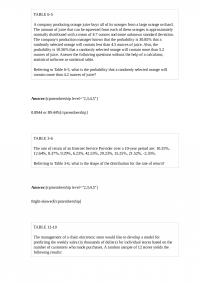
Referring to Table 14-8, the critical value of an F test on the entire regression for a level of significance of 0.01 is ________.TABLE 14-8 A financial analyst wanted to examine the relationship between salary (in $1,000) and 2 variables: […]
BUA 268 Test 2
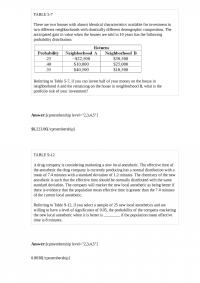
TABLE 5-7 There are two houses with almost identical characteristics available for investment in two different neighborhoods with drastically different demographic composition. The anticipated gain in value when the houses are sold in 10 years has the following probability distribution: […]
BUS 855
TABLE 13-4 The managers of a brokerage firm are interested in finding out if the number of new clients a broker brings into the firm affects the sales generated by the broker. They sample 12 brokers and determine the number […]
OBHR 202 Midterm
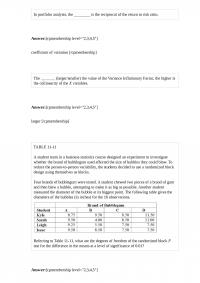
In constructing a polygon, each class grouping is represented by its ________ and then these are consecutively connected to one another. TABLE 5-11 Subscribers to Investment Advice White Letters perform security transactions at the rate of five trades per month. […]
MGMT 695
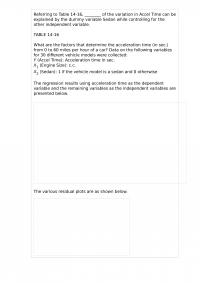
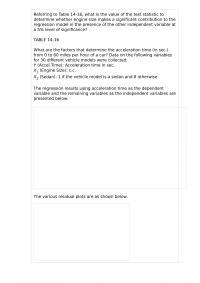
Referring to Table 14-16, ________ of the variation in Accel Time can be explained by the dummy variable Sedan while controlling for the other independent variable. TABLE 14-16 What are the factors that determine the acceleration time (in sec.) from […]
PRST 201
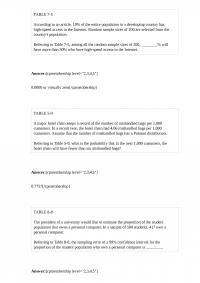
TABLE 5-9 A major hotel chain keeps a record of the number of mishandled bags per 1,000 customers. In a recent year, the hotel chain had 4.06 mishandled bags per 1,000 customers. Assume that the number of mishandled bags has […]
Management 635 Test
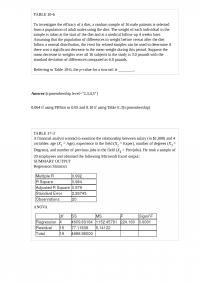
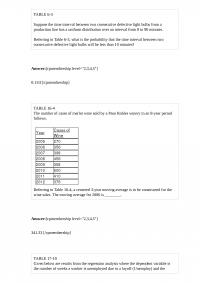
TABLE 16-8 The manager of a marketing consulting firm has been examining his company’s yearly profits. He believes that these profits have been showing a quadratic trend since 1994. He uses Microsoft Excel to obtain the partial output below. The […]
MHR 553 Quiz 2
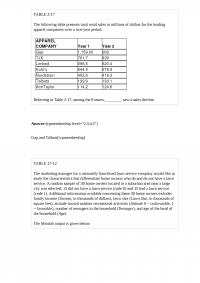
TABLE 2-17 The following table presents total retail sales in millions of dollars for the leading apparel companies over a two-year period. Referring to Table 2-17, among the 8 stores, ________ saw a sales decline. TABLE 17-12 The marketing manager […]
BUA 522 Test 2 TABLE 32The data
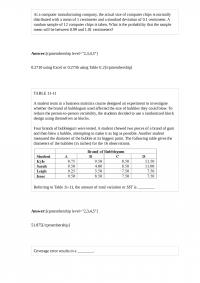
TABLE 3-2 The data below represent the amount of grams of carbohydrates in a serving of breakfast cereal in a sample of 11 different servings. Referring to Table 3-2, the variance of the carbohydrate amounts is ________ (grams squared). TABLE […]
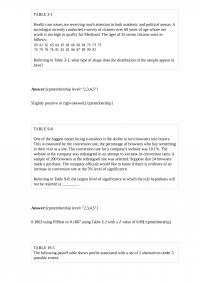
EMBA 703 TABLE 31Health care
TABLE 3-1 Health care issues are receiving much attention in both academic and political arenas. A sociologist recently conducted a survey of citizens over 60 years of age whose net worth is too high to qualify for Medicaid. The ages […]
EMBA 594
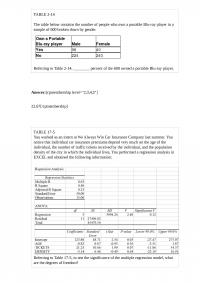
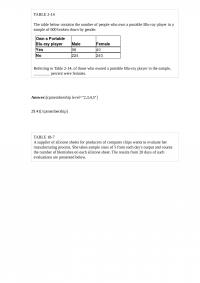
TABLE 2-14 The table below contains the number of people who own a portable Blu-ray player in a sample of 600 broken down by gender. Referring to Table 2-14, ________ percent of the 600 owned a portable Blu-ray player. TABLE […]
BUA 697 Midterm 1
At a computer manufacturing company, the actual size of computer chips is normally distributed with a mean of 1 centimeter and a standard deviation of 0.1 centimeter. A random sample of 12 computer chips is taken. What is the probability […]
BUA 209 Quiz 3
TABLE 3-4 The ordered array below represents the number of cargo manifests approved by customs inspectors of the Port of New York in a sample of 35 days: 16, 17, 18, 18, 19, 20, 20, 21, 21, 21, 22, 22, […]
MGMT 422 Quiz 2
TABLE 10-6 To investigate the efficacy of a diet, a random sample of 16 male patients is selected from a population of adult males using the diet. The weight of each individual in the sample is taken at the start […]
EMBA 620
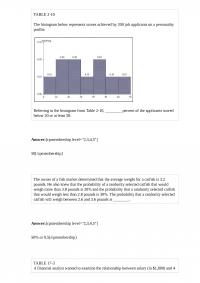
TABLE 2-10 The histogram below represents scores achieved by 200 job applicants on a personality profile. Referring to the histogram from Table 2-10, ________ percent of the applicants scored below 20 or at least 50. The owner of a fish […]
MGMT 558 Homework
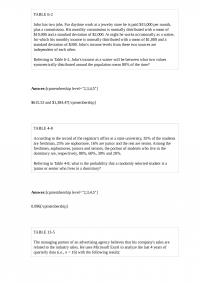
TABLE 5-10 An accounting firm in a college town usually recruits employees from two of the universities in town. This year, there are fifteen graduates from University A and five from University B and the firm decides to hire six […]
MGMT 168
The Human Resources Director of a large corporation wishes to develop an employee benefits package and decides to select 500 employees from a list of all (N = 40,000) workers in order to study their preferences for the various components […]
Management 489 Midterm 2
TABLE 17-12 The marketing manager for a nationally franchised lawn service company would like to study the characteristics that differentiate home owners who do and do not have a lawn service. A random sample of 30 home owners located in […]
MHR 218 Quiz 1
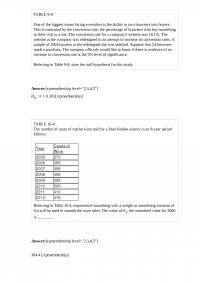
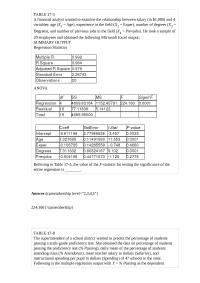
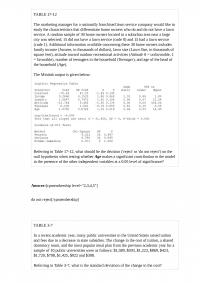
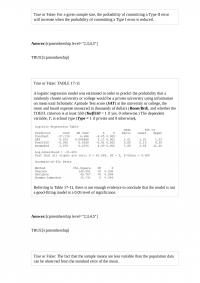
TABLE 17-8 The superintendent of a school district wanted to predict the percentage of students passing a sixth-grade proficiency test. She obtained the data on percentage of students passing the proficiency test (% Passing), daily mean of the percentage of […]
Management 652 Quiz
In portfolio analysis, the ________ is the reciprocal of the return to risk ratio. The _______ (larger/smaller) the value of the Variance Inflationary Factor, the higher is the collinearity of the X variables. Answer: larger TABLE 11-11 A student team […]
MHR 243 Homework
TABLE 6-2 John has two jobs. For daytime work at a jewelry store he is paid $15,000 per month, plus a commission. His monthly commission is normally distributed with a mean of $10,000 and a standard deviation of $2,000. At […]
Management 484 Midterm
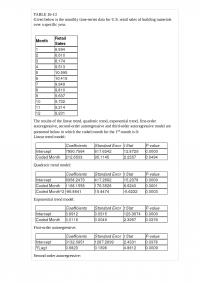
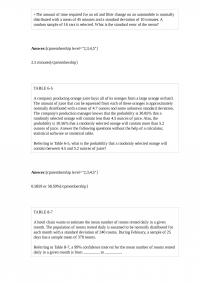
TABLE 16-13 Given below is the monthly time-series data for U.S. retail sales of building materials over a specific year. The results of the linear trend, quadratic trend, exponential trend, first-order autoregressive, second-order autoregressive and third-order autoregressive model are presented […]
BUA 132
TABLE 2-14 The table below contains the number of people who own a portable Blu-ray player in a sample of 600 broken down by gender. Referring to Table 2-14, of those who owned a portable Blu-ray player in the sample, […]
PRST 324 Test 1
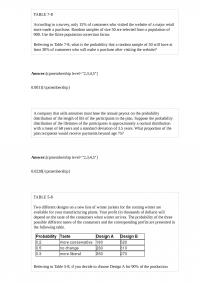
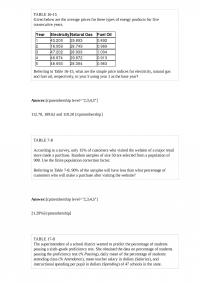
TABLE 7-8 According to a survey, only 15% of customers who visited the website of a major retail store made a purchase. Random samples of size 50 are selected from a population of 900. Use the finite population correction factor. […]
EMBA 132 Homework
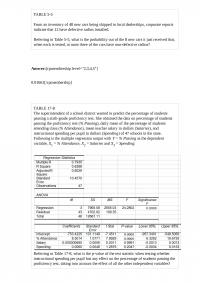
Referring to Table 14-16, what is the value of the test statistic to determine whether engine size makes a signiticant contribution to the regression model in the presence of the other independent variable at a 5% level of signiticance? TABLE […]
MGMT 725 Quiz 3
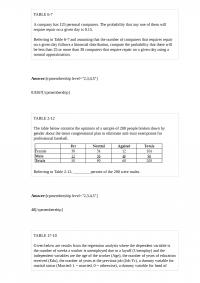
TABLE 6-7 A company has 125 personal computers. The probability that any one of them will require repair on a given day is 0.15. Referring to Table 6-7 and assuming that the number of computers that requires repair on a […]
MHR 551
TABLE 11-8 An important factor in selecting database software is the time required for a user to learn how to use the system. To evaluate three potential brands (A, B and C) of database software, a company designed a test […]
Management 248 Test 2
TABLE 7-5 According to an article, 19% of the entire population in a developing country has high-speed access to the Internet. Random sample sizes of 200 are selected from the country’s population. Referring to Table 7-5, among all the random […]
MGT 163 Final
TABLE 17-3 A financial analyst wanted to examine the relationship between salary (in $1,000) and 4 variables: age (X1 = Age), experience in the field (X2 = Exper), number of degrees (X3 = Degrees), and number of previous jobs in […]
EMBA 805 Homework
TABLE 6-3 Suppose the time interval between two consecutive defective light bulbs from a production line has a uniform distribution over an interval from 0 to 90 minutes. Referring to Table 6-3, what is the probability that the time interval […]
BUS 374 Midterm 1
TABLE 16-15 Given below are the average prices for three types of energy products for five consecutive years. Referring to Table 16-15, what are the simple price indices for electricity, natural gas and fuel oil, respectively, in year 5 using […]
MGMT 385 Quiz 2
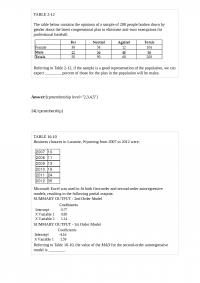
TABLE 2-12 The table below contains the opinions of a sample of 200 people broken down by gender about the latest congressional plan to eliminate anti-trust exemptions for professional baseball. Referring to Table 2-12, if the sample is a good […]
EMBA 423 Quiz
+The amount of time required for an oil and filter change on an automobile is normally distributed with a mean of 45 minutes and a standard deviation of 10 minutes. A random sample of 16 cars is selected. What is […]
BUA 554
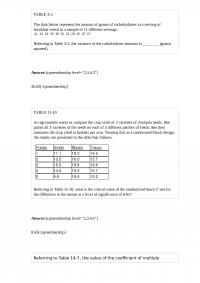
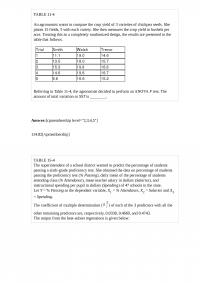
TABLE 11-4 An agronomist wants to compare the crop yield of 3 varieties of chickpea seeds. She plants 15 fields, 5 with each variety. She then measures the crop yield in bushels per acre. Treating this as a completely randomized […]
BUA 240 Midterm 2 The
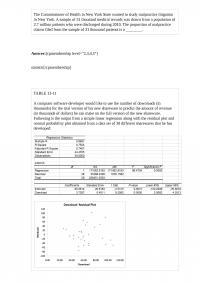
The Commissioner of Health in New York State wanted to study malpractice litigation in New York. A sample of 31 thousand medical records was drawn from a population of 2.7 million patients who were discharged during 2010. The proportion of […]
BUS 851
TABLE 17-10 Given below are results from the regression analysis where the dependent variable is the number of weeks a worker is unemployed due to a layoff (Unemploy) and the independent variables are the age of the worker (Age), the […]
OBHR 821 Quiz
True or False: For a given sample size, the probability of committing a Type II error will increase when the probability of committing a Type I error is reduced. True or False: TABLE 17-11 A logistic regression model was estimated […]