Archives
978-1285867045 Chapter 1 Solution Manual
Chapter 1 Data and Statistics Learning Objectives 1. Obtain an appreciation for the breadth of statistical applications in business and economics. 2. Understand the meaning of the terms elements, variables, and observations as they are used in statistics. 3. Obtain […]
978-1285867045 Chapter 10 Case
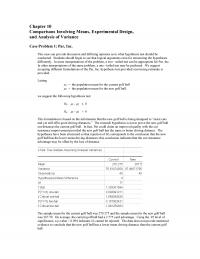
Chapter 10 Comparisons Involving Means, Experimental Design, and Analysis of Variance Case Problem 1: Par, Inc. This case can provide discussion and differing opinions as to what hypothesis test should be conducted. Students should begin to see that logical arguments […]
978-1285867045 Chapter 10 Solution Manual Part 1
Chapter 10 Comparisons Involving Means, Experimental Design, and Analysis of Variance Learning Objectives 1. Be able to develop interval estimates and conduct hypothesis tests about the difference between two population means when 1 and 2 are known. 2. […]
978-1285867045 Chapter 10 Solution Manual Part 2
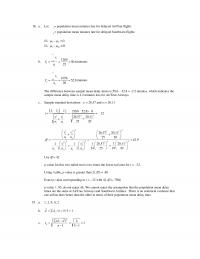
18. a. Let m 1 = population mean minutes late for delayed AirTran flights m 2 = population mean minutes late for delayed Southwest flights H0: 12 0 −= Ha: 1 22 0 − b. x1=xi i=1 n […]
978-1285867045 Chapter 10 Solution Manual Part 3
36. MSTR = SSTR /(k – 1) = 70 /2 = 35 2 1 SSE ( 1) k jj j ns = =− = 4(32) + 4(17.5) + 4(9.5) = 236 MSE = SSE /(nT – k) = 236 […]
978-1285867045 Chapter 11 Case
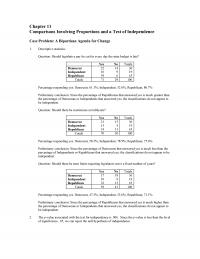
Chapter 11 Comparisons Involving Proportions and a Test of Independence Case Problem: A Bipartisan Agenda for Change 1. Descriptive statistics Question: Should legislative pay be cut for every day the state budget is late? Yes No Totals Democrat 22 14 […]
978-1285867045 Chapter 11 Solution Manual Part 1
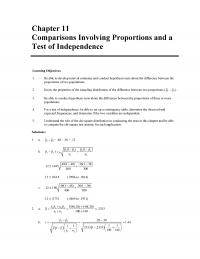
Chapter 11 Comparisons Involving Proportions and a Test of Independence Learning Objectives 1. Be able to develop interval estimates and conduct hypothesis tests about the difference between the proportions of two populations. 2. Know the properties of the sampling distribution […]
978-1285867045 Chapter 11 Solution Manual Part 2
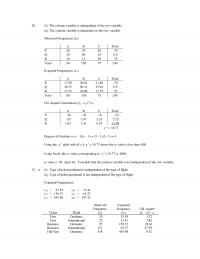
20. H0: The column variable is independent of the row variable Ha: The column variable is dependent on the row variable Observed Frequencies (fij) A B C Total P 20 30 20 70 Q 30 60 25 115 R 10 […]
978-1285867045 Chapter 11 Solution Manual Part 3
33. 1.276p= 2.487p= One week earlier 3.397p= One month earlier a. Point estimate: 12 .276 .487 .211pp− = − = − Margin of error: .025 12 1.96 .085 240 240 znn + = + = 95% confidence interval: -.211 ± […]
978-1285867045 Chapter 12 Case
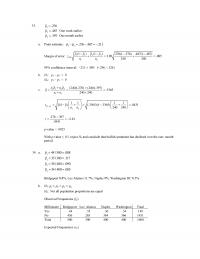
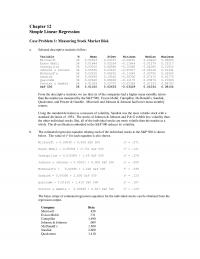
Chapter 12 Simple Linear Regression Case Problem 1: Measuring Stock Market Risk a. Selected descriptive statistics follow: Variable N Mean StDev Minimum Median Maximum Microsoft 36 0.00503 0.04537 -0.08201 0.00400 0.08883 Exxon Mobil 36 0.01664 0.05534 -0.11646 0.01279 0.23217 Caterpillar […]
978-1285867045 Chapter 12 Solution Manual Part 1
Chapter 12 Simple Linear Regression Learning Objectives 1. Understand how regression analysis can be used to develop an equation that estimates mathematically how two variables are related. 2. Understand the differences between the regression model, the regression equation, and the […]
978-1285867045 Chapter 12 Solution Manual Part 2
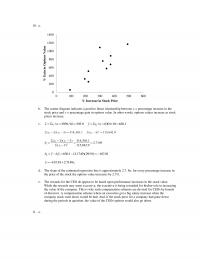
10. a. b. The scatter diagram indicates a positive linear relationship between x = percentage increase in the stock price and y = percentage gain in options value. In other words, options values increase as stock prices increase. c. / […]
978-1285867045 Chapter 12 Solution Manual Part 3
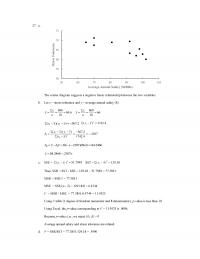
27. a. The scatter diagram suggests a negative linear relationship between the two variables. b. Let x = stress tolerance and y = average annual salary ($) 866 660 86.6 66 10 10 ii xy xy nn = = […]
978-1285867045 Chapter 12 Solution Manual Part 4
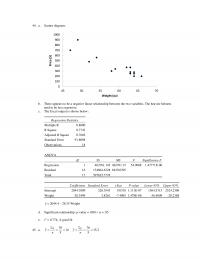
44. a. Scatter diagram: b. There appears to be a negative linear relationship between the two variables. The heavier helmets tend to be less expensive. c. The Excel output is shown below: Regression Statistics Multiple R 0.8800 R Square 0.7743 […]
978-1285867045 Chapter 12 Solution Manual Part 5
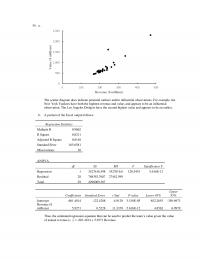
54. a. The scatter diagram does indicate potential outliers and/or influential observations. For example, the b. A portion of the Excel output follows: New York Yankees have both the hightest revenue and value, and appears to be an influential observation. […]
978-1285867045 Chapter 13 Case
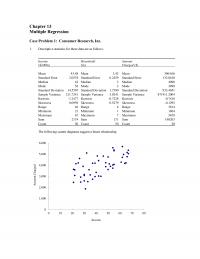
Chapter 13 Multiple Regression Case Problem 1: Consumer Research, Inc. 1. Descriptive statistics for these data are as follows: Income ($1000s) Household Size Amount Charged ($) Mean 43.48 Mean 3.42 Mean 3964.06 Standard Error 2.0578 Standard Error 0.2459 Standard Error […]
978-1285867045 Chapter 13 Solution Manual Part 1
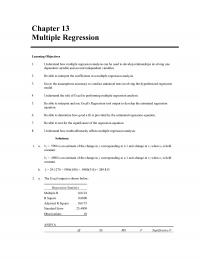
Chapter 13 Multiple Regression Learning Objectives 1. Understand how multiple regression analysis can be used to develop relationships involving one dependent variable and several independent variables. 2. Be able to interpret the coefficients in a multiple regression analysis. 3. Know […]
978-1285867045 Chapter 13 Solution Manual Part 2
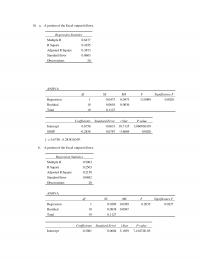
10. a. A portion of the Excel output follows. Regression Statistics Multiple R 0.6477 R Square 0.4195 Adjusted R Square 0.3873 Standard Error 0.0603 Observations 20 ANOVA df SS MS F Significance F Regression 1 0.0473 0.0473 13.0099 0.0020 Residual […]
978-1285867045 Chapter 13 Solution Manual Part 3
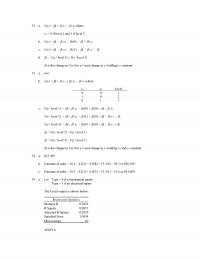
32. a. E(y) = + x1 + x2 where x2 = 0 if level 1 and 1 if level 2 33. a. two b. E(y) = + x1 + […]
978-1285867045 Chapter 13 Solution Manual Part 4
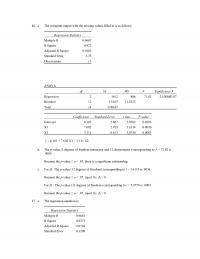
46. a. The computer output with the missing values filled in is as follows: Regression Statistics Multiple R 0.9607 R Square 0.923 Adjusted R Square 0.9102 Standard Error 3.35 Observations 15 ANOVA df SS MS F Significance F Regression 2 […]
978-1285867045 Chapter 14 Case
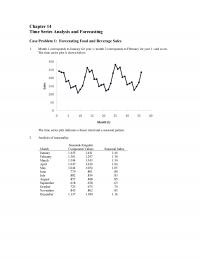
Chapter 14 Time Series Analysis and Forecasting Case Problem 1: Forecasting Food and Beverage Sales 1. Month 1 corresponds to January for year 1; month 2 corresponds to February for year 1; and so on. The time series plot is […]
978-1285867045 Chapter 14 Solution Manual Part 1
Chapter 14 Time Series Analysis and Forecasting Learning Objectives 1. Be able to construct a time series plot and identify the underlying pattern in the data. 2. Understand how to measure forecast accuracy. 3. Be able to use smoothing techniques […]
978-1285867045 Chapter 14 Solution Manual Part 2
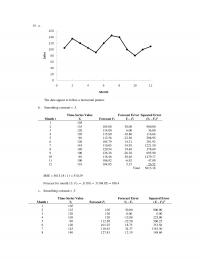
14. a. The data appear to follow a horizontal pattern. b. Smoothing constant = .3. Month t Time-Series Value Yt Forecast Ft Forecast Error Yt – Ft Squared Error (Yt – Ft)2 1 105 2 135 105.00 30.00 900.00 3 […]
978-1285867045 Chapter 14 Solution Manual Part 3
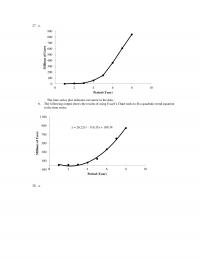
27. a. The time series plot indicates curvature in the data. b. The following output shows the results of using Excel’s Chart tools to fit a quadratic trend equation to the time series. 28. a. 0 100 200 300 400 […]
978-1285867045 Chapter 14 Solution Manual Part 4
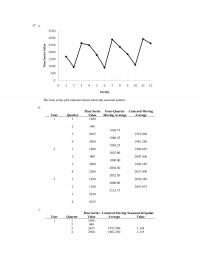
37. a. The time series plot indicates linear trend and seasonal pattern. b. Year Quarter Time Series Value Four-Quarter Moving Average Centered Moving Average 1 1 1690 2 940 1938.75 3 2625 1952.500 1966.25 4 2500 1961.250 1956.25 2 1 […]
978-1285867045 Chapter 14 Solution Manual Part 5
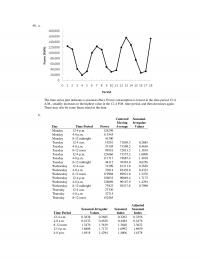
40. a. The time series plot indicates a seasonal effect. Power consumption is lowest in the time period 12–4 A.M., steadily increases to the highest value in the 12-4 P.M. time period, and then decreases again. There may also be […]
978-1285867045 Chapter 14 Solution Manual Part 6
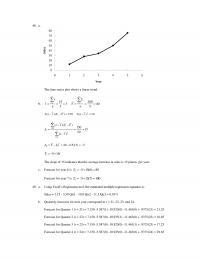
48. a. The time series plot shows a linear trend. b. 12 1 10 () t b tt = = = = − 01 40 (15)(3) 5b Y b t= − = − = − 5 15 t Tt= […]
978-1285867045 Chapter 15 Solution Manual
Chapter 15 Statistical Methods for Quality Control Learning Objectives 1. Learn about the importance of total quality, quality control, and how statistical methods can assist in the quality control process. 2. Be able to construct quality control charts and understand […]
978-1285867045 Chapter 2 Case
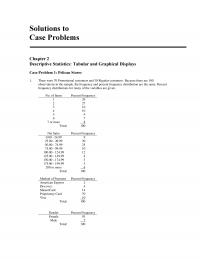
Solutions to Case Problems Chapter 2 Descriptive Statistics: Tabular and Graphical Displays Case Problem 1: Pelican Stores 1. There were 70 Promotional customers and 30 Regular customers. Because there are 100 observations in the sample, the frequency and percent frequency […]
978-1285867045 Chapter 2 Solution Manual Part 1
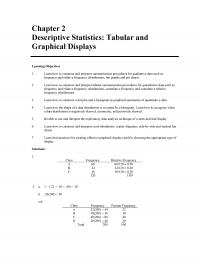
Chapter 2 Descriptive Statistics: Tabular and Graphical Displays Learning Objectives 1. Learn how to construct and interpret summarization procedures for qualitative data such as: frequency and relative frequency distributions, bar graphs and pie charts. 2. Learn how to construct and […]
978-1285867045 Chapter 2 Solution Manual Part 2
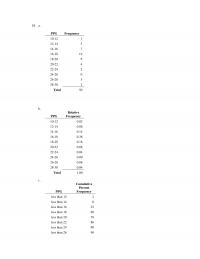
18. a. PPG Frequency 10–12 1 12–14 3 14–16 7 16–18 19 18–20 9 20–22 4 22–24 2 24–26 0 26–28 3 28–30 2 Total 50 b. PPG Relative Frequency 10–12 0.02 12–14 0.06 14–16 0.14 16–18 0.38 18–20 0.18 […]
978-1285867045 Chapter 2 Solution Manual Part 3
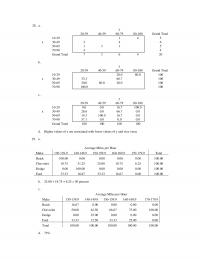
28. a. y 20–39 40–59 60–79 80-100 Grand Total 10–29 1 4 5 x 30–49 2 4 6 50–69 1 3 1 5 70–90 4 4 Grand Total 7 3 6 4 20 b. y 20–39 40–59 60–79 80-100 Grand […]
978-1285867045 Chapter 2 Solution Manual Part 4
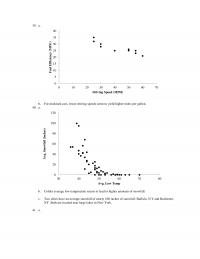
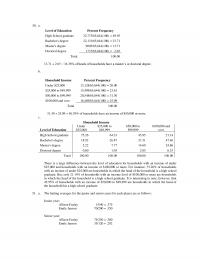
39. a. b. For midsized cars, lower driving speeds seem to yield higher miles per gallon. 40. a. b. Colder average low temperature seems to lead to higher amounts of snowfall. 41. a. c. Two cities have an average snowfall […]
978-1285867045 Chapter 2 Solution Manual Part 5
50. a. Level of Education Percent Frequency High School graduate 32,773/65,644(100) = 49.93 Bachelor’s degree 22,131/65,644(100) = 33.71 Master’s degree 9003/65,644(100) = 13.71 Doctoral degree 1737/65,644(100) = 2.65 Total 100.00 13.71 + 2.65 = 16.36% of heads of households have […]
978-1285867045 Chapter 3 Case
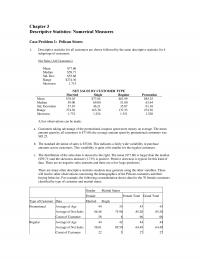
Chapter 3 Descriptive Statistics: Numerical Measures Case Problem 1: Pelican Stores 1. Descriptive statistics for all customers are shown followed by the same descriptive statistics for 4 subgroups of customers. Net Sales (All Customers) Mean $77.60 Median $59.71 Std. Dev. […]
978-1285867045 Chapter 3 Solution Manual Part 1
Chapter 3 Descriptive Statistics: Numerical Measures Learning Objectives 1. Understand the purpose of measures of location. 2. Be able to compute the mean, weighted mean, geometric mean, median, mode, quartiles, and various percentiles. 3. Understand the purpose of measures of […]
978-1285867045 Chapter 3 Solution Manual Part 2
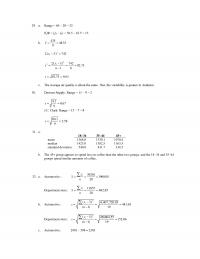
29. a. Range = 60 – 28 = 32 b. IQR = Q3 – Q1 = 56.5 – 43.5 = 13 x= = 435 94833. 2 ( ) 742 i xx − = 18 sn = = = − 92.75 […]
978-1285867045 Chapter 3 Solution Manual Part 3
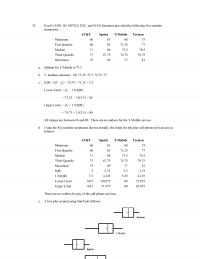
52. Excel’s MIN, QUARTILE.EXC, and MAX functions provided the following five-number summaries: AT&T Sprint T-Mobile Verizon Minimum 66 63 68 75 First Quartile 68 65 71.25 77 Median 71 66 73.5 78.5 Third Quartile 73 67.75 74.75 79.75 Maximum 75 […]
978-1285867045 Chapter 3 Solution Manual Part 4
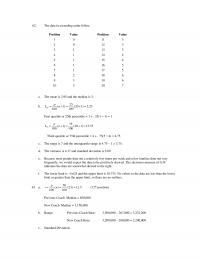
62. The data in ascending order follow. Position Value Position Value 1 0 11 3 2 0 12 3 3 1 13 3 4 1 14 4 5 1 15 4 6 1 16 5 7 1 17 5 8 […]
978-1285867045 Chapter 4 Case
Chapter 4 Introduction to Probability Case Problem: Hamilton County Judges The data in the table provides the basis for the analysis. We provide notes as a guide to answering questions 1 through 5. 1. The conditional probabilities of cases being […]
978-1285867045 Chapter 4 Solution Manual Part 1
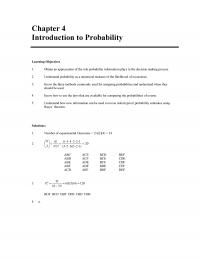
Chapter 4 Introduction to Probability Learning Objectives 1. Obtain an appreciation of the role probability information plays in the decision making process. 2. Understand probability as a numerical measure of the likelihood of occurrence. 3. Know the three methods commonly […]
978-1285867045 Chapter 4 Solution Manual Part 2
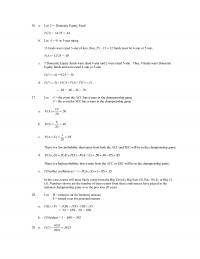
26. a. Let D = Domestic Equity Fund P(D) = 16/25 = .64 b. Let A = 4– or 5-star rating 13 funds were rated 3-star of less; thus, 25 – 13 = 12 funds must be 4-star or 5-star. […]
978-1285867045 Chapter 4 Solution Manual Part 3
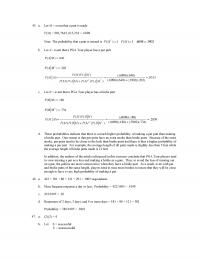
45. a. Let M = event that a putt is made P(M) = 983,764/1,613,234 = .6098 Note: The probability that a putt is missed is P(MC)=1–P(M)=1–.6098 =.3902 b. Let A= event that a PGA Tour player has a par putt […]
978-1285867045 Chapter 5 Solution Manual Part 1
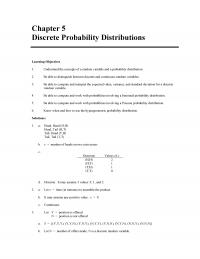
Chapter 5 Discrete Probability Distributions Learning Objectives 1. Understand the concepts of a random variable and a probability distribution. 2. Be able to distinguish between discrete and continuous random variables. 3. Be able to compute and interpret the expected value, […]
978-1285867045 Chapter 5 Solution Manual Part 2
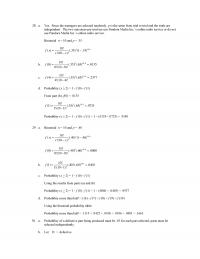
28. a. Yes. Since the teenagers are selected randomly, p is the same from trial to trial and the trials are independent. The two outcomes per trial are use Pandora Media Inc.’s online radio service or do not use Pandora […]
978-1285867045 Chapter 5 Solution Manual Part 3
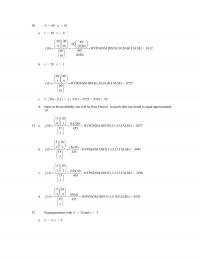
50. N = 60 n = 10 a. r = 20 x = 0 (0) 60! 60 10!50! 10 f = = = HYPGEOM.DIST(0,10,20,60,FALSE) = .0112 b. r = 20 x = 1 20 40 19 (1) […]
978-1285867045 Chapter 6 Case
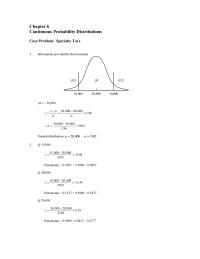
Chapter 6 Continuous Probability Distributions Case Problem: Specialty Toys 1. Information provided by the forecaster At x = 30,000, .025 .025 .95 30,000 20,000 1.96 x z −− = = = 30,000 20,000 5102 1.96 − […]
978-1285867045 Chapter 6 Solution Manual Part 1
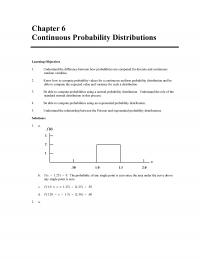
Chapter 6 Continuous Probability Distributions Learning Objectives 1. Understand the difference between how probabilities are computed for discrete and continuous random variables. 2. Know how to compute probability values for a continuous uniform probability distribution and be able to compute […]
978-1285867045 Chapter 6 Solution Manual Part 2
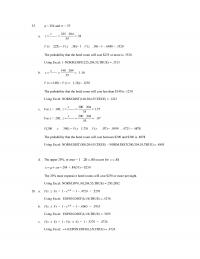
25. = 204 and = 55 a. z=x– m s =225–204 55 =.38 P (x³225) = P (z³.38) = 1 – P (z£.38) = 1 – .6480 = .3520 The probability that the hotel room will cost $225 […]
978-1285867045 Chapter 7 Solution Manual Part 1
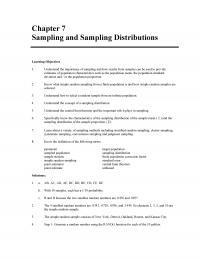
Chapter 7 Sampling and Sampling Distributions Learning Objectives 1. Understand the importance of sampling and how results from samples can be used to provide estimates of population characteristics such as the population mean, the population standard deviation and / or […]
978-1285867045 Chapter 7 Solution Manual Part 2
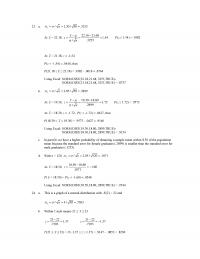
23. a. / 2.30 / 50 .3253 xn = = = At x = 22.18, 22.18 21.68 1.54 .3253 / x zn −− = = = P(z ≤ 1.54) = .9382 At x = 21.18, z = […]
978-1285867045 Chapter 7 Solution Manual Part 3
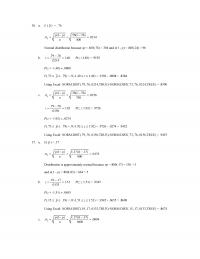
36. a. E ( p ) = .76 400 p n = = = Normal distribution because np = 400(.76) = 304 and n(1 – p) = 400(.24) = 96 (1 ) .76(1 .76) .0214 pp −− b. .79 […]
978-1285867045 Chapter 8 Case
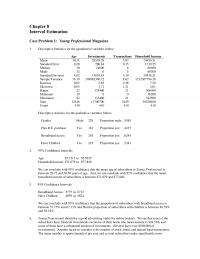
Chapter 8 Interval Estimation Case Problem 1: Young Professional Magazine 1. Descriptive Statistics for the quantitative variables follow: Age Investments Transactions Household Income Mean 30.11 28538.29 5.97 74459.51 Standard Error 0.20 780.84 0.15 1719.55 Median 30 24800 6 66050 Mode […]
978-1285867045 Chapter 8 Solution Manual Part 1
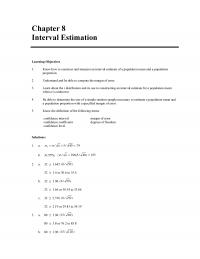
Chapter 8 Interval Estimation Learning Objectives 1. Know how to construct and interpret an interval estimate of a population mean and a population proportion. 2. Understand and be able to compute the margin of error. 3. Learn about the t […]
978-1285867045 Chapter 8 Solution Manual Part 2
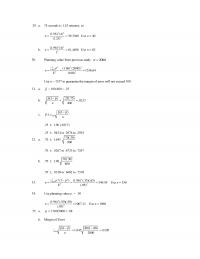
29. a. 75 seconds is 1.25 minutes, so 22 2 (1.96) (4) 39.3380 (1.25) n== Use n = 40 b. n== Use n = 62 22 2 (1.96) (4) 61.4656 1 30. Planning value from previous study: 2000 = […]
978-1285867045 Chapter 9 Case
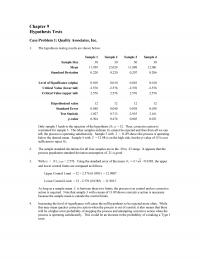
Chapter 9 Hypothesis Tests Case Problem 1: Quality Associates, Inc. 1. The hypothesis testing results are shown below: Sample 1 Sample 2 Sample 3 Sample 4 Sample Size 30 30 30 30 Mean 11.959 12.029 11.889 12.081 Standard Deviation 0.220 […]
978-1285867045 Chapter 9 Solution Manual Part 1
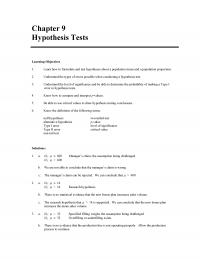
Chapter 9 Hypothesis Tests Learning Objectives 1. Learn how to formulate and test hypotheses about a population mean and a population proportion. 2. Understand the types of errors possible when conducting a hypothesis test. 3. Understand the level of significance […]
978-1285867045 Chapter 9 Solution Manual Part 2
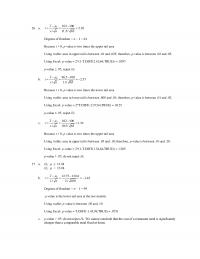
26. a. 0103 100 2.10 / 11.5/ 65 x tsn −− = = = Degrees of freedom = n – 1 = 64 b. Because t > 0, p-value is two times the upper tail area Using t table; […]
978-1285867045 Chapter 9 Solution Manual Part 3
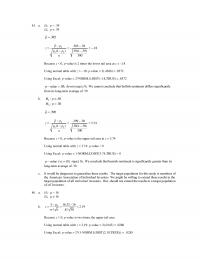
45. a. H0: p = .39 Ha: p .39 .385p= 0 00 .385 .39 .18 (1 ) .39(1 .39) 300 pp zpp n −− = = = − −− Because z < 0, p-value is 2 times the lower […]
Management Chapter 1 Fortune 500 Companies Showed The Following Revenues
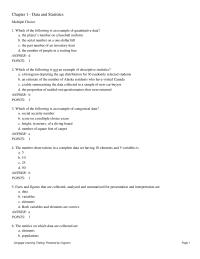
Chapter 1 – Data and Statistics Multiple Choice 1. Which of the following is an example of quantitative data? a. the player’s number on a baseball uniform b. the serial number on a one-dollar bill c. the part number of […]
Management Chapter 10 Answer Points 105 The Critical Value With
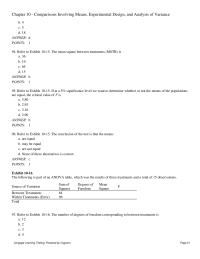
Chapter 10 – Comparisons Involving Means, Experimental Design, and Analysis of Variance b. 4 c. 5 d. 18 ANSWER: d POINTS: 1 94. Refer to Exhibit 10–15. The mean square between treatments (MSTR) is a. 36 b. 16 c. 64 […]
Management Chapter 10 Comparisons Involving Means, Experimental Design, and
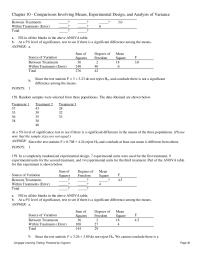
Chapter 10 – Comparisons Involving Means, Experimental Design, and Analysis of Variance Between Treatments _____? _____? _____? 3.0 Within Treatments (Error) _____? _____? 6 Total _____? _____? a. Fill in all the blanks in the above ANOVA table. b. At […]
Management Chapter 10 The Sample Sizes Are And 35 The
Chapter 10 – Comparisons Involving Means, Experimental Design, and Analysis of Variance Multiple Choice 1. To compute an interval estimate for the difference between the means of two populations, the t distribution a. is restricted to small sample situations b. […]
Management Chapter 11 Cengage Learning Testing Powered Cognero Page
Chapter 11 – Comparisons Involving Proportions and a Test of Independence Multiple Choice 1. A population where each element of the population is assigned to one and only one of several classes or categories is a a. multinomial population b. […]
Management Chapter 11 The Results The Survey Are Shown Below
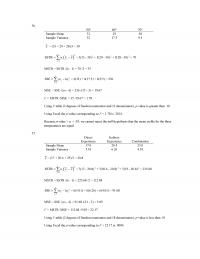
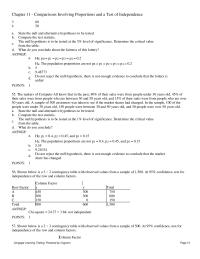
Chapter 11 – Comparisons Involving Proportions and a Test of Independence 3 60 4 50 a. State the null and alternative hypotheses to be tested. b. Compute the test statistic. c. The null hypothesis is to be tested at the […]
Management Chapter 12 Company Has Recorded Data The Daily
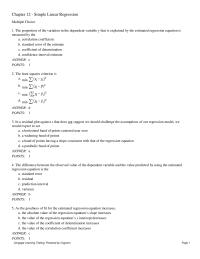
Chapter 12 – Simple Linear Regression Multiple Choice 1. The proportion of the variation in the dependent variable y that is explained by the estimated regression equation is measured by the a. correlation coefficient b. standard error of the estimate […]
Management Chapter 12 what has been the sample size for this problem?
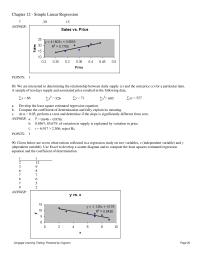
Chapter 12 – Simple Linear Regression 7 .29 15 ANSWER: POINTS: 1 89. We are interested in determining the relationship between daily supply (y) and the unit price (x) for a particular item. A sample of ten days supply and […]
Management Chapter 13 The multiple coefficient of determination is
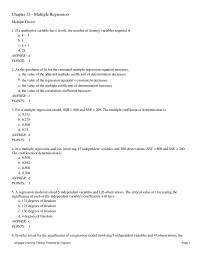
Chapter 13 – Multiple Regression Multiple Choice 1. If a qualitative variable has k levels, the number of dummy variables required is a. k − 1 b. k c. k + 1 d. 2k ANSWER: a POINTS: 1 2. As […]
Management Chapter 13 Variation The Dependent Variable Explained
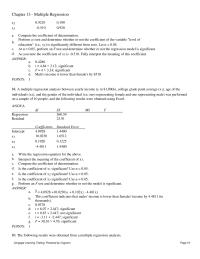
Chapter 13 – Multiple Regression x2 0.9210 0.190 x3 -0.510 0.920 a. Compute the coefficient of determination. b. Perform a t test and determine whether or not the coefficient of the variable “level of education” (i.e., x2) is significantly different […]
Management Chapter 14 Below You Are Given The Seasonal
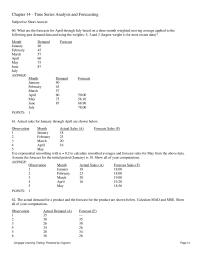
Chapter 14 – Time Series Analysis and Forecasting Subjective Short Answer 60. What are the forecasts for April through July based on a three-month weighted moving average applied to the following past demand data and using the weights: 5, 3,and […]
Management Chapter 14 Gradual Shifting Movement Time Series Relatively Higher
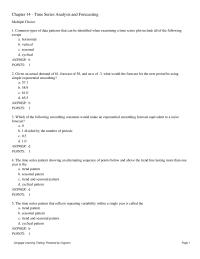
Chapter 14 – Time Series Analysis and Forecasting Multiple Choice 1. Common types of data patterns that can be identified when examining a time series plot include all of the following except a. horizontal b. vertical c. seasonal d. cyclical […]
Management Chapter 15 Both statistical process control and acceptance
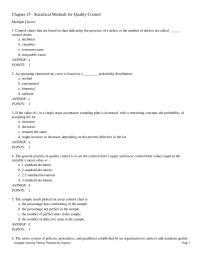
Chapter 15 – Statistical Methods for Quality Control Multiple Choice 1. Control charts that are based on data indicating the presence of a defect or the number of defects are called ______ control charts. a. attributes b. variables c. common-cause […]
Management Chapter 15 Compute The Upper Limit Center Line And
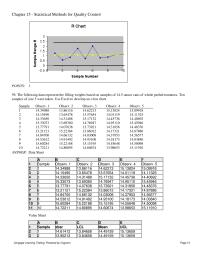
Chapter 15 – Statistical Methods for Quality Control POINTS: 1 59. The following data represent the filling weights based on samples of 14.5 ounce cans of whole peeled tomatoes. Ten samples of size 5 were taken. Use Excel to develop […]
Management Chapter 2 Refer Exhibit 23 The Relative Frequency Workers
Chapter 2 – Descriptive Statistics: Tabular and Graphical Displays Multiple Choice 1. The minimum number of variables represented in a bar chart is a. 1 b. 2 c. 3 d. 4 ANSWER: a POINTS: 1 2. The minimum number of […]
Management Chapter 2 The Manager Hudson Auto Repair Would
Chapter 2 – Descriptive Statistics: Tabular and Graphical Displays Cengage Learning Testing, Powered by Cognero Page 19 93. Forty shoppers were asked if they preferred the weight of a can of soup to be 6 ounces, 8 ounces, or 10 […]
Management Chapter 3 A numerical measure computed from a sample, such as sample mean
Chapter 3 – Descriptive Statistics: Numerical Measures Multiple Choice 1. The interquartile range is the difference between the a. first and second quartiles b. first and third quartiles c. second and third quartiles d. second and fourth quartiles ANSWER: b […]
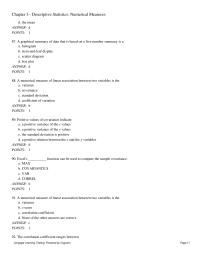
Management Chapter 3 Compute The Coefficient Variatione Determine The 25th
Chapter 3 – Descriptive Statistics: Numerical Measures d. the mean ANSWER: d POINTS: 1 87. A graphical summary of data that is based on a five-number summary is a a. histogram b. stem-and-leaf display c. scatter diagram d. box plot […]
Management Chapter 4 The outcome of each game can be win, loseor tie
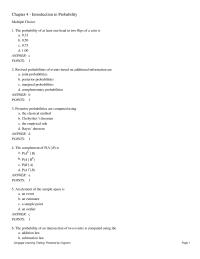
Chapter 4 – Introduction to Probability Multiple Choice 1. The probability of at least one head in two flips of a coin is a. 0.33 b. 0.50 c. 0.75 d. 1.00 ANSWER: c POINTS: 1 2. Revised probabilities of events […]
Management Chapter 4 What The Probability That Number Larger Than
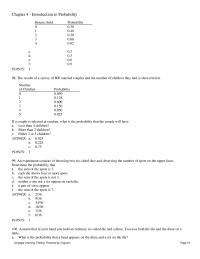
Chapter 4 – Introduction to Probability Cengage Learning Testing, Powered by Cognero Page 19 98. The results of a survey of 800 married couples and the number of children they had is shown below. Number of Children Probability 0 0.050 […]
Management Chapter 5 Define The Random Variable Words For This
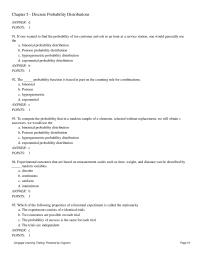
Chapter 5 – Discrete Probability Distributions ANSWER: d POINTS: 1 91. If one wanted to find the probability of ten customer arrivals in an hour at a service station, one would generally use the a. binomial probability distribution b. Poisson […]
Management Chapter 5 Which The Following Not Property Binomial Experimenta
Chapter 5 – Discrete Probability Distributions Multiple Choice 1. A numerical description of the outcome of an experiment is called a a. descriptive statistic b. probability function c. variance d. random variable ANSWER: d POINTS: 1 2. A random variable […]
Management Chapter 6 What Percentage All Cans Produced Contains Less
Chapter 6 – Continuous Probability Distributions b. 0.0606 c. 0.3935 d. 0.9393 ANSWER: c POINTS: 1 87. Refer to Exhibit 6-7. The probability that x is between 3 and 6 is a. 0.4512 b. 0.1920 c. 0.2592 d. 0.6065 ANSWER: […]
Management Chapter 6 Whenever the probability is proportional to the length
Chapter 6 – Continuous Probability Distributions Multiple Choice 1. If arrivals follow a Poisson probability distribution, the time between successive arrivals must follow a. a Poisson probability distribution b. a normal probability distribution c. a uniform probability distribution d. an […]
Management Chapter 7 General Rule The Sampling Distribution The
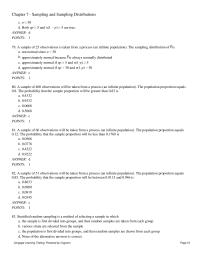
Chapter 7 – Sampling and Sampling Distributions Multiple Choice 1. The expected value of equals the mean of the population from which the sample is drawn a. only if the sample size is 30 or greater b. only if the […]
Management Chapter 7 Sample New Models Automobiles Provides The
Chapter 7 – Sampling and Sampling Distributions c. n ≥ 30 d. Both np ≥ 5 and n(1 − p) ≥ 5 are true. ANSWER: d POINTS: 1 79. A sample of 25 observations is taken from a process (an […]
Management Chapter 8 The Population Standard Deviation Known Which Excel
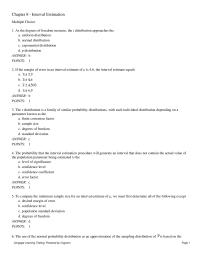
Chapter 8 – Interval Estimation Multiple Choice 1. As the degrees of freedom increase, the t distribution approaches the a. uniform distribution b. normal distribution c. exponential distribution d. p distribution ANSWER: b POINTS: 1 2. If the margin of […]
Management Chapter 8 What can be said about the sampling distributio
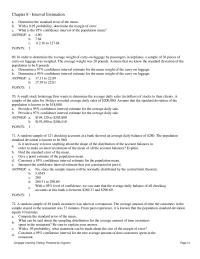
Chapter 8 – Interval Estimation a. Determine the standard error of the mean. b. With a 0.95 probability, determine the margin of error. c. What is the 95% confidence interval of the population mean? ANSWER: a. 4.00 b. 7.84 c. […]
Management Chapter 9 Answer Points 11 For Two tailed Hypothesis Test
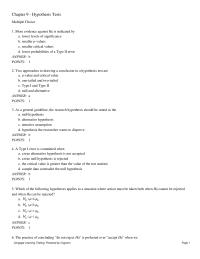
Chapter 9 – Hypothesis Tests Multiple Choice 1. More evidence against H0 is indicated by a. lower levels of significance b. smaller p-values c. smaller critical values d. lower probabilities of a Type II error ANSWER: b POINTS: 1 2. […]
Management Chapter 9 Type Type Error The Conclusion Accept Puts
Chapter 9 – Hypothesis Tests a. less than or equal to b. less than or equal to 2α c. greater than or equal to d. greater than or equal to 2α ANSWER: a POINTS: 1 78. If a […]