50. a.
Level of Education
Percent Frequency
High School graduate
32,773/65,644(100) = 49.93
Bachelor’s degree
22,131/65,644(100) = 33.71
Master’s degree
9003/65,644(100) = 13.71
Doctoral degree
1737/65,644(100) = 2.65
Total
100.00
13.71 + 2.65 = 16.36% of heads of households have a master’s or doctoral degree.
b.
Household Income
Percent Frequency
Under $25,000
13,128/65,644(100) = 20.00
$25,000 to $49,999
15,499/65,644(100) = 23.61
$50,000 to $99,999
20,548/65,644(100) = 31.30
$100,000 and over
16,469/65,644(100) = 25.09
Total
100.00
31.30 + 25.09 = 56.39% of households have an income of $50,000 or more.
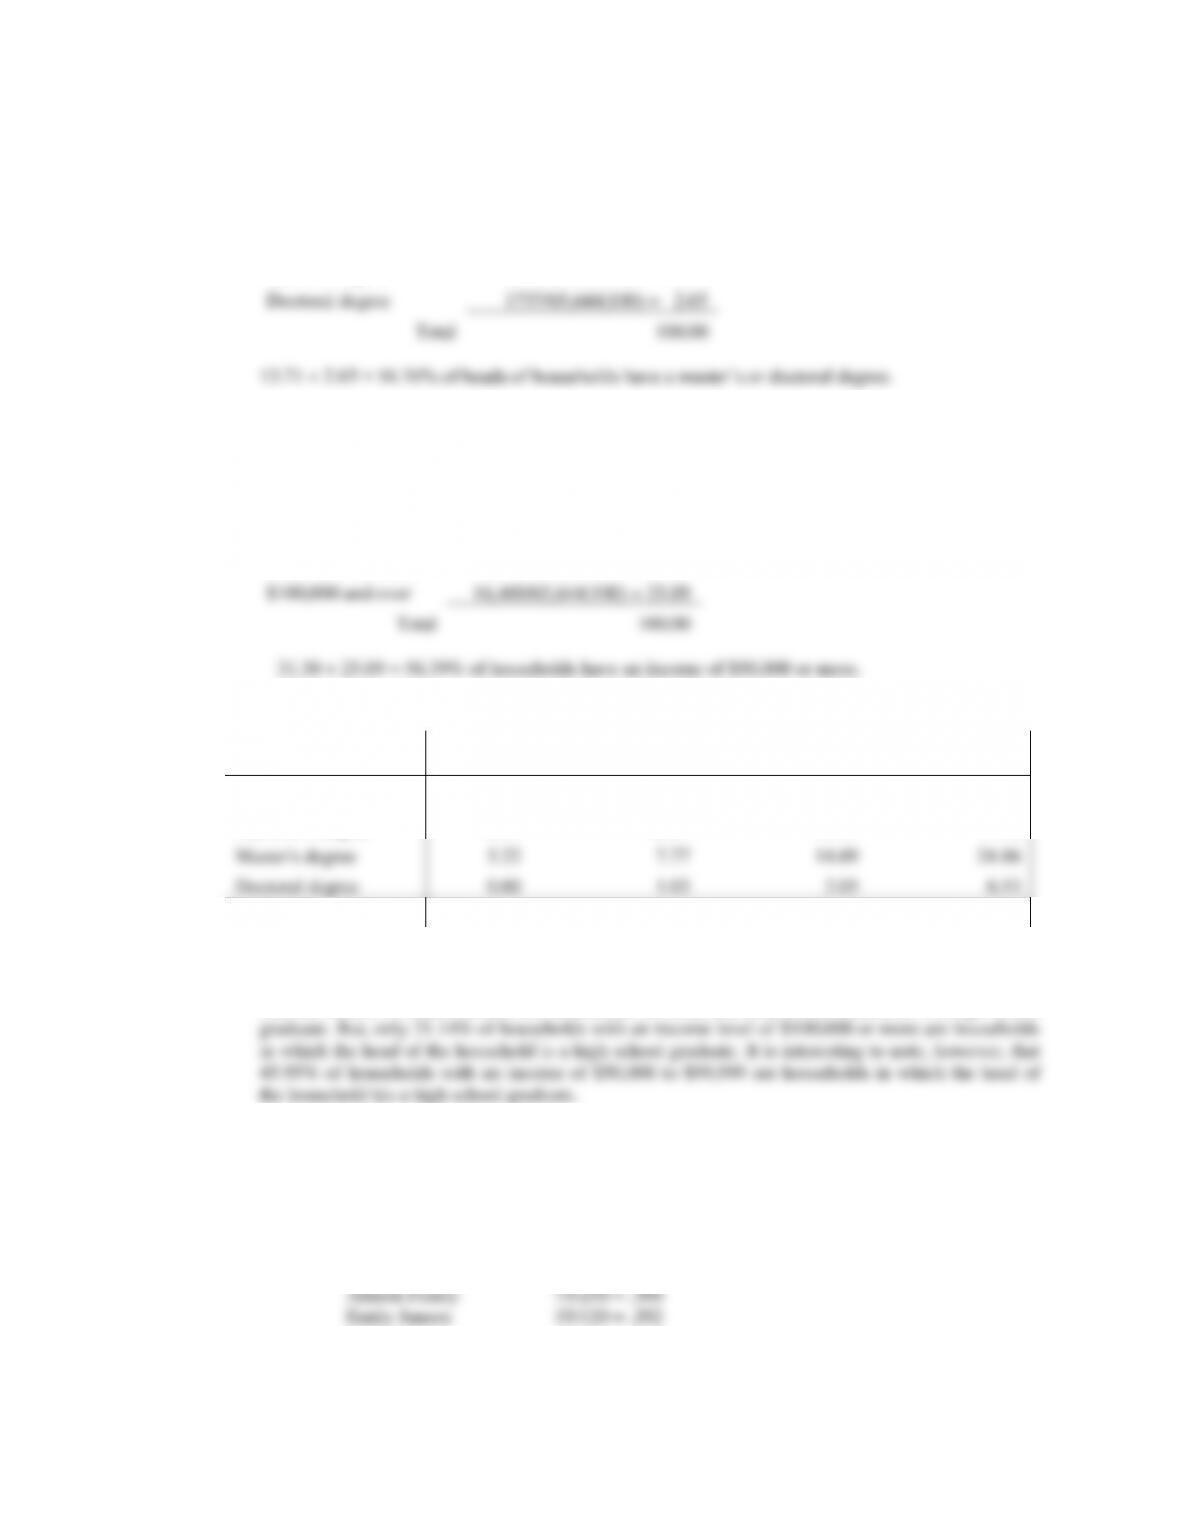
c.
Household Income
Level of Education
Under
$25,000
$25,000 to
$49,999
$50,000 to
$99,999
$100,000 and
over
High School graduate
75.26
64.33
45.95
21.14
Bachelor’s degree
18.92
26.87
37.31
47.46
Master’s degree
5.22
7.77
14.69
24.86
Doctoral degree
0.60
1.03
2.05
6.53
Total
100.00
100.00
100.00
100.00
There is a large difference between the level of education for households with an income of under
$25,000 and households with an income of $100,000 or more. For instance, 75.26% of households
with an income of under $25,000 are households in which the head of the household is a high school
51. a. The batting averages for the junior and senior years for each player are as follows:
Junior year:
Allison Fealey 15/40 = .375
Emily Janson 70/200 = .350
Senior year:
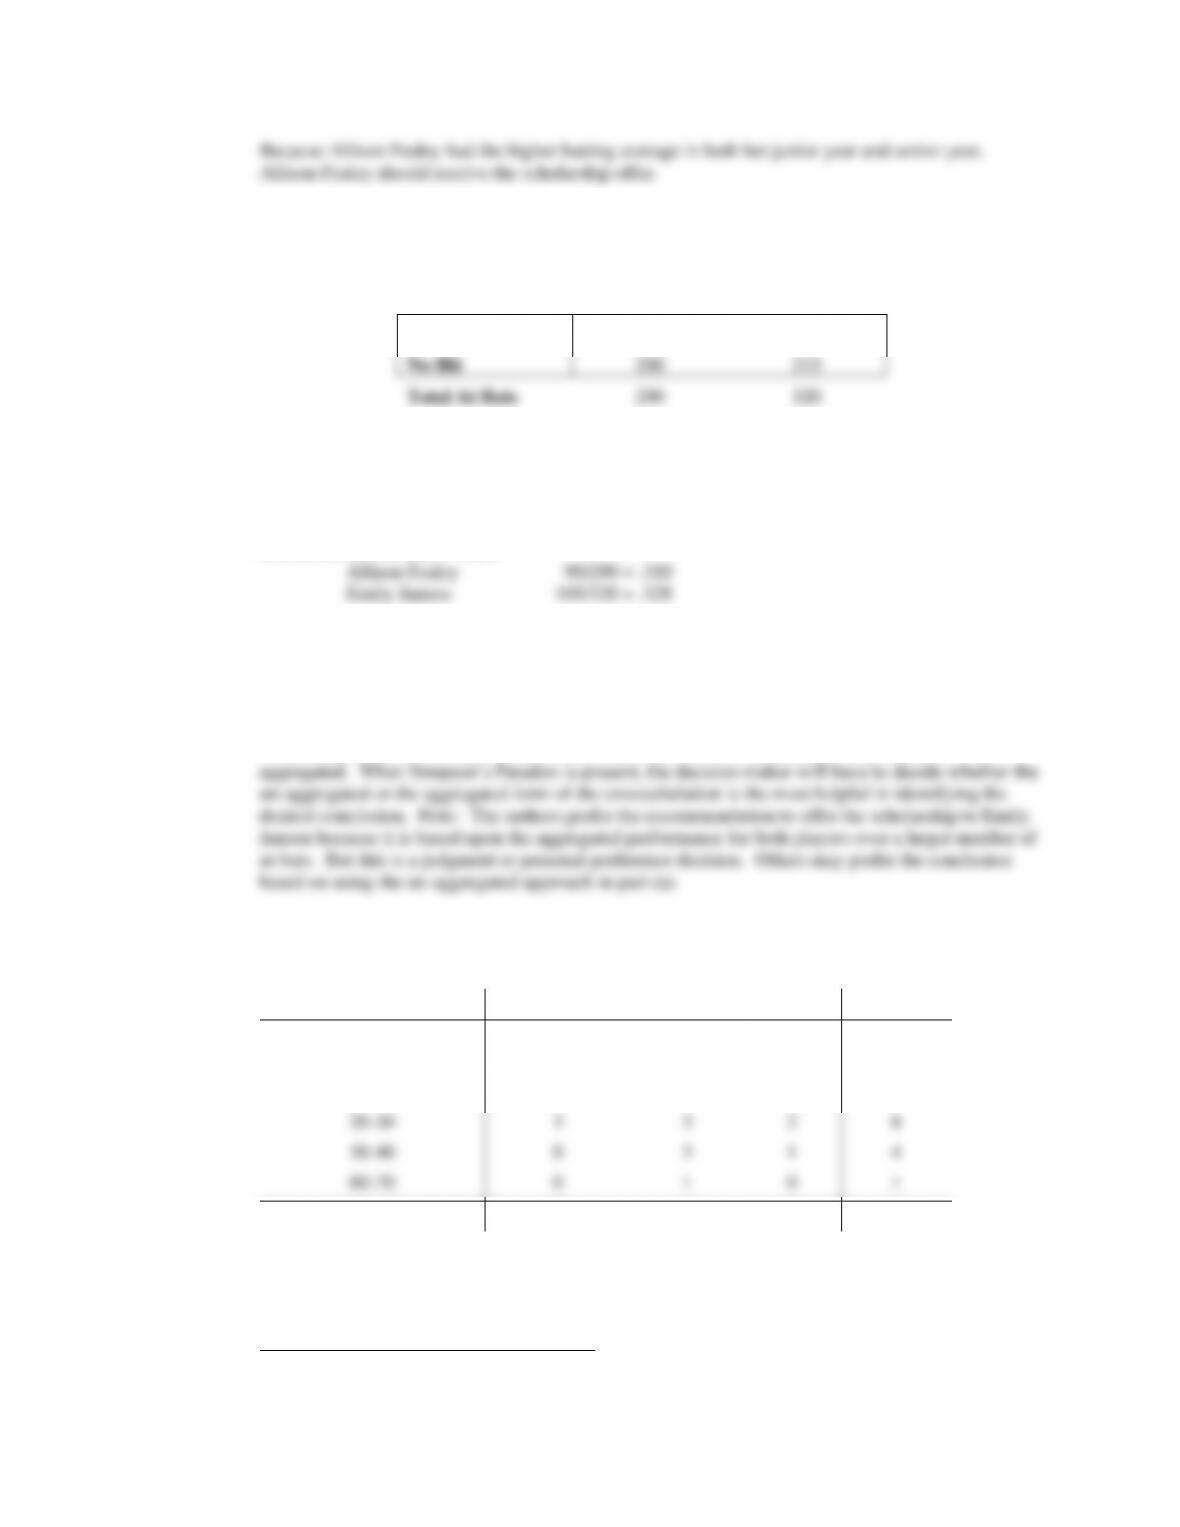
b. The combined or aggregated two-year crosstabulation is as follows:
Based on this crosstabulation, the batting average for each player is as follows:
Combined Junior/Senior Years
Because Emily Janson has the higher batting average over the combined junior and senior years,
Emily Janson should receive the scholarship offer.
c. The recommendations in parts (a) and (b) are not consistent. This is an example of Simpson’s
Paradox. It shows that in interpreting the results based upon separate or un-aggregated
crosstabulations, the conclusion can be reversed when the crosstabulations are grouped or
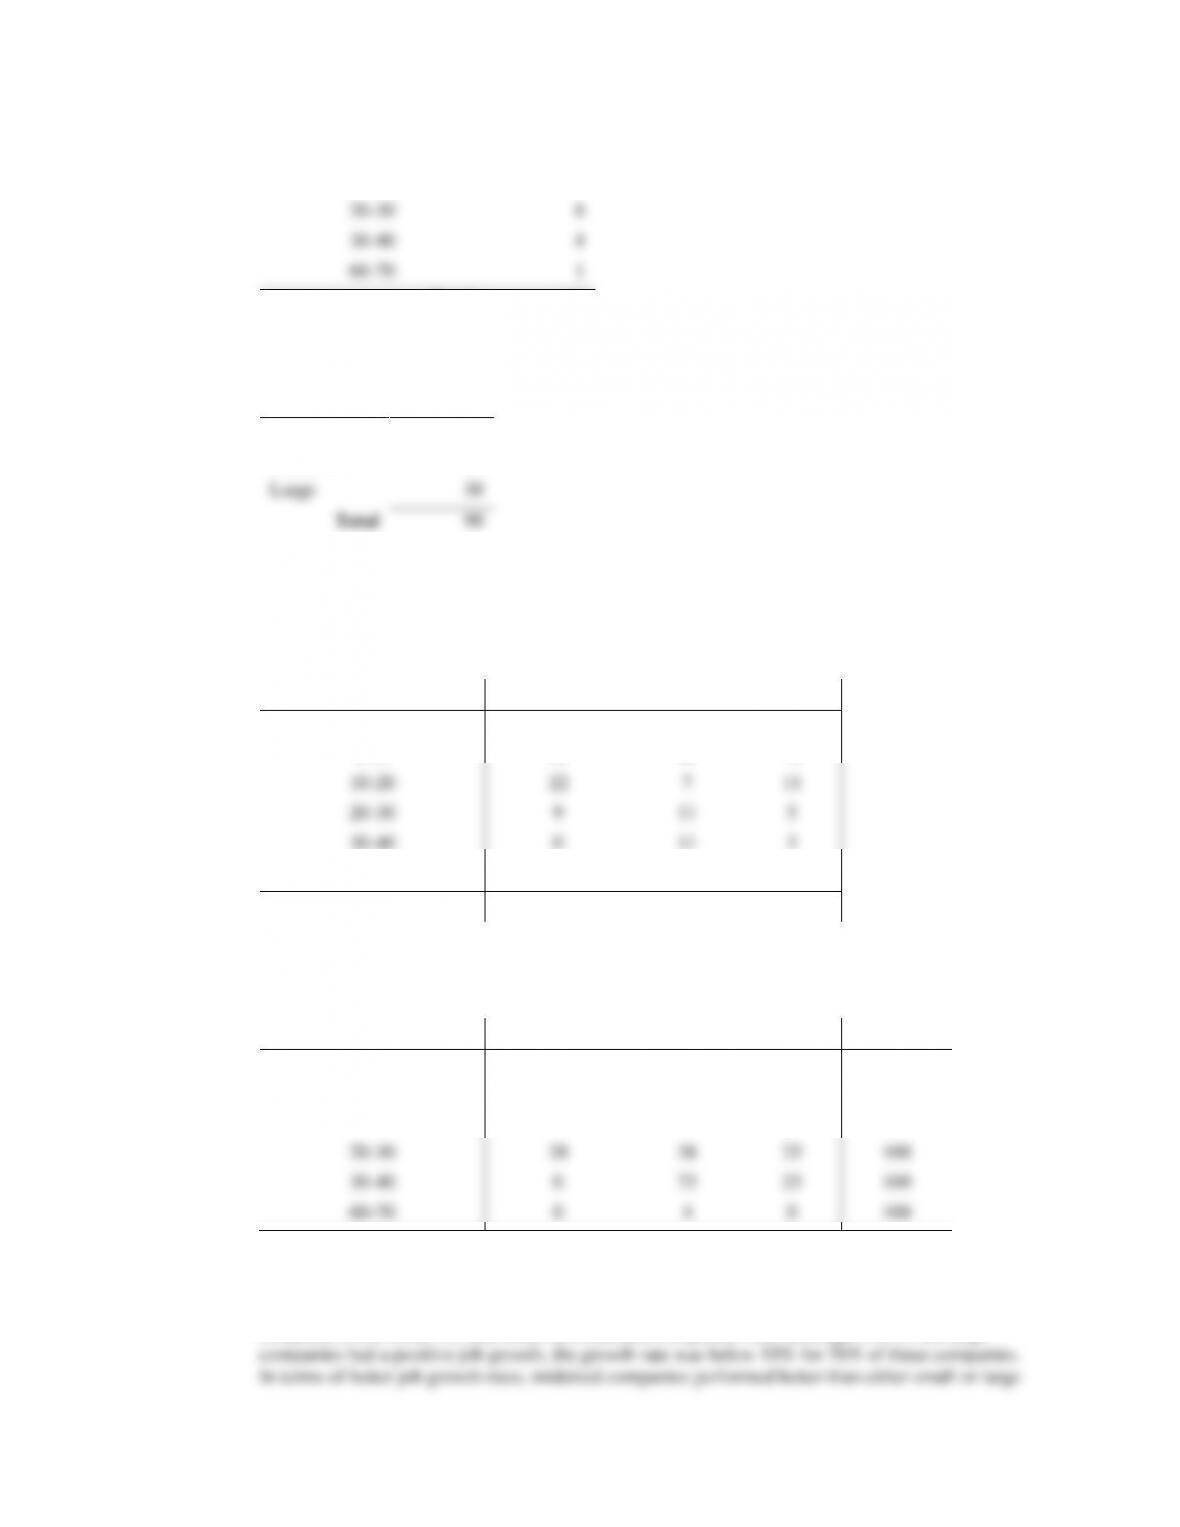
52 a.
Size of Company
Job Growth (%)
Small
Midsized
Large
Total
–10-0
4
6
2
12
0-10
18
13
29
60
10–20
7
2
4
13
20–30
3
3
2
8
30–40
0
3
1
4
60–70
0
1
0
1
Total
32
28
38
98
b. Frequency distribution for growth rate.
Job Growth (%)
Total
–10-0
12
Combined 2-Year Batting
Outcome
A. Fealey
E. Jansen
Hit
90
105
No Hit
200
215
Total At Bats
290
320
0-10
60
10–20
13
20–30
8
30–40
4
60–70
1
Total
98
Frequency distribution for size of company.
Size
Total
Small
32
Medium
28
Large
38
Total
98
c. Crosstabulation showing column percentages.
Size of Company
Job Growth (%)
Small
Midsized
Large
–10-0
13
21
5
0-10
56
46
76
10–20
22
7
11
20–30
9
11
5
30–40
0
11
3
60–70
0
4
0
Total
100
100
100
d. Crosstabulation showing row percentages.
Size of Company
Job Growth (%)
Small
Midsized
Large
Total
–10-0
33
50
17
100
0-10
30
22
48
100
10–20
54
15
31
100
20–30
38
38
25
100
30–40
0
75
25
100
60–70
0
4
0
100
e. 12 companies had a negative job growth: 13% were small companies; 21% were midsized
companies; and 5% were large companies. So, in terms of avoiding negative job growth, large
companies were better off than small and midsized companies. But, although 95% of the large
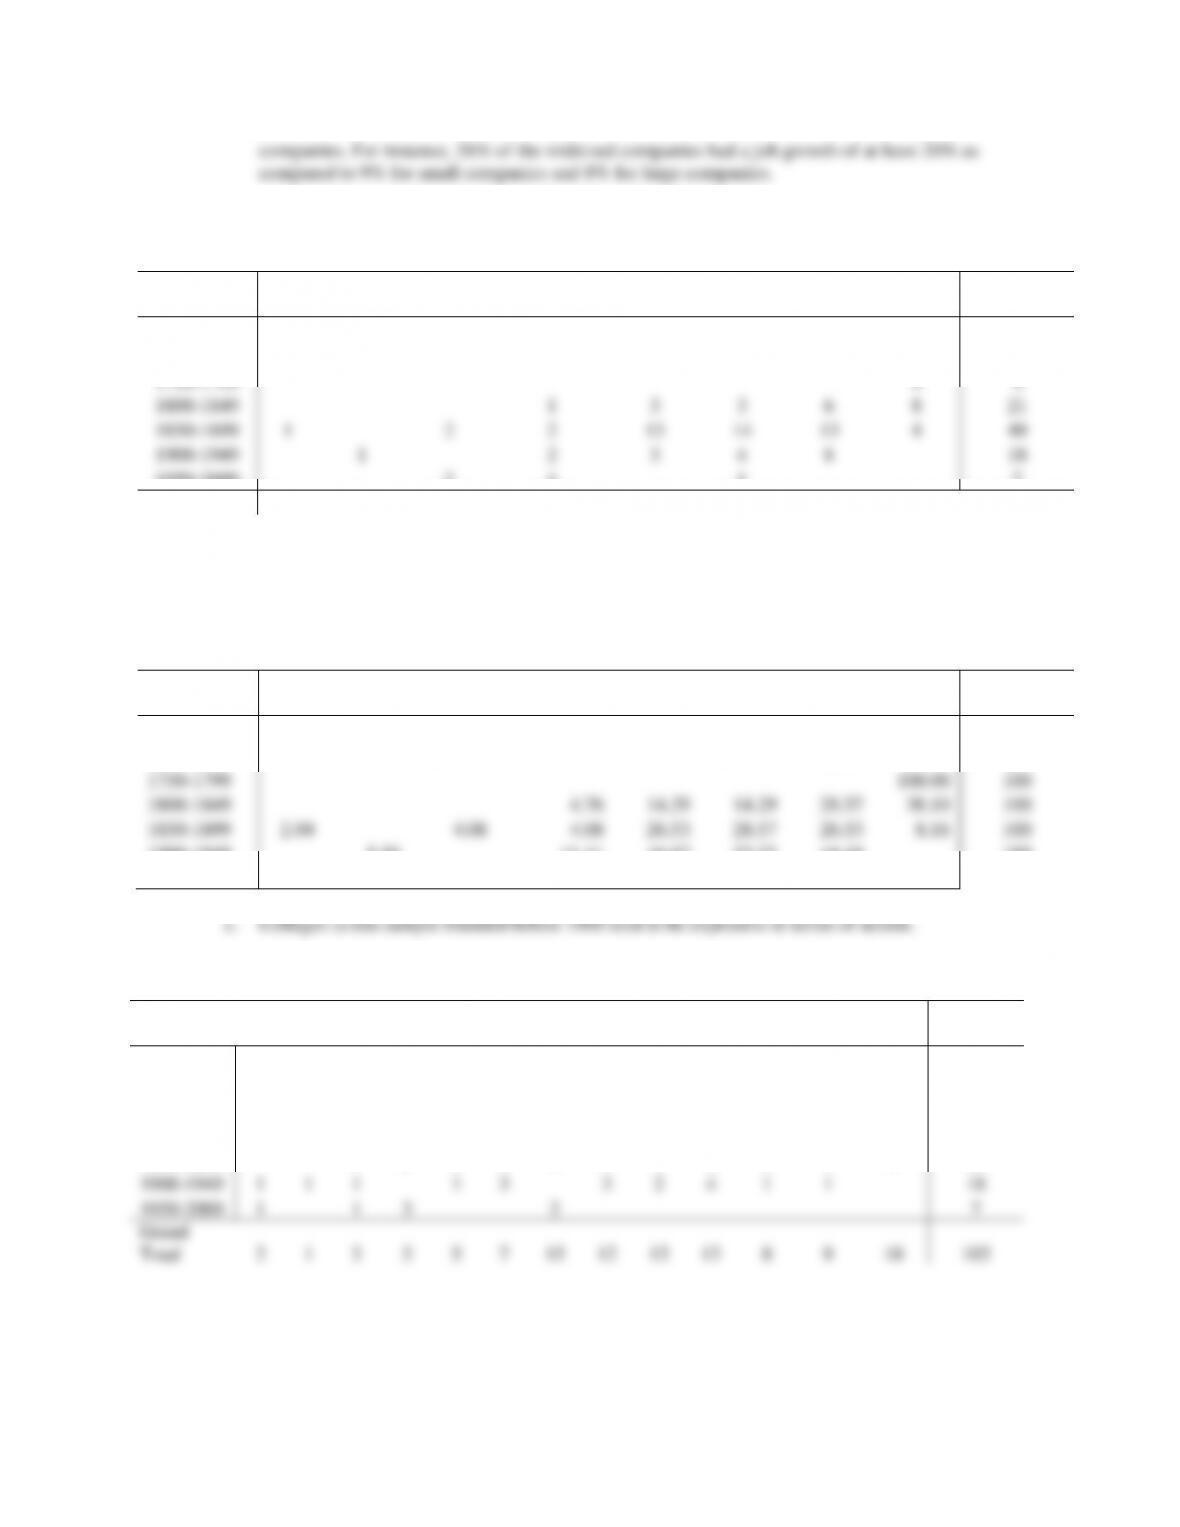
53. a.
Tution &
Fees ($)
Year
Founded
1-
5000
10001-
15000
15001-
20000
20001-
25000
25001-
30000
30001-
35000
35001-
40000
40001-
45000
Total
1600-1649
1
1
1700-1749
2
1
3
1750-1799
4
4
1800-1849
1
3
3
6
8
21
1850-1899
1
2
2
13
14
13
4
49
1900-1949
1
2
3
4
8
18
1950-2000
2
4
1
7
Total
1
1
4
9
19
22
30
17
103
b.
Tuition &
Fees ($)
Year
Founded
1-
5000
10001-
15000
15001-
20000
20001-
25000
25001-
30000
30001-
35000
35001-
40000
40001-
45000
Grand
Total
1600-1649
100.00
100
1700-1749
66.67
33.33
100
1750-1799
100.00
100
1800-1849
4.76
14.29
14.29
28.57
38.10
100
1850-1899
2.04
4.08
4.08
26.53
28.57
26.53
8.16
100
1900-1949
5.56
11.11
16.67
22.22
44.44
100
1950-2000
28.57
57.14
14.29
100
c. Colleges in this sample founded before 1800 tend to be expensive in terms of tuition.
54. a.
% Graduate
Year
Founded
35–
40
40–
45
45–
50
50–
55
55–
60
60–
65
65–
70
70–
75
75–
80
80–
85
85–
90
90–
95
95–
100
Grand
Total
1600-1649
1
1
1700-1749
3
3
1750-1799
1
3
4
1800-1849
1
2
4
2
3
4
3
2
21
1850-1899
1
2
4
3
11
5
9
6
3
4
1
49
1900-1949
1
1
1
1
3
3
2
4
1
1
18
1950-2000
1
1
3
2
7
Grand
Total
2
1
3
5
5
7
15
12
13
13
8
9
10
103
b.
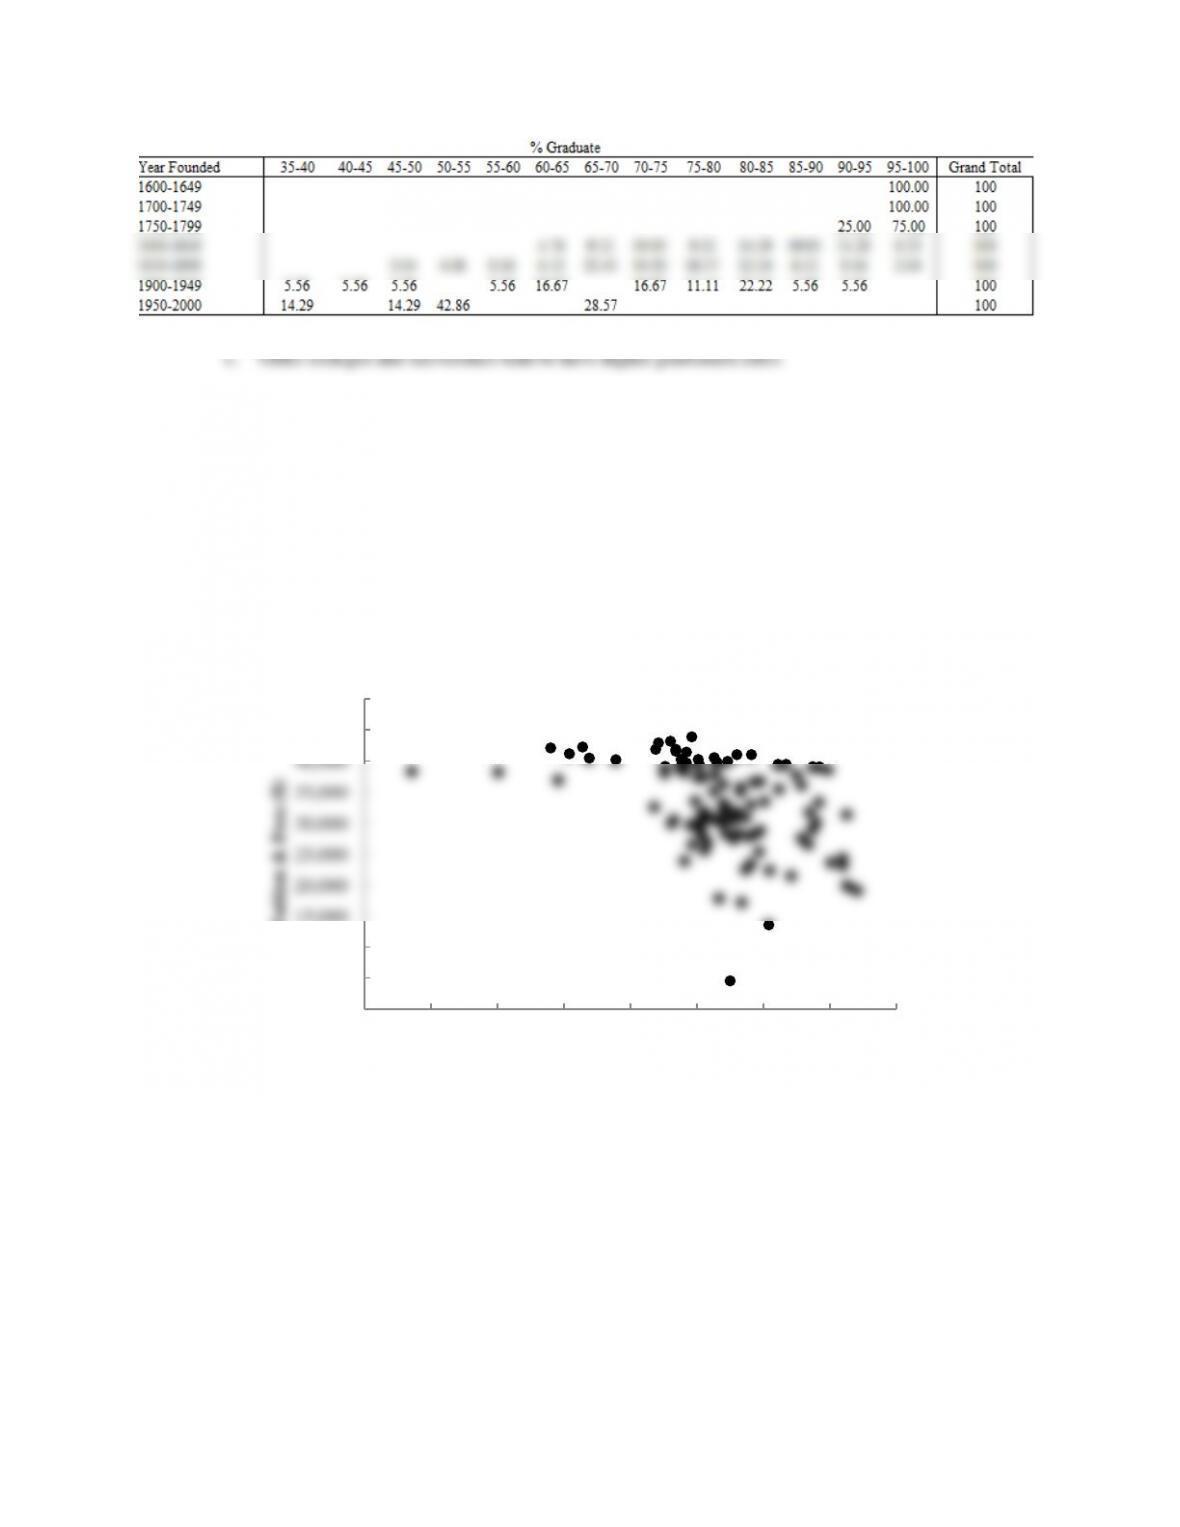
c. Older colleges and universities tend to have higher graduation rates.
55. a.
b. Older colleges and universities tend to be more expensive.
56. a.
0
5,000
10,000
15,000
20,000
25,000
30,000
35,000
40,000
45,000
50,000
1600 1650 1700 1750 1800 1850 1900 1950 2000
Tuition & Fees ($)
Year Founded
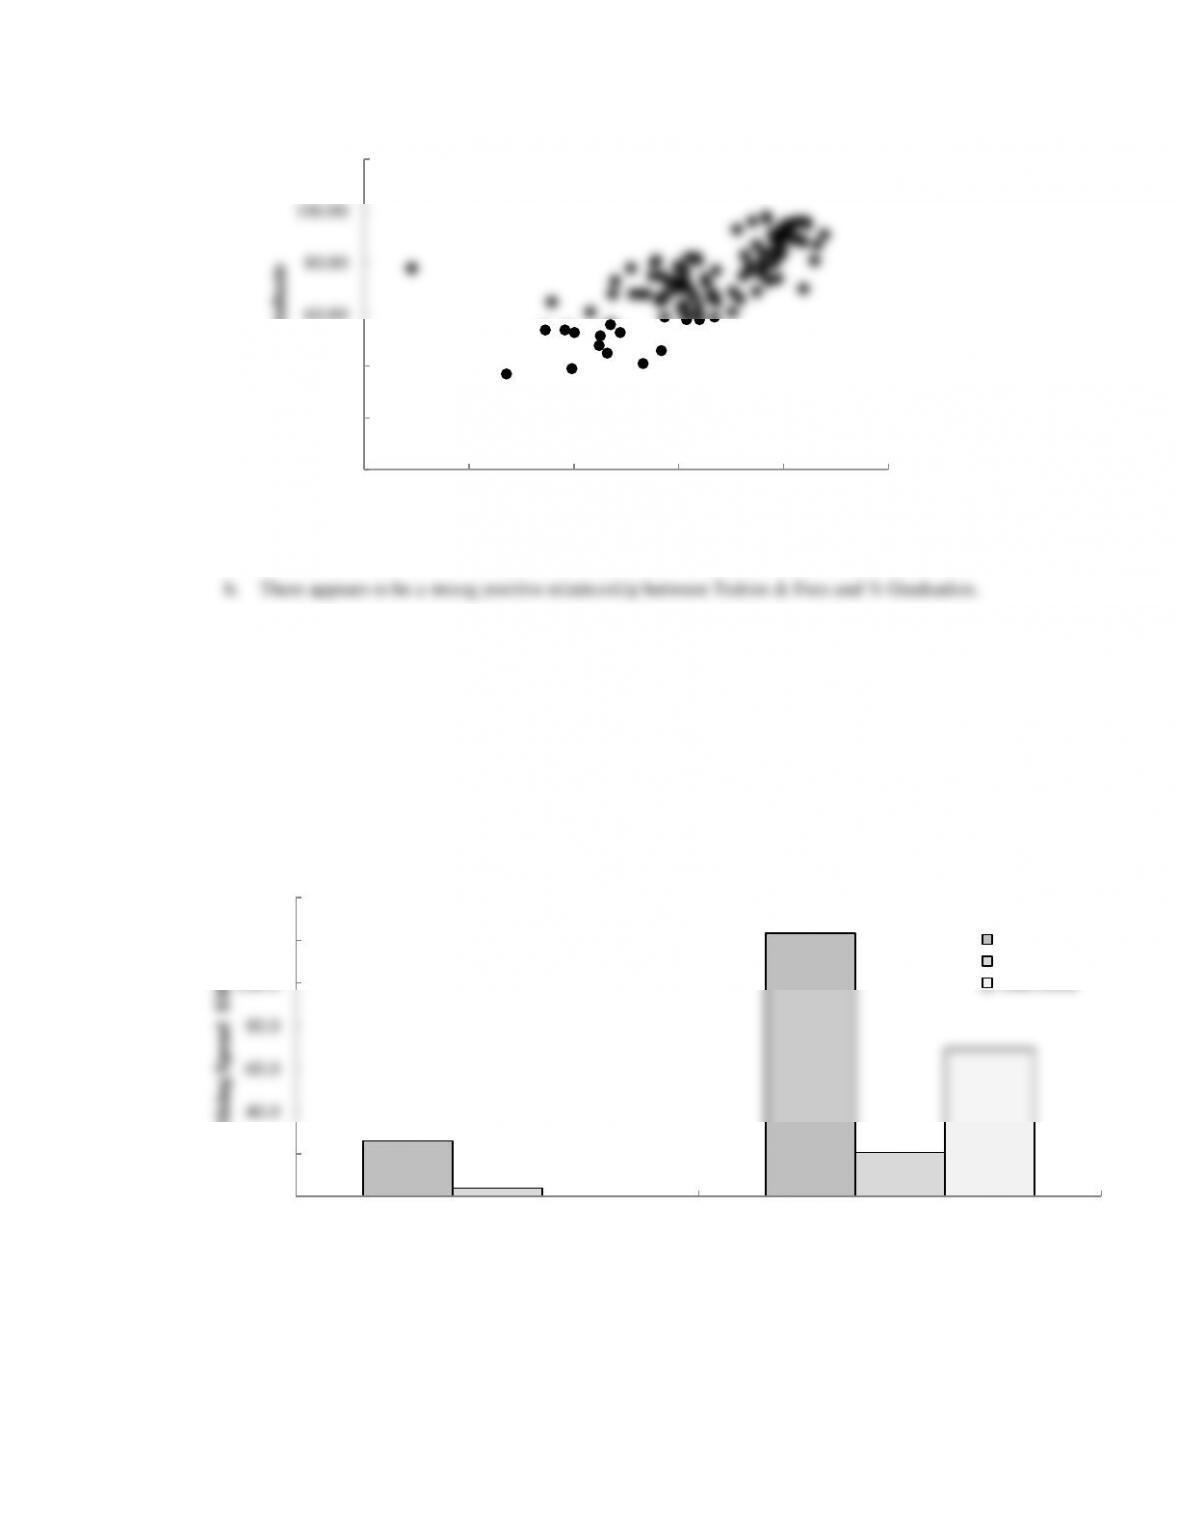
b. There appears to be a strong positive relationship between Tuition & Fees and % Graduation.
57. a.
b.
2008
2011
Internet
86.7%
57.8%
0.00
20.00
40.00
60.00
80.00
100.00
120.00
0 10,000 20,000 30,000 40,000 50,000
% Graduate
Tuition & Fees ($)
0.0
20.0
40.0
60.0
80.0
100.0
120.0
140.0
2008 2011
Advertising Spend $Millions
Year
Internet
Newspaper etc.
Television
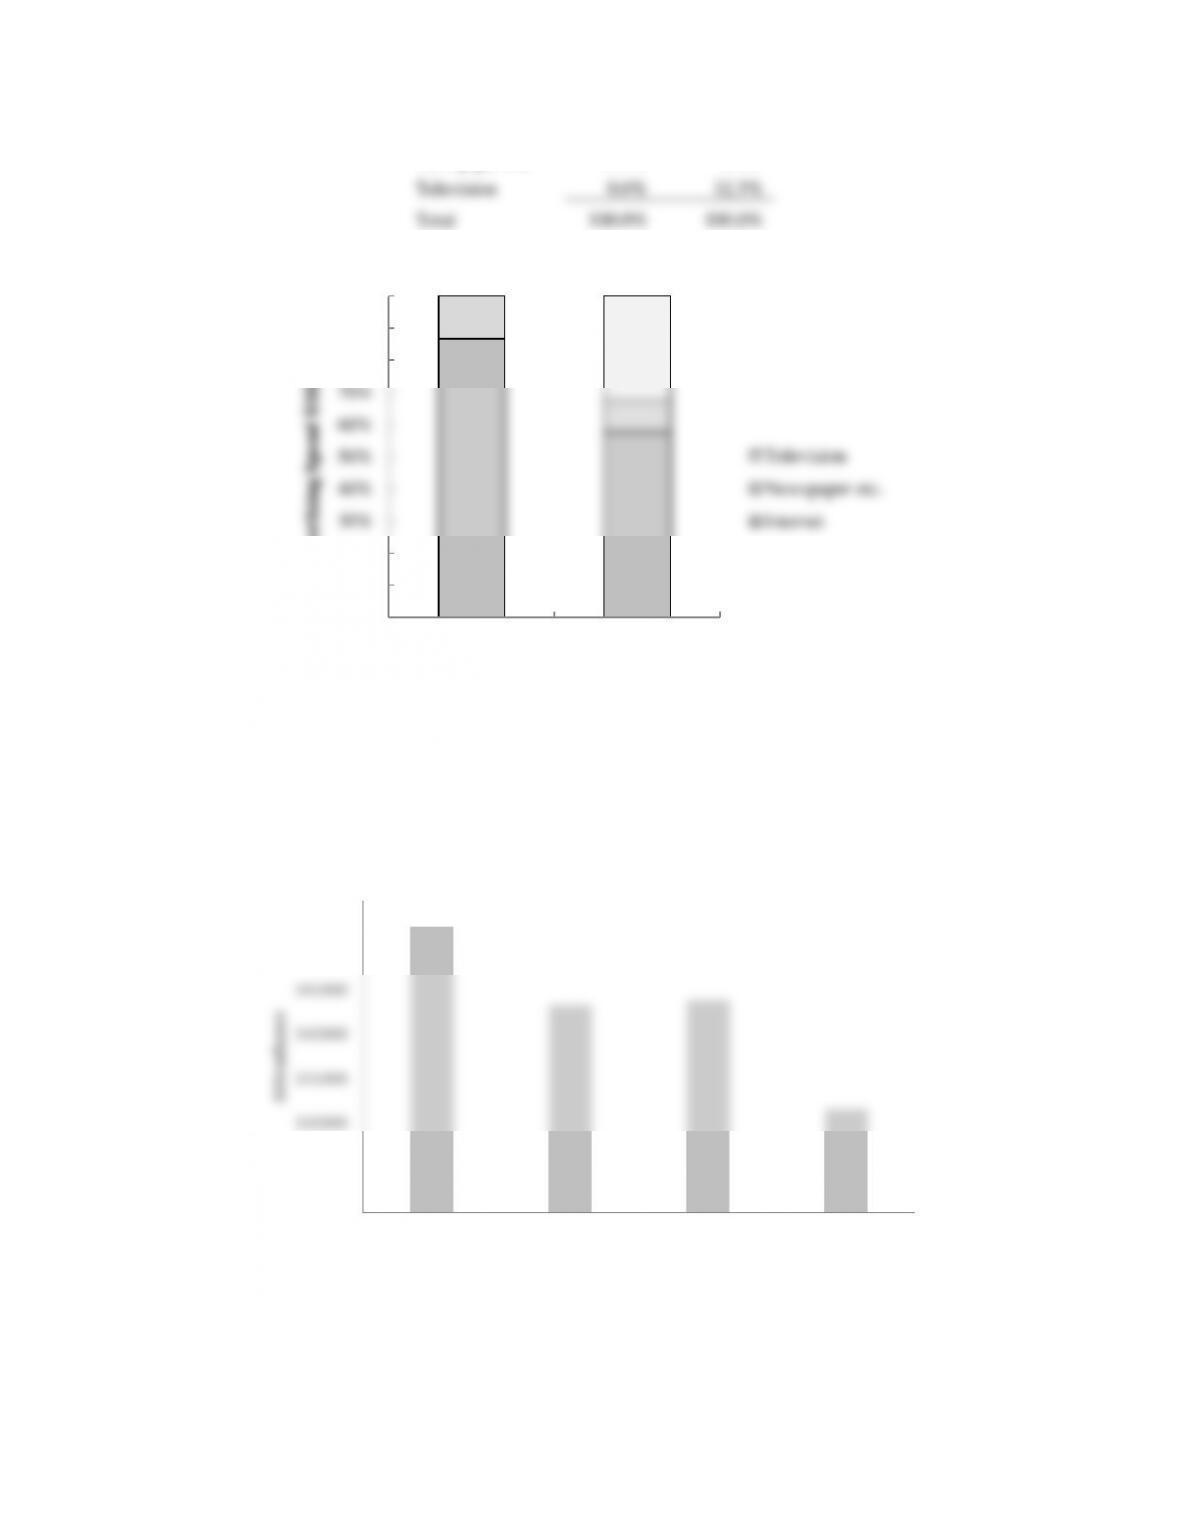
Newspaper etc.
13.3%
9.7%
Television
0.0%
32.5%
Total
100.0%
100.0%
c. The graph is part a is more insightful because is shows the allocation of the budget across media, but
also dramatic increase in the size of the budget.
58. a.
b.
0%
10%
20%
30%
40%
50%
60%
70%
80%
90%
100%
2008 2011
Advertising Spend $Millions
Year
Television
Newspaper etc.
Internet
320000
325000
330000
335000
340000
345000
350000
355000
2011 2012 2013 2014
Attendance
Year
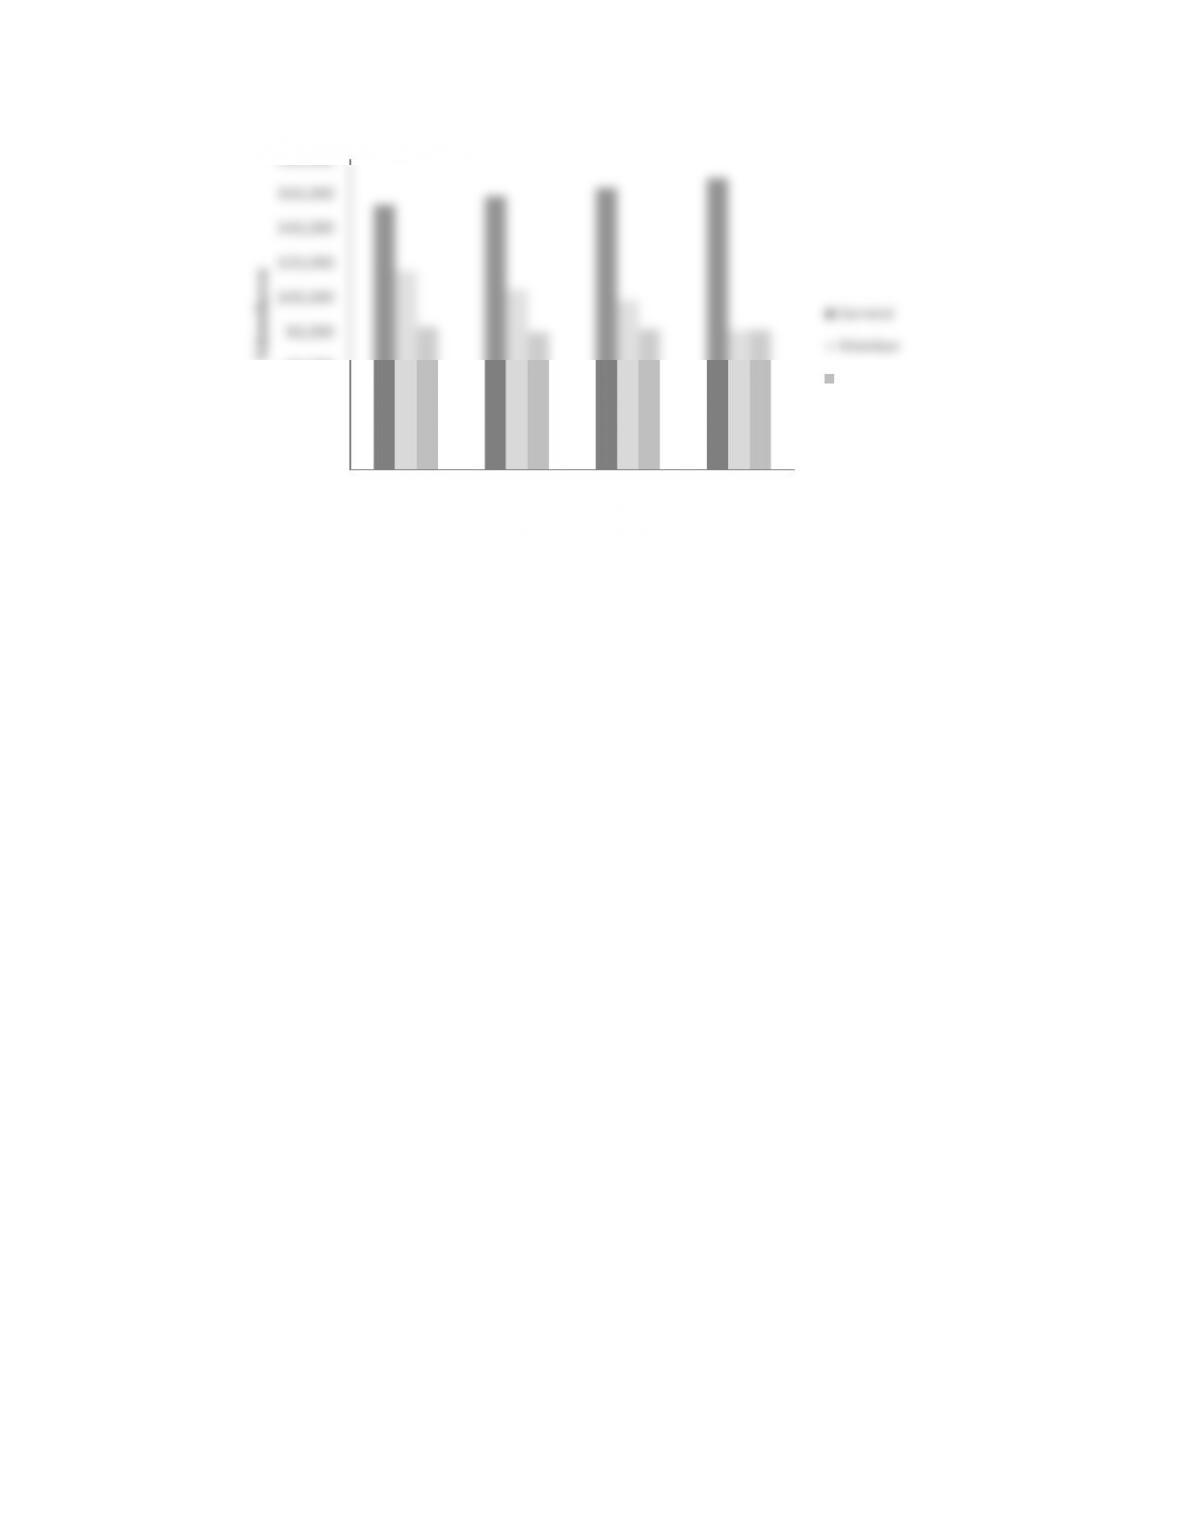
c. General attendance is increasing, but not enough to offset the decrease in member attendance.
School membership appears fairly stable.
0
20,000
40,000
60,000
80,000
100,000
120,000
140,000
160,000
180,000
2011 2012 2013 2014
Attendance
Year
General
Member
School